

Abstract
Children with autism not only display social impairments but also significant individual differences in social development. Understanding the source of these differences, as well as the nature of social impairments, is important for improved diagnosis and treatments for these children. Current theory and research suggests that individual differences in response monitoring, a specific function of the anterior cingulate cortex (ACC), may contribute to social-emotional and social-cognitive impairments and individual differences in autism. To examine this hypothesis, we used a modified flanker task to assess an ERP index of response monitoring, the error-related negativity (ERN), in a sample of higher function children with autism (HFA) and an IQ-matched control sample. The results revealed a significant Diagnostic group by Verbal IQ interaction on ERN amplitude indicating that the most verbally capable HFA children displayed significantly larger ERN amplitudes than did the control children. Within the HFA sample, greater ERN amplitude was also related to parent reports of fewer symptoms of social interaction impairments, fewer internalizing problems, but more externalizing problems, although these associations were reduced to nonsignificance when medication status was controlled. The latter results complement previous observations from imaging studies of a significant association between ACC activity and social symptoms and impairments in autism. The implications of these results for future research on brain-behavior relations, as well as treatment related research with children with autism are discussed.
Keywords: Autism, Response monitoring, Error-related negativity, Phenotypic variability
1. Introduction
Autism is a neurodevelopmental disorder characterized by the early onset of a robust disturbance of social and communicative development (Dawson et al., 2002; Volkmar, Lord, Bailey, Schultz, & Klin, 2004). Among children with autism, however, there is a good deal of variability in social symptom presentation and developmental course (e.g., Beglinger & Smith, 2001). Individual differences in social symptoms are especially pronounced among higher functioning children with autism (HFA children) whose intellectual functioning is above the range of mental retardation. Phenotypic variability among HFA children is reflected by the high rates of co-morbidity with emotional disorders involving internalizing and/ or externalizing symptoms, which complicates both diagnosis and treatment (Gillott, Furniss, & Walter, 2001; Kim, Szatmari, Bryson, Streiner, & Wilson, 2000; Meyer, Mundy, Vaughan, & Durocher, in press; Tonge, Bremerton, Gray, & Einfeld, 1999).
Understanding the nature and origins of these individual differences among HFA children is important for several reasons. The study of variability in social impairments and comorbidity in autism may assist in understanding phenotypic differences that currently complicate diagnosis, research, and treatment (Beglinger & Smith, 2001; Beauchaine, 2003; Piven, 2002). Moreover, since the broader phenotype for autism may be marked by its association with internalizing, anxiety-related disorders (Bolton, Pickles, Murphy, & Rutter, 1998; Piven, 2002), the study of the interplay between individual differences in comorbidity and social impairments in HFA children may reveal fundamental features of the underlying pathophysiology of autism (Gillberg & Billstedt, 2000; Rutter, 1996). Finally, and perhaps most importantly, research on social impairments and comorbidity is essential to understanding the specific intervention needs of HFA children (Bauminger, 2002; Rutter, 1996). This may be especially important because prevalence estimates for HFA range from 1 to 3 per 1000 children (Ehlers & Gillberg, 1993; Engstrom, Ekstrom, & Emilsson, 2002; Fombonne, 2003) and among children diagnosed with autism as many as 50% are high functioning (Honda, Shimizu, Misumi, Niimi, & Ahashi, 1996; Kielinen, Linna, & Moilanen, 2000), a rate of occurrence that is significantly higher than previous estimates (Gillberg, 1998). One approach to better understanding the phenotypic variability among HFA children is to identify markers of neurodevelopmental processes that through their influence on cognition, emotion, and motivation may account for some of the variability in patterns of social behavior. For example, Sutton et al. (2005) observed that differences in frontal EEG asymmetry, which have previously been associated with motivation, behavioral activation, and behavioral inhibition, were predictive of variations in social-emotional development and patterns of symptom presentation among HFA children.
The goal of the current study was to extend this previous work to examine response monitoring, both behaviorally and physiologically, in HFA children and matched controls. Response monitoring is a frontal executive ability associated with goal-directed behaviors and is thought to be subsumed by frontal–cortical networks including the anterior cingulate, supplemental motor area, and portions of the basal ganglia (Posner & Petersen, 1990). Current theory and research suggests that altered functioning of the frontal–cortical network and associated changes in executive functioning, including response monitoring, may contribute to social-emotional and social-cognitive impairments and variability among children with autism (Courchesne & Pierce, 2005; Hill, 2004; Mundy, 2003; Russell, 1997). To begin to address this hypothesis, we examined the degree to which an electrophysiological index of response monitoring, the error-related negativity (ERN), distinguished HFA children from matched controls. We also examined whether individual differences in the ERN were predictive of variability in symptom presentation and social-emotional development among HFA children.
1.1. Response monitoring and autism
Response monitoring is one of several cognitive processes subsumed under the umbrella term of executive functions, a class of processes thought to underlie flexible goal-directed behavior and attributed generally to the functioning of a network of inter-related neural regions including the prefrontal cortex, anterior cingulate, basal ganglia, and striatum (Shallice & Burgess, 1991; Stuss, Shallice, Alexander, & Picton, 1995). Response monitoring refers generally to the ability to monitor one’s own actions and progress towards a predefined goal and thus is essential for the successful execution of goal-directed behaviors. Specifically, when one is performing an action an internally generated monitoring system compares a representation of the correct or intended action with a representation of the actual response. If no discrepancy is detected current actions continue but if a discrepancy is detected, remedial actions are initiated (Bernstein, Scheffers, & Coles, 1995; Carver & Scheier, 1998; Coles, Scheffers, & Holroyd, 2001).
The development of response monitoring skills in early childhood is considered essential for the emergence of self-regulated behaviors and emotions in typically developing children (Kopp, 1982; Rothbart & Bates, 1998). Deficits in executive functioning, including response monitoring, have been proposed as a hallmark feature of several developmental psychopathologies including attention deficit disorder, obsessive compulsive disorder, schizophrenia, and autism (Hill, 2004; Nigg, 2000; Ozonoff & Jensen, 1999; Pennington & Ozonoff, 1996). Executive deficit hypotheses of autism have good face validity in the sense that many of the everyday behaviors of autistic individuals, such as, perseverative responding, repetitive behaviors, poor imitation skills, and joint attention impairments may involve an inability to consistently and accurately monitor ongoing behaviors (Hill, 2004; Mundy, 2003; Russell, 1997). Based on this conceptual overlap, impairments specific to self-monitoring have long been emphasized in theoretical models of autism (Dawson & McKissick, 1984; Frith & Frith, 1999; Russell, 1997). Empirically, however, there are mixed findings from studies examining various aspects of response monitoring in autistic children. While several studies have documented deficits in specific aspects of response monitoring including error correction and avoidance (Russell & Jarrold, 1998) and intention monitoring (Phillips, Baron-Cohen, & Rutter, 1998), other studies have failed to document self-monitoring as a core deficit in autism (Hill & Russell, 2002; Russell & Hill, 2001). These discrepant findings may be due in part to the lack of consistency in both the definition and assessment of response monitoring across studies (see Hill, 2004), but may also suggest that response monitoring skills are better conceptualized as a moderator of symptom presentation among HFA children rather than a specific diagnostic marker. In her review of executive dysfunction accounts of autism, Hill (2004) sites the need to move away from a focus on global executive dysfunctions in autism and rather focus on cognitive and neuroanatomical frameworks for investigation.
1.2. Response monitoring and the error-related negativity
The neuroanatomy of response monitoring has been explored using both EEG/ERP and imaging technologies. Recent research has uncovered specific electrophysiological markers of self-monitoring (Falkstein, Hoorman, Christ, & Hohnsbein, 2000; Gehring, Goss, Coles, Meyer, & Donchin, 1993; Luu, Flaisch, & Tucker, 2000). When people make an error on a speeded reaction time task, such as, a Flanker task (see Section 2), there is a negative deflection in the ongoing EEG immediately following the response. This response-locked ERP is referred to as the error-related negativity or ERN (Bush, Luu, & Posner, 2000; Gehring et al., 1993; Luu, Collins, & Tucker, 2000). The amplitude of the ERN is associated with behavioral evidence of self-monitoring (i.e., self-correction and slowing responses) and therefore is interpreted as a neurophysiological marker of error processing (Bush et al., 2000; Holroyd & Coles, 2002; van Veen & Carter, 2002).
The ERN is maximal at frontocentral midline scalp sites (Fz, FCz, Cz) and source localization studies converge on the anterior cingulate as the neural generator (Dehaene, Posner, & Tucker, 1994; Luu, Collins et al., 2000; Luu, Flaisch et al., 2000; van Veen & Carter, 2002). Several fMRI studies have localized error-related activity to the rostral ACC (e.g., Braver, Barch, Gray, Molfese, & Snyder, 2001; Kiehl, Liddle, & Hopfinger, 2000; Mathalon, Whitfield, & Ford, 2003); however, others have reported caudal rather than rostral ACC activity (e.g., Menon, Adleman, White, Glover, & Reiss, 2001). It may be that caudal aspects of the ACC respond to the cognitive conflict that is inherent to error processing, whereas the rostral ACC may be selectively engaged by error processing (Mathalon et al., 2003).
1.3. Anterior cingulate functioning and HFA
Neuroanatomically and functionally, the anterior cingulate (AC) provides an interface between frontal action selection processes, limbic emotion or motivation processes, and motor output regulation (Holroyd, Nieuwenhuis, Yeung, Nystrom, & Mars, 2004). The integral role of the AC in self-monitoring and guiding attention in relation to goal-directed actions suggests that it may be an especially important focus for research on autism. Attention regulation and motivation systems that prioritize social information processing in typical development may be disturbed in autism (Dawson, Meltzoff, Osterling, Rinaldi, & Brown, 1998; Klin, Warren, Schultz, & Volkmar, 2003; Mundy, 1995). These disturbances result in social orienting deficits and a chronic disruption of social information processing and social learning that together contribute to the social-cognitive and emotional deficits observed in autistic children (Klin et al., 2003; Mundy & Neal, 2001). Recently, several researchers have reviewed some of the behavioral and neuroscience literature relevant to this topic and converged on the hypothesis that disturbances in functions of the AC, especially functions that serve to integrate attention to self and others, may contribute to the social orienting and related social cognitive deficits of children with autism (Frith & Frith, 2001; Mundy, 2003).
Other stands of research and theory also link functions of the AC with autism. Symptoms that are often seen in children with autism, such as, apathy, inattention, dysregulation of autonomic functions, variability in pain sensitivity, akinetic mutism, and emotional instability, are often manifest in individuals with AC impairments (Bush et al., 2000). Further, clinical and subclinical levels of negative affect and anxiety, including OCD, all of which are highly comorbid with autism (Bolton et al., 1998; Piven, 2002), have been associated with exaggerated responses to errors both behaviorally and physiologically (Gehring, Himle, & Nisenson, 2000; Hajcak, McDonald, & Simons, 2004; Hajcak & Simons, 2002; Luu, Collins et al., 2000; Luu, Flaisch et al., 2000). Moreover, individual differences in the amplitude of the ERN have been related to social interactive and withdrawal tendencies among typically developing children (Henderson, 2003).
In addition to indirect associations between autism, response monitoring, and functions of the AC, there have been several recent empirical demonstrations of connections between AC functions and autism. Several imaging studies (Barnea-Goraly et al., 2004; Hall, Szectchman, & Hahmias, 2003; Levitt et al., 2003; Shoumitro & Thompson, 1998) as well as behavioral studies (Rinehart, Bradshaw, Brereton, & Tonge, 2001) suggest that anomalous functioning of the AC may distinguish between samples of individuals with autism and controls. Two independent sets of data have also directly implicated AC activity as a predictor of variability in social symptom presentation among children with autism. Ohnishi et al. (2000) examined PET regional cerebral blood flow (rCBF) and symptom presentation in children with autism and IQ matched controls. Activity in the AC and associated frontal cortex was significantly correlated with individual differences on the Impairments in Communication and Social Interaction dimensions on the Childhood Autism Rating Scale. In another study, Haznedar et al. (2000) observed that a sample of children with Autism displayed hypometabolism in the right AC relative to controls while an Asperger Disorder sub-sample displayed left AC hypometabolism relative to controls. Moreover, metabolism in the left AC was correlated with the social interaction, verbal communication, and nonverbal communication scores of the Autism Diagnostic Inventory among the Asperger subsample. Thus, there is some evidence that neural activity in the AC and related systems may be related to individual differences in social symptom presentation among children with autism.
This report describes an initial study of response monitoring among HFA children, using both behavioral and physiological measures. A group of HFA children and a group of age, gender, and verbal IQ matched control children completed a modified Flanker task in order to assess differences in behavioral responses to compatible and incompatible stimulus displays and behavioral and physiological reactions to the commission of errors. Several hypotheses and questions guided this research. First, since we were unaware of any prior assessments of response monitoring using the Flanker task with HFA children, it was important to examine the validity of the task with this population. Assuming this method would be valid, we expected diagnostic group differences in the amplitude of the ERN based on previous imaging studies indicating altered AC activity in HFA children (e.g., Barnea-Goraly et al., 2004; Hall et al., 2003). In addition, given the associations between intellectual functioning and patterns of symptom presentation among autistic children (e.g., Volkmar, Cicchetti, Cohen, & Bregman, 1992) as well associations between intellectual functioning and executive functions in general (Duff, Schoenberg, Scott, & Adams, 2005) and response monitoring specifically (Rabbitt, 1990), it also seemed important to examine whether IQ differences among children with autism affected their ERN responses or moderated diagnostic group differences on the ERN. Finally, and perhaps most importantly, we predicted that smaller amplitude ERN among HFA children would be associated with a greater number of autism-specific symptoms and poorer social-emotional development, based on the findings of previous imaging studies (Haznedar et al., 2000; Ohnishi et al., 2000).
2. Method
2.1. Participants
Data for this study were obtained for a group of 24 HFA children and 17 comparison children matched for chronological age, gender, WISC-IV Verbal Comprehension Index (VCI) scores, and WISC Perceptual Reasoning Index (PRI) scores (see Table 1). The ethnic distribution of this sample was 48.8% Caucasian, 39.5% Hispanic, 2.3% Asian, and 2.3% African American. These children were participating in a larger study of social-emotional development in HFA children (54 HFA, 64 controls). Participants from this larger pool of children were eliminated from this study because of EEG data collection problems (n = 17, 9 HFA, 8 Control), fewer than 10 artifact-free error trials on the flanker-ERN task (n = 46, 16 HFA, 30 Control), failure to match on gender or IQ with an HFA participant (n = 9 Controls), failure to meet diagnostic cut-offs on the Social Communication Questionnaire (SCQ) and/or the Autism Spectrum Screening Questionnaire (ASSQ; n = 3 HFA) or a WISC Verbal Comprehension Index <70 (n = 2 HFA). In order to examine whether the final sub-sample of 41 participants was representative of the larger group of participants, these 41 children were compared to the 77 excluded children in terms of age, medication status, verbal IQ, performance IQ, and total symptom scores on the ASSQ and SCQ. The final sample did not differ from the larger group on any of these variables. The same was true if comparisons were made separately between those included and those excluded from each diagnostic group.
Table 1.
Mean and frequency descriptive data for the HFA and control groups (SD in parentheses)
| Variables | HFA group, N = 24 | Control group, N = 17 |
|---|---|---|
| Means | ||
| Age (in months) | 136.6 (24.7) | 136.8 (22.3) |
| WISC-VCI | 100.1 (14.5) | 106.2 (12.9) |
| WISC-PRI | 99.1 (14.6) | 106.1 (10.4) |
| ASSQ | 26.7 (8.3) | 5.1 (4.9)** |
| SCQ-Total | 18.2 (4.6) | 3.0 (2.7)** |
| SCQ-Social Interaction Domain | 6.3 (2.7) | 1.0 (.97)** |
| SCQ-Communication Domain | 6.6 (1.7) | 1.6 (1.5)** |
| SCQ-Repetitive behavior | 4.0 (1.8) | 0.5 (.65)** |
| Frequencies | ||
| Male/female | 22/2 | 14/3 |
| On medications | 11 | 2* |
| Abnormal EEG/seizures | 1 | 1 |
| Right handedness | 21 | 14 |
Significant group differences,
p < .05
p < .001.
The HFA sample was recruited via a mailing sent to parents of children with Asperger Disorder and High Functioning Autism who were registered with the Center for Autism and Related Disabilities at the University of Miami. The control sample was recruited through the Miami-Dade County Public School in Miami-Dade County, Florida. Community diagnoses of an Autism Spectrum Disorder were confirmed by parent report on the Social Communication Questionnaire (SCQ) and the High-functioning Autism Spectrum Screening Questionnaire (ASSQ). The SCQ (Berument, Rutter, Lord, Pickles, & Bailey, 1999) is a brief instrument for the valid screening or verification of autism spectrum disorder symptoms in children. It was developed from the 40 critical items of the ADI and compiled into a parent report questionnaire (Berument et al., 1999) and has a criteria score of 15 or higher (Rutter, Bailey, & Lord, 2003). The ASSQ (Ehlers, Gillberg, & Wing, 1999) is a 27-item checklist and was designed to be completed as a brief screening device to identify symptoms associated with either Asperger Syndrome (AS) or other high-functioning autism spectrum disorders in children and adolescents of normal intelligence or mild mental retardation and has a criterion score of 13 (Ehlers et al., 1999). Children who met criteria on one or both of these measures were included in the HFA group. No child recruited as part of the control sample met diagnostic criteria on either measure. To ensure a higher-functioning sample, only children with WISC-VCI >70 were included in either sample.
2.2. Procedure
Two 2-h lab sessions were conducted with each child. The first focused on behavioral data collection including cognitive, social and emotional assessments and the second focused on psychophysiological data collection which included the EEG session and completion of the Flanker task. At the start of the first session, parents signed an informed consent and children signed an informed assent.
2.3. Behavioral measures
2.3.1. Cognitive
All participants were administered four subtests from The Wechsler Intelligence Scale for Children (WISC-IV, Wechsler, 2003): Similarities, Vocabulary, Block Design, and Matrix Reasoning. Prorated Verbal Comprehension (VCI, based on Vocabulary and Similarities) and Perceptual Reasoning Index scores (PRI, based on Block Design and Matrix Reasoning) were obtained.
2.3.2. Social-emotional functioning
The Behavioral Assessment System for Children Self-Report of Personality and Parent-Report of Personality (BASC-SRP, PRP; Reynolds & Kamphaus, 1998) were used to assess multiple dimensions of the behavioral and emotional status of participants. Two forms are available depending on age level: child (8–11) and adolescent (12–18). To assess both internalizing and externalizing type symptoms, the Anxiety, Depression, Social Stress, Interpersonal Relations, and Locus of Control scales from the child self-report measure were examined. From the parent-report measure, Externalizing and Internalizing scores were examined. The BASC has well-established norms and psychometrics (Reynolds & Kamphaus, 1998) and previous research indicates that parent and child self-report on the BASC provides valid information on the social-emotional status of HFA children (Meyer et al., in press; Sutton et al., 2005).
The Social Anxiety Scale for Children-Revised (SASC-R; La Greca & Stone, 1993) was also used to gather child self-report data on the social-emotional functioning of participants in this study. The child self-report versions of the SASC-R includes 22 items rated on a 5-point scale according to the degree items apply to a child (1 = “not at all” to 5 = “all the time”). Items are summed to yield standard scores along three dimensions: Fear of Negative Evaluation from Peers (FNE), Social Avoidance and Distress-Specific (SAD-N), and Social Avoidance and Distress-General (SAD-G). An overall total score is obtained by summing the scores for the three subscales. The SASC-R demonstrates good criterion validity with scaled scores differentiating socially anxious from non-socially anxious children and relating to peer rejection (La Greca & Lopez, 1998) and the SASC-R yielded valid observations in previous studies of HFA children (Meyer et al., in press; Sutton et al., 2005).
2.4. Electrophysiological collection and recording
EEG was collected using a Lycra stretch electrocap with the position of individual electrodes corresponding to the international 10–20 electrode system. Cap sizes were selected for each child based on measured head circumference. EEG was recorded from 19 scalp sites (F7, F3, Fz, F4, F8, and FCz [frontal], C3, Cz, C4 [central], T7, T8 [anterior temporal], M1, M2 [Mastoids], P3, Pz, P4 [parietal], O1, O2 [occipital]), with a ground electrode at site AFz. EEG signals were referenced to Cz and eye movements (electro-oculograms, EOG) were recorded with electrode pairs placed at the supra- and sub-orbit of one eye and at the external canthi of each eye. EEG signals and EOG signals were amplified by factors of 5000 and 2500, respectively, with the high-pass filter settings at 0.1 Hz and the low-pass filter settings at 100 Hz.
2.5. ERN flanker task
After acquiring six minutes of eyes open and eyes closed resting EEG, a modified version of the Eriksen flanker task was administered. In this task children are required to indicate the direction of a central target in an array of 5 stimuli on compatible trials (<<<<< or >>>>>) or on incompatible trials (<<><< or >><>>), in which the target stimulus faces in the opposite direction from all other stimuli in the array. Correct performance required the child to press the button on the keypad that corresponded to the direction of the center arrowhead. The child was seated approximately 70 cm from a computer monitor holding a small box with two buttons on his/her lap. A small fixation mark (a red dot) remained in the center of the monitor throughout the task, with the stimulus arrays presented just above the fixation mark. The child completed a shortened block of practice trials and timing trials prior to cap placement. Children who committed eight errors or less during the 50 timing trials, were administered 3 blocks of 96 (288) data collection trials consisting of a 200 ms warning cue (an asterisk), a 300 ms delay, and one of the four target displays lasting for 200 ms. They then had 800 ms to make their response. Children who committed more than eight errors during the timing trials, were administered 3 blocks of 96 (288) data collection trials consisting of a 200 ms warning cue, a 300 ms delay, and one of four target displays lasting for 250 ms, with 1100 ms to make their response. Both sets of timing parameters were based on data recently provided by Davies, Segalowitz, and Gavin (2004). The order of compatible and incompatible trials was counterbalanced so that the probability of each target display was .25 across a block of trials. Each task block lasted approximately 7 minutes, for a total of 21 minutes of testing.
2.6. Behavioral analysis
Reaction time (RT) was recorded for every trial and mean reaction times were computed separately for compatible versus incompatible trials. RT measures began with the presentation of the target display and ended when a button press was detected or when the trial ended, whichever came earlier. Error rates were computed separately for compatible versus incompatible trials.
2.7. EEG analysis
Data from all channels was re-referenced offline to an average mastoids configuration. The EEG was visually reviewed offline by a trained assistant in order to identify and remove any additional sources of artifact. The EEG was corrected for artifact due to eye movements using a regression analysis (ERP Analysis System, James Long Company). In order to examine children’s responses to the commission of errors, the artifact-free EEG was response-locked and averaged for each participant separately for error and correct response trials using a minimum of 11 artifact-free trials. The mean number of artifact-free error trials used to compute the grand mean was 40 (SD = 32) across the entire sample, 48 (SD = 35) for the HFA sample alone, and 28 (SD = 23) for the control sample alone. Based on prior work indicating that the ERN maximal along the midline (e.g., Luu, Collins et al., 2000; Luu, Flaisch et al., 2000), data were analyzed at the four midline recording sites: frontal (Fz, FCz), central (Cz), and parietal (Pz). To compute the error-related negativity (ERN), each channel of averaged EEG was baseline corrected using a 100-ms window spanning 150 to 50 ms prior to response onset and digitally re-filtered with a 30 Hz low-pass filter. The ERN was quantified using a negative peak voltage method in which the minimum voltage value (i.e., negative peak) occurring up until 150 ms following the response onset was recorded. Thus, the primary dependent variable based on the EEG data from the flanker task was the negative peak voltage averaged across all error trials and all correct trials. As well, the latency of the negative peak was recorded.
3. Results
3.1. Validity of flanker paradigm
3.1.1. Flanker behavioral performance
Valid performance on the Flanker task is indicated in part by the systematic tendency to commit more errors and respond more slowly on incompatible versus compatible trials. To evaluate the degree to which the children in the control and HFA groups performed in this expected fashion, repeated measures analyses of participants’ error rates and reaction times on incompatible versus compatible trials were computed. The analysis of error rates revealed a main effect of compatibility, F(1, 39) = 59.71, p < .001, and a main effect of group, F(1,39) = 5.84, p = .02. Specifically, all participants made significantly more errors on incompatible (M = 26.84%) versus compatible (M = 9.89%) trials and HFA participants made more total errors (M = 22.3%) than did controls (M = 12.8%). The group by compatibility interaction was not significant (F(1,39) = 1.35, ns).
Similarly, the analysis of reaction times revealed a main effect of compatibility, F(1,39) = 70.78, p < .001. Specifically, all participants responded more slowly on incompatible (M = 456 ms) versus compatible (M = 405 ms) trials. The main effect of group approached significance, F(1, 39) = 3.33, p = .08, as did the interaction of group by compatibility F(1, 39) = 3.47, (p = .07). These trends reflect the fact that although the HFA participants displayed a typical pattern of responding across incompatible and compatible trials, in general they tended to respond more quickly than controls, particularly on incompatible trials. Together these behavioral data suggest that despite poorer performance overall by the HFA children, all participants adjusted their reaction times and committed more errors on incompatible compared to compatible trials.
3.1.2. ERN amplitude by response type, scalp site, and diagnostic group
The literature on ERN leads to the expectation that response-locked ERPs will show larger amplitude negative waveforms and greater discrimination between error and correct responses at more anterior versus posterior midline EEG recording sites. To examine the spatial distribution and amplitude differences of ERPs to error versus correct responses, a repeated measures ANOVA was computed with ERPs averaged separately by response type (error vs. correct) and four midline scalp sites (Fz, FCz, Cz, Pz). To examine the comparability of the ERPs across the HFA and control samples, Diagnostic group was included as a between subjects variable. The 2 (Group) × 2 (response type) × 4 (scalp site) analysis of variance with Greenhouse-Geisser adjusted degrees of freedom revealed a main effect of site (F(1.53, 59.55) = 19.14, p < .001) that was qualified by interactions with (a) response type (F(1.62, 63.07) = 12.83, p < .001), and (b) Diagnostic group (F(1.53, 59.55) = 3.56, p < .05). With respect to the interaction between site and response type, across all participants the ERNs were larger for error versus correct trials at the frontal sites Fz (t(40) = −1.92, p = .06) and FCz (t(40) = −2.07, p < .05). The ERN was also larger for error versus correct trials at Cz (t(40) = −1.56, p = .12), although not significantly. At Pz, there was a significant difference between error and correct trials, however, opposite in direction than predicted (t(40) = 2.32, p < .05) (see Table 2 and Fig. 1). Thus, across both diagnostic groups, there was a frontal–central distribution of the ERN that is comparable to prior studies.
Table 2.
Mean peak negative amplitude (μV) for error and correct trials by diagnostic group
| ERN site | HFA |
Control |
||||
|---|---|---|---|---|---|---|
| Error | Correct | Total | Error | Correct | Total | |
| Fz | −6.2 (5.8) | −4.3 (7.3) | −5.3 (5.7) | −4.0 (5.5) | −1.9 (3.8) | −3.4 (6.2) |
| FCz | −6.5 (6.7) | −4.2 (7.5) | −5.6 (6.3) | −4.4 (5.8) | −2.3 (3.9) | −3.4 (6.3) |
| Cz | −4.6 (7.8) | −3.6 (5.8) | −4.2 (7.0) | −3.7 (5.8) | −2.2 (3.5) | −2.6 (6.4) |
| Pz | 0.9 (6.4) | 0.2 (4.2) | 0.6 (5.6) | −0.8 (6.8) | −2.1 (4.7) | −1.3 (6.0) |
Fig. 1.
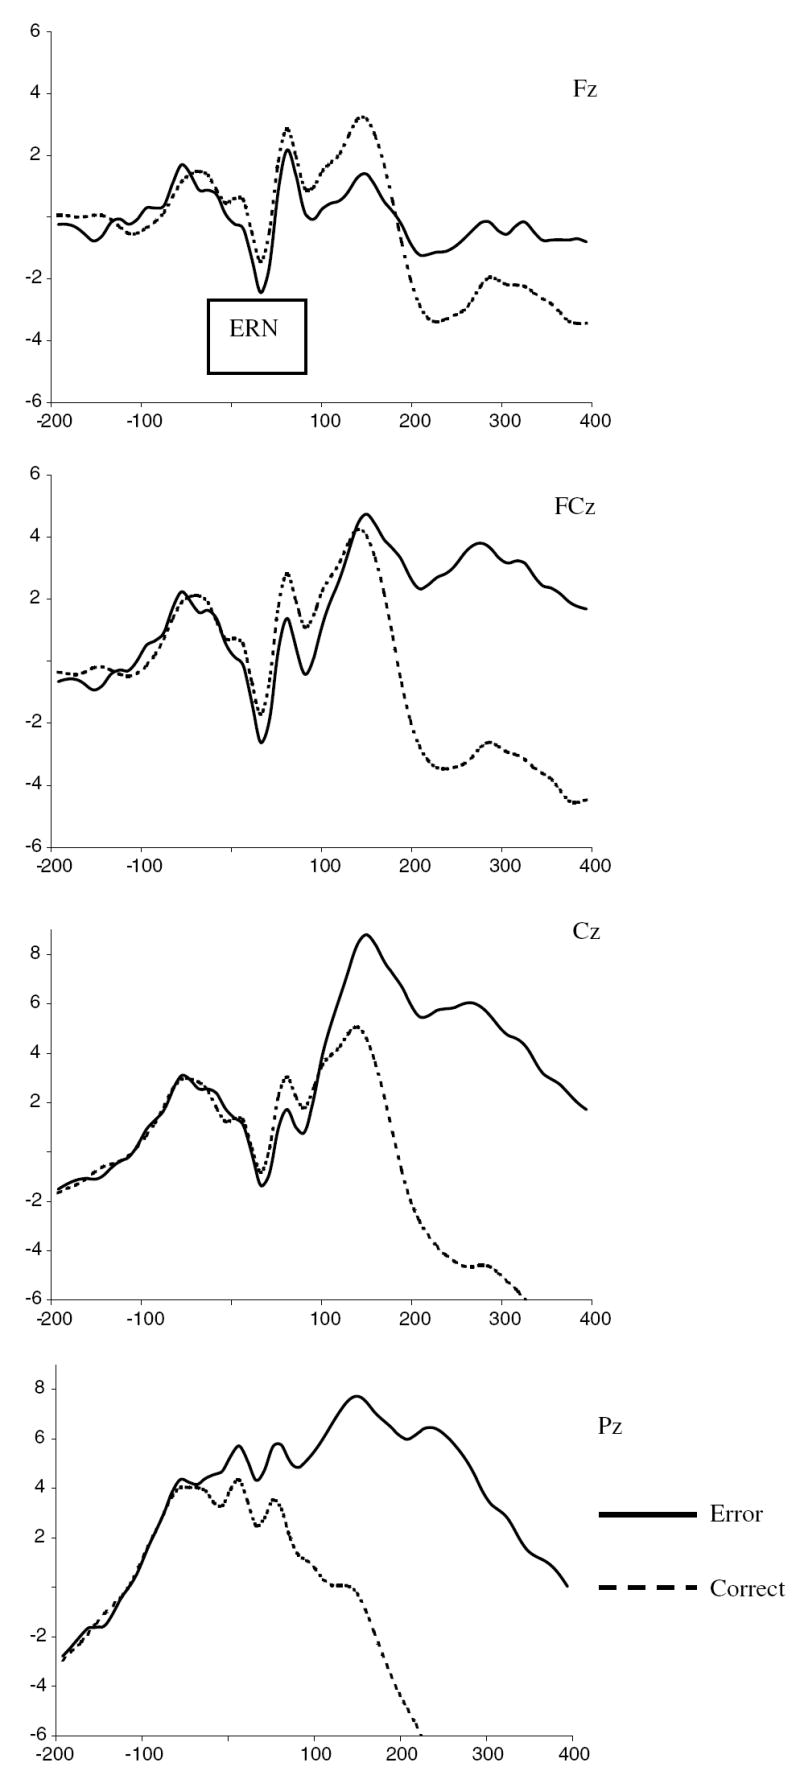
ERP waveforms for error and correct trials at Fz, FCz, Cz, and Pz, for entire sample (n = 43).
To explore the site by diagnostic group interaction, between group comparisons of the waveforms averaged across correct and error responses showed that children in the HFA and control samples did not differ in the peak negative amplitude at any single site. However, within group comparisons of peak negative amplitude across site revealed slightly different patterns between the diagnostic groups. Specifically, among the HFA sample, paired comparisons across sites revealed that the peak negative amplitude at FCz was significantly larger than at Cz (t(23) = −2.83, p = .009) and Pz (t(23)= −6.37, p <.001), but not Fz (t(23) = .057, ns). The amplitude at Fz was significantly larger than Pz (t(23)= −4.91, p < .001) and tended towards significance compared to Cz (t(23)= −1.77, p = .09). The amplitude at Cz was significantly larger than Pz (t(23) = −6.70, p < .001). In contrast, among children in the control sample, the peak negative amplitude was maximal at FCz and Cz, with both of these sites differing significantly from Pz (t(16) = −2.17, p = .045 and t(16)= −2.29, p = .036, respectively), but not from each other (t(16) = −.77, ns). The peak negative amplitude at Fz did not differ significantly from any of the other sites (see Table 2).
3.2. Diagnostic group differences in ERN amplitude
The foregoing analyses indicated the expected frontal–central distribution of the ERN was evident in the data for both groups. Therefore, the primary group comparison analyses in this study were conducted using only the data from error trials and from the frontal–central sites, Fz, FCz, and Cz.
3.2.1. Identification of factors related to ERN amplitude
Prior to these group comparisons preliminary analyses indicated that for children with HFA, verbal abilities tended to relate to ERN amplitude. Specifically, higher verbal IQs were associated with larger amplitude ERNs at Fz, FCz, and Cz (rs(24) = −.36, −.37, and −.35, respectively, all ps < .10). Therefore, all subsequent diagnostic group analyses included a between subjects factor labeled Verbal IQ Group (Lower vs. Higher), which was created using a median split such that children with VIQ less than 103 were in the Lower group and children with VIQ equal to or greater than 103 were in the Higher group (see Table 3). In addition, comparison of the HFA children on or off medication at the time of study (see Table 1; medication variable scored 1 = yes, 2 = no) indicated that the medicated participants tended to display larger ERN amplitudes at Fz, Fcz, and Cz (rs(24) = .74, .72, and .58, respectively, all ps < .004). Seven children had been prescribed stimulants and 7 had been prescribed antidepressants. This number appears to exceed the total of 11 children on medication in the HFA group (see Table 1) because 5 children were prescribed multiple medications. Analyses indicated that the number of medications was not related to ERN amplitude but that variables reflecting either “stimulant” medication or “anti-depressant” were related to ERN amplitude in a manner similar to the general “medication” variable. Among the HFA children, those on medication were more likely to be classified in the Higher (n = 9) versus Lower (n = 2) VIQ group and those not on medication were less likely to be classified in the Higher (n = 2) versus Lower (n = 9) VIQ group. Preliminary analyses also indicated that across both diagnostic groups, the fewer errors children committed, the larger the amplitude of the ERN at FCz, Cz (rs (41) = .36, .57, respectively, ps < .015) with a trend in the same direction at Fz (r(41) = .26, p < .10). Therefore, all significant analyses were re-run, controlling for medication status (on versus off) and flanker task performance (error rates).
Table 3.
Mean ERN amplitude (μV) at Fz, FCz, and Cz for diagnostic and VCI groups
| Variable | HFA |
Control |
||
|---|---|---|---|---|
| Higher VCI | Lower VCI | Higher VCI | Lower VCI | |
| N | 11 | 13 | 8 | 9 |
| VCI | 113 (8.0) | 88.8 (12.5) | 118 (8.3) | 96 (9.2) |
| ERN | ||||
| Fz | −8.9 (3.5) | −3.8 (6.4) | −2.8 (6.6) | −5.0 (4.4) |
| FCz | −9.9 (4.9) | −3.6 (6.8) | −3.3 (7.0) | −5.4 (4.6) |
| Cz | −8.7 (6.7) | −1.1 (7.2) | −2.8 (7.2) | −4.4 (4.4) |
3.2.2. The relations between diagnostic group, verbal IQ, and ERN amplitude
A repeated measures analysis of the effects of Diagnostic group (HFA vs. control) and Verbal IQ group (low vs. high) on the ERN amplitude at Fz, FCz, and Cz revealed a main effect of site (F(2, 36) = 5.72, p < .01) and a significant Diagnostic group by VIQ group interaction, F(1, 37) = 5.32, p = .027 (see data in Table 3). Post hoc paired comparisons showed that across both diagnostic groups, the amplitude of the ERN at FCz was greatest followed by Fz then Cz, with a significant difference between FCz and Cz (t(40) = −2.75, p < .01). Post hoc analyses of the interaction effect revealed that combined across the three sites, HFA children with higher VCIs had significantly larger ERNs compared to HFA children with lower VCIs (F(1, 22) = 7.40, p < .05) and compared to children in the control group with equally high VIQs (F(1, 17) = 5.72, p < .05). VCI differences were not significant among children in the control group (F(1, 15) = .50, ns) and diagnostic group differences were not significant among children with relatively low VCI scores (F(1, 20) = .70, ns). That is, HFA children with relatively high VIQ showed significantly larger ERN amplitudes compared to all other children (see Fig. 2). When the identical analyses were conducted controlling for medication status, there was a trend toward significance for the diagnostic by VIQ group interaction (F(1, 36) = 3.35, p = .07). Post hoc ANCOVAs revealed that among children in the higher VIQ Group, the HFA children displayed larger amplitude ERNs compared to controls (F(1, 16) = 4.32, p = .05). In contrast, among children in the lower VIQ group, the HFA children tended to display smaller amplitude ERNs compared to controls (F(1, 19) = 3.72, p = .07). Thus, when medication effects were controlled possible groups difference on ERN were revealed for these children as well.
Fig. 2.
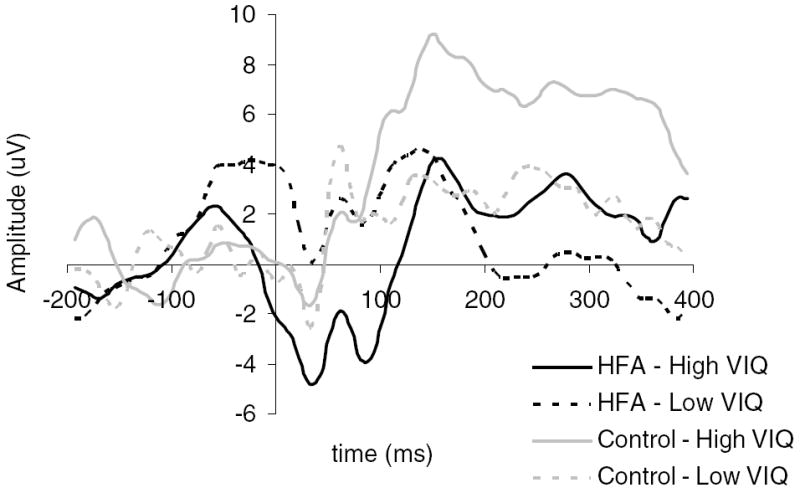
Diagnostic and VIQ group differences in ERN amplitude at anterior sites.
When the identical analyses were conducted controlling for error rates on the Flanker task, the ANCOVA revealed a significant effect of Diagnostic group, F(1, 36) = 5.01, p = .03, and a trend for an interaction between Diagnostic and VIQ groups, F(1,36) = 3.05, p = .09. Specifically, controlling for error rates, children in the HFA group had significantly larger amplitude ERNs averaged across sites compared to children in the control group. The interaction effect reflected the same pattern as in the original analyses, such that among children in the high VIQ group, those with HFA had significantly larger amplitude ERNs compared to those in the control group (F(1, 16) = 16.77, p = .001). There were no significant differences between the Diagnostic groups among the children in the relatively low VIQ group (F(1, 19) = .09, ns). Among the HFA children, those with relatively high VIQ had significantly larger ERNs compared to those with low VIQ (F(1, 21) = 4.58, p = .04). VIQ was unrelated to differences in the ERN among children in the control group (F(1, 14) = .16, ns).
3.2.3. ERN latency by scalp site and diagnostic group
A repeated measures ANOVA was conducted to examine the effects of site, diagnostic group, and verbal IQ on the latency of the ERN. There was a main effect of diagnostic group (F(1,37) = 4.14, p < .05), such that the ERN peak amplitude was apparent slightly later (57 ms post response) for the HFA sample versus the control sample (34 ms post response). This effect of diagnostic group reduced to a trend (p = .08) when medication status was controlled for and reduced to non-significance when error rates were controlled.
3.3. ERN amplitude in relation to individual differences in social, emotional, and symptom presentation among the HFA sample
To replicate and extend previous research (Haznedar et al., 2000; Ohnishi et al., 2000), a primary goal of this study was to examine the degree to which individual differences in ERN amplitudes, used as a neurophysiological index of self-monitoring, were related to differences in symptom presentation and social/emotional profiles among the children in the HFA sample.
To examine the associations between the amplitude of the ERN and symptom presentation as well as social and emotional functioning, parametric correlations (Pearson’s r) were computed in all analyses with a conventional two-tailed α level of .05. However, given the possibility of type II errors in small samples, associations that achieved an α level of .075 were also noted. Significant correlations were followed up with partial correlations controlling for effects of WISC-VCI, medication, and flanker task performance (error rates), variables found to be associated with the amplitude of the ERN.
3.3.1. ERN and symptom presentation
Consistent with a priori expectations based on previous research (Haznedar et al., 2000; Ohnishi et al., 2000) evidence of an association between ERN amplitude and symptom presentation was observed in the HFA sample. ERN amplitude at Cz was positively correlated with Social Interaction Domain scores from the SCQ (r(24) = .46, p < .025) (see Fig. 3 and Table 4) and was marginally associated with the total SCQ scale score (r(24) = .39, p < .06). These correlations remained comparable when VIQ, medication status, and error rates were controlled. Specifically, the partial rs between the ERN amplitude at Cz and Social Interaction Domain scores controlling for VIQ, medication status, and error rates, respectively, were .49, .43, and .45, all ps < .05. The partial correlations between the ERN amplitude at Cz and the SCQ total score controlling for VIQ, medication status, and error rates, respectively, were .39, .34, and .44, ps < .11.
Fig. 3.
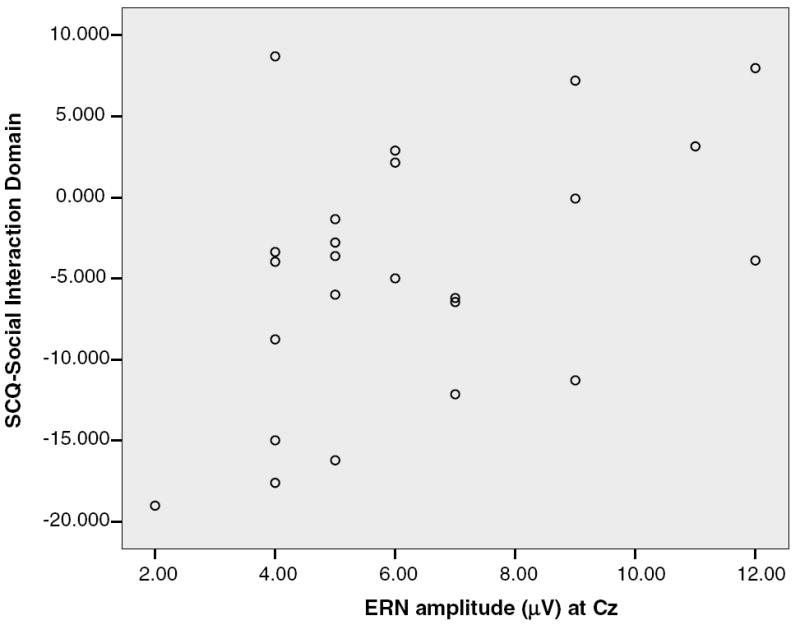
Correlation of ERN amplitude at Cz with the social interaction domain score on the SCQ.
Table 4.
Associations of ERN amplitude with symptom presentation and composite measures of internalizing problems and social stress
| Variables | Fz ERN r | FCz ERN r | Cz ERN r |
|---|---|---|---|
| SCQ-Social Interaction | |||
| Domain score | .23 | .34 | .46* |
| Total score | .19 | .31 | .39^ |
| Internalizing Problems | .47* | .43* | .43* |
| Social Stress | −.31 | −.35^ | −.41* |
n = 24.
p < .05.
p < .10.
3.3.2. ERN and social-emotional differences
To reduce the number of correlations computed in this aspect of the analyses two theoretically and empirically derived composite measures of social/emotional functioning were computed for the BASC and SASC-R scales. An index of Internalizing Problems was created by standardizing and summing scores on self-reported (1) General Social Anxiety on the SASC-R, (2) Specific Social Anxiety on the SASC-R, (3) Anxiety on the BASC, and (4) Depression on the BASC. These four measures were highly intercorrelated with Pearson’s r values ranging from .42 to .70. An index of Social Stress was created by standardizing and summing scores on self-reported (1) Locus of Control on the BASC, (2) Social Stress on the BASC, and (3) parent reported Externalizing problems on the BASC. Pearson’s r values between these three variables ranged from .33 to .72. The two composite measures were unrelated statistically (r(24) = .25, ns), supporting the idea that they reflected two unique aspects of social/emotional functioning.
The results of the analyses involving these composite social-emotional measures in relation to ERN amplitude are presented in Table 4. The composite measure of Internalizing Problems was positively correlated with the ERN amplitude at each of the individual sites (Fz, r(24) = .47, p < .05, FCz r(24) = .43, p < .05, Cz r(24) = .43, p < .05). These data indicated that HFA children with greater negative ERN amplitude tended to have lower scores on measures of internalizing emotional problems. In contrast, the composite measure of Social Stress was negatively correlated with the amplitude of the ERN at Cz (r(24) = −.41, p < .05), and tended towards significance at FCz (r(24) = −.35), p < .10. These data indicated that HFA with greater negative ERN amplitude tended to have higher scores on the Social Stress composite. The relations between the ERN and Internalizing Problems were basically unchanged controlling for error rates, but were reduced to nonsignificance when VIQ or medication status were controlled. In contrast, the relations between the ERN and Social Stress were strengthened when controlling for VIQ: Fz (r(21) = −.39, p < .07), FCz (r(21) = −.43, p < .05), and Cz (r(21) = −.49, p < .05). The association between the ERN at Cz and Social Stress became a trend (r(21) = −.39, p < .07) after controlling for error rates, and nonsignificant after controlling for medication status (r(21) = −.33, ns).
4. Discussion
Recent theory and research has suggested that functional disturbances in frontal–cortical networks including the ACC, which underlie executive processes including self-monitoring, may contribute to the social-emotional and social-cognitive impairments of autism (Barnea-Goraly et al., 2004; Haznedar et al., 2000; Levitt et al., 2003; Mundy, 2003; Ohnishi et al., 2000; Russell, 1997). In this study we provide the first direct test of this self-monitoring hypothesis of autism by examining an event-related potential measure of response monitoring, the ERN, in relation to (1) diagnostic group differences between children with HFA and a sample of age, gender, and VIQ-matched controls, and (2) variability in symptom and social-emotional presentation among children with HFA. Several important observations were revealed in this study.
First, during the Flanker task both HFA children and children in the control group displayed the expected pattern of longer reaction times and higher error rates when presented with incompatible trials. Although the HFA children performed less well overall, the similar patterns of behavior across diagnostic groups demonstrated that the HFA children clearly understood the goal of the task and modified their behaviors according to the increased level of difficulty of incompatible trials. Further, response-locked ERPs averaged separately for error and correct trials also showed that regardless of diagnostic group, children showed larger amplitude negative deflections following error versus correct trials, and that the discrimination between error and correct response trials was maximal at frontal–central midline recording sites (Fz, FCz, Cz), but not at the parietal midline site (Pz). This pattern of localization is consistent with several previous ERN studies (e.g., Falkstein et al., 2000; Gehring et al., 1993), and source localization studies using high density EEG recordings, fMRI, and MEG indicating that the neural generator of the ERN most likely lies in the rostral region of the ACC (Dehaene et al., 1994; Kiehl et al., 2000; Miltner et al., 2003). Together, the behavioral and physiological results suggest that this type of ERN paradigm may be a valid, new, and useful tool allowing for the noninvasive assessment of brain-behavior relations among HFA children.
As a group, children in the HFA sample displayed longer ERN latencies. These temporal differences suggest slowed or less efficient neural processing of error-related information and are consistent with prior studies with autistic children in which longer ERP latencies were observed during face (McPartland, Dawson, Webb, Panagiotides, & Carver, 2004) and visuospatial (Townsend et al., 2001) processing tasks. Less efficient processing could be a result of diminished functional connectivity among cortical brain regions or a disruption of the white matter tracts in a variety of cortical areas, including the ACC, both of which have been reported in children with autism (Barnea-Goraly et al., 2004; Courchesne & Pierce, 2005; Just, Cherkassky, Keller, & Minshew, 2004). Given that the HFA sample performed less well on the task overall, however, it is not clear whether these differences in latency are a direct reflection of the pathophysiology of autism or rather a reflection of this poorer behavioral performance. Regardless, together with the behavioral data, it appears that as a group, the HFA children were engaging in less efficient response monitoring during the Flanker task.
As a group, the HFA sample did not differ in the amplitude of the ERN relative to children in the control group. However, diagnostic group differences were apparent when variations in verbal abilities were examined. Specifically, HFA children with higher WISC-VCI scores displayed significantly larger ERN amplitudes at frontal–central midline sites compared to those in the control group with equally high VCI scores, even after considering medication or task performance effects. In contrast, HFA children with lower VCI scores tended to display smaller amplitude ERNs compared to controls, although not significantly so. This finding suggests that higher verbal ability among HFA children is associated with a unique profile of hyper-sensitivity to errors, perhaps reflecting a hyper-engagement of the ACC following the commission of errors.
4.1. The significance of ERN differences in HFA children
The pattern of ERN responding displayed by the HFA children in this study was different from the ERN pattern displayed by some other clinical groups. Research on schizophrenia, for example, indicates that individuals with that disorder display a pattern of decreased ERN and increased CRN amplitudes (Mathalon et al., 2002). However, the enhanced ERN amplitude displayed by the some of the children in our HFA sample was similar to the profile observed among adults with symptoms of anxiety disorders (e.g., Gehring et al., 2000; Johannes et al., 2001; Hajcak & Simons, 2002). In these studies enhanced ERN responding was interpreted as reflecting increased reactivity or sensitivity of the supervisory attention and self-action monitoring system.
Interestingly, in this study, the pattern of enhanced ERN did not relate to anxiety symptom presentation in the same way. Among the HFA sample, larger amplitude ERNs were associated with lower levels of self-reported social anxiety and depression and higher levels of social stress and parent-reported externalizing problems. These associations likely require interpretation within the context of a child’s actual social skills and competencies. Specifically, for HFA children, the tendency to engage in self-monitoring may facilitate social communication and over time and development make social interactions more predictable and therefore less anxiety provoking. However, given that impaired social interactive abilities are a hallmark feature of autism, these children are probably more aware of their social difficulties as indexed by the association between ERN amplitude and the composite measure of social stress. It is important to note, however, that the associations between the ERN and social/emotional characteristics were reduced to nonsignificance when medication status was controlled.
In addition to relating to social/emotional characteristics, enhanced ERN amplitude among HFA children in this study was associated with parent reports of fewer symptoms of social impairments on the SCQ. This association was not affected by the medication status of the child. These findings complement previous observations from imaging studies with autistic children that indicated that differences in metabolic activity measures of the ACC were related to social symptom reports on the CARS (Ohnishi et al., 2000) and the ADI (Haznedar et al., 2000). Thus, there are now three independent studies that forge links between ACC functioning and individual differences in social symptoms in autism. The results of this study may serve to clarify the nature of the connection between the ACC and individual differences in social symptom in autism. Specifically, the pattern of individual difference data in this study suggests that enhanced ERN/ACC functioning may reflect an adaptive or compensatory processes where by augmented ACC reactivity enables HFA children to rapidly monitor information about their own actions with reference to a prespecified goal, and therefore engage in more adaptive goal-directed behavior. The rapid nature of the monitoring reflected in ERN is consistent with theory suggesting that rapid response monitoring and behavior alteration may be very important to adaptive social skills in HFA children (Klin & Volkmar, 1997).
Our interpretation of the results of this study is consistent with many aspects of theory and research that suggests that ACC-mediated response monitoring may contribute to the social-emotional and social-cognitive development in autism (Mundy, 2003). However, while emphasizing the possible role of ACC-related self-monitoring deficits in autism, Mundy (2003) also noted Devinsky and Luciano (1993) (’s) admonition that ACC impairment related behavioral deficits emerge only when they are combined with disturbances in other related functional neural networks. In keeping with this notion, the data in the present study do not speak so much to deficits in response monitoring processes across the HFA group as a whole. Instead, they appear to indicate the possibility that variations in ACC engagement and associated response monitoring processes may moderate the relations between other processes involved in the social impairments of autism and profiles of social impairment and social-cognitive functioning. Moreover, recent research linking the transcriptional control region of a serotonin transporter gene (5-HTTLPR) to individual differences in ERN amplitude (Falgatter et al., 2004) suggests it may be possible to examine the genetic contributions to such moderating processes in autism. Additional ERN studies will also be needed to explore this issue and to determine whether deficits in ACC response monitoring are characteristic of some subgroups of children with autism, perhaps lower functioning children, as may be suggested by the data from the lower VCI groups in this study.
4.2. Implications
Although intriguing, the observations and speculation of this first study of response monitoring and the ERN in autism clearly require replication and extension before firm conclusions and interpretations may be formed. To stimulate further work in this area it may be helpful to comment on one or two additional implications and heuristic connections that can be made from this study. First, as noted above, it should be clear that this study does not necessarily indicate that enhanced response monitoring is a core feature of autism since many children with autism did not display this type of ERN response. Rather, in keeping with our recent related study of EEG asymmetry in autism (Sutton et al., 2005), it may be best to conceptualize the role of the ERN as a bio-behavioral marker of cognitive processes that moderate the development of children with autism. The identification of such moderators, and a more complete understanding of their nature, may contribute to efforts to better describe the processes that contribute to phenotypic differences within the broad spectrum of pervasive developmental disorders. For example, the data in this study not only indicate that enhanced ERN activity may be related to differences in symptom presentation and social development in children with autism, but also indicate that the response monitoring processes reflected in the ERN may be related to differences in verbal intelligence among children with autism. This observation appears to be quite consistent with the theory that suggests that ERN reflects a dopaminergic system of ACC activity that contributes to learning and reinforcement responsivity (Holroyd & Coles, 2002). Thus, it may be useful in subsequent research to examine the degree to which ERN-related phenomenon may be associated with differences in cognitive outcomes (e.g., mental retardation) that are associated with autism.
Two studies provide an illustration of the potential value of the current data for treatment research. Bauminger (2002) described the use of cognitive behavioral intervention for HFA children. On the basis of the current results, it seems reasonable to suggest that children with better self-monitoring skills (and higher ERN) may be more amenable to this type of treatment and/or that changes in ERN related phenomenon may be a biological marker of responsiveness to cognitive behavioral interventions in HFA children. In another study Buchsbaum, Hollander, Haznedar, Tang, and Spiegel-Cohen (2001), observed that individuals with autism who displayed higher metabolic rates in the medial frontal cortex and especially the ACC prior to medication were more likely to respond favorably to fluoxitine. While characteristics of the ERN do not simply equate to differences in metabolic rate in the ACC, the observation of Buchsbaum et al. (2001), in combination with the current observation of an association between medication and ERN, at least raises the possibility that a deeper understanding of the role of ACC in autism may also contribute to a better understanding of variations in treatment effects and responsiveness among people with this disorder.
4.3. Limitations
Of course recognition of the medication effects revealed in this study points to one of the clear challenges in studying the neurobiology of autism. There is an obvious need to consider the effects of medication on both symptom presentation and neural functioning in brain-behavior studies of autism, especially in the study of HFA children. Approximately 46% the children in the HFA sample were medicated at the time of study and there was a good deal of variability in the type of medication children were prescribed. Therefore, it was not possible to analyze the associations between specific classes of medications and the ERN, symptoms and social behaviors in this study of 24 HFA children. Despite this variability, there were clear effects of medication on the ERN. Indeed, once medication status was controlled the relations between ERN amplitude and internalizing problems and social stress were reduced to non-significance. The nature of the association and the causal relations between the three variables (medication, ERN, and social-emotional behaviors) was not possible to disentangle in this study. Nevertheless, the finding in this study, as well as Buchsbaum et al. (2001) highlight the importance of systematically evaluating the inter-relations between different classes of drugs, social behaviors, and ACC functioning in future studies.
Another limitation or methodological issue to consider in this study was the large proportion of participants in both the HFA and control samples that were eliminated from the analyses due to insufficient numbers of error trials from which to compute a reliable grand average ERN waveform. The participants included in the final sample were representative of the total sample insofar as they did not differ from the others in terms of age, verbal or performance IQ, or symptom severity. However, larger sample sizes would clearly be beneficial for documenting group differences in the ERN, as well as for better understanding the nature of the associations between ERN amplitude and individual differences in symptom presentation, social/emotional functioning and medications among children with HFA. In future research on the ERN in autism it will be important to develop tasks that are more flexible in terms of difficulty level so that task parameters including stimulus presentation rate and response time limits can be titrated to an individual’s performance. The results of this study suggest that such improvements in the applications of ERN paradigms to the study of autism are both possible and warranted.
Finally, the low level of spatial resolution permitted in an EEG study such as this prevents us from being able to make definitive statements about the neural sources of individual differences in the ERN, the extensive literature on the likely ACC source localization of ERN notwithstanding (see Holroyd & Coles, 2002 for review). However, there are clear advantages to using EEG/ERP paradigms such to study the neurobiology of childhood psychopathologies, such as, autism. EEG collection is non-invasive and allows for much greater temporal resolution compared to other methods. Moreover, its cost benefit ratio is low compared to some imaging technologies enhancing the capacity of ability to research to examine phenomenon in relatively large samples of children. Larger sample studies permit a more powerful examination of hypotheses regarding the nature of individual differences in autism and provide the statistical power to adequately control for the numerous extraneous variables present in such research. As the results of this study hopefully illustrate, understanding individual differences in neural functioning and symptom presentation among children with autism may significantly inform critical issues concerning the nature, diagnosis, and treatment of this disorder.
Footnotes
This paper reports a study that is part of a program of research supported by MH-071237 (P. Mundy, P.I.) and the University of Miami Center for Autism and Related Disabilities.
References
- Barnea-Goraly N, Kwon H, Menon V, Eliez S, Lotspeich L, Reiss A. White matter structure in autism: Preliminary evidence form diffusion tensor imaging. Biological Psychiatry. 2004;55:323–326. doi: 10.1016/j.biopsych.2003.10.022. [DOI] [PubMed] [Google Scholar]
- Bauminger N. The facilitation of social-emotional understanding and social interaction in high-functioning children with autism: Intervention outcomes. Journal of Autism and Developmental Disorders. 2002;32:283–298. doi: 10.1023/a:1016378718278. [DOI] [PubMed] [Google Scholar]
- Beauchaine T. Taxometrics and developmental psychopathology. Development and Psychopathology. 2003;15:501–528. doi: 10.1017/s0954579403000270. [DOI] [PubMed] [Google Scholar]
- Beglinger L, Smith T. A review of subtyping in autism and proposed dimensional classification model. Journal of Autism and Developmental Disorders. 2001;31:411–422. doi: 10.1023/a:1010616719877. [DOI] [PubMed] [Google Scholar]
- Bernstein P, Scheffers MK, Coles MGH. Where did I go wrong. A psychophysiological analysis of error detection. Journal of Experimental Psychology Human Perception and Performance. 1995;6:1312–1322. doi: 10.1037//0096-1523.21.6.1312. [DOI] [PubMed] [Google Scholar]
- Berument SK, Rutter M, Lord C, Pickles A, Bailey A. Autism screening questionnaire: Diagnostic validity. British Journal of Psychiatry. 1999;175:444–451. doi: 10.1192/bjp.175.5.444. [DOI] [PubMed] [Google Scholar]
- Bolton PF, Pickles A, Murphy M, Rutter M. Autism, affective and other psychiatric disorders: patterns of familial aggregation. Psychological Medicine. 1998;28:385–395. doi: 10.1017/s0033291797006004. [DOI] [PubMed] [Google Scholar]
- Braver TS, Barch DM, Gray JR, Molfese DL, Snyder A. Anterior cingulate cortex and response conflict: Effects of frequency, inhibition, and errors. Cerebral Cortex. 2001;11:825–836. doi: 10.1093/cercor/11.9.825. [DOI] [PubMed] [Google Scholar]
- Buchsbaum M, Hollander E, Haznedar M, Tang C, Spiegel-Cohen J, et al. Effect of fluoxetine on regional cerebral metabolism in autism spectrum disorders: A pilot study. International Journal of Neuropsychopharmacology. 2001;4:119–125. doi: 10.1017/S1461145701002280. [DOI] [PubMed] [Google Scholar]
- Bush G, Luu P, Posner M. Cognitive and emotional influences in the anterior cingulate cortex. Trends in Cognitive Science. 2000;4:214–222. doi: 10.1016/s1364-6613(00)01483-2. [DOI] [PubMed] [Google Scholar]
- Carver CS, Scheier MF. On the self-regulation of behavior. New York: Cambridge University Press; 1998. [Google Scholar]
- Coles MGH, Scheffers MK, Holroyd CB. Why is there an ERN/Ne on correct trials. Response representations, stimulus-related components, and the theory of error-processing. Biological Psychology. 2001;56:173–189. doi: 10.1016/s0301-0511(01)00076-x. [DOI] [PubMed] [Google Scholar]
- Courchesne E, Pierce K. Brain overgrowth in autism during a critical time in Development: Implications for frontal pyramidal neuron and interneuron development and plasticity. International Journal of Developmental Neuroscience. 2005;23:153–170. doi: 10.1016/j.ijdevneu.2005.01.003. [DOI] [PubMed] [Google Scholar]
- Davies PL, Segalowitz SJ, Gavin WJ. Development of response-monitoring ERPs in 7- to 25-year-olds. Developmental Neuropsychology. 2004;25:355–376. doi: 10.1207/s15326942dn2503_6. [DOI] [PubMed] [Google Scholar]
- Dawson G, McKissick FC. Self-recognition in autistic children. Journal of Autism and Developmental Disorders. 1984;14:383–394. doi: 10.1007/BF02409829. [DOI] [PubMed] [Google Scholar]
- Dawson G, Meltzoff A, Osterling J, Rinaldi J, Brown E. Children with autism fail to orient to naturally-occurring social stimuli. Journal of Autism and Developmental Disorder. 1998;28:479–485. doi: 10.1023/a:1026043926488. [DOI] [PubMed] [Google Scholar]
- Dawson G, Webb S, Schellenberg G, Dager S, Friedman S, Ayland E, Richards T. Defining the broader phenotype of autism: Genetic, brain, and behavioral perspectives. Development and Psychopathology. 2002;14:581–612. doi: 10.1017/s0954579402003103. [DOI] [PubMed] [Google Scholar]
- Dehaene S, Posner MI, Tucker DM. Localization of a neural system for error detection and compensation. Psychological Science. 1994;5:303–305. [Google Scholar]
- Devinsky O, Luciano D. The contributions of cingulate cortex to human behavior. In: Gabriel IM, Vogt BA, editors. Neurobiology of cingulate cortex and limbic thalamus: A comprehensive handbook. Cambridge, MA: Birkhauser; 1993. pp. 527–556. [Google Scholar]
- Duff K, Schoenberg MR, Scott JG, Adams RL. The relationship between executive functioning and verbal and visual learning and memory. Archives of Clinical Neuropsychiatry. 2005;20:111–122. doi: 10.1016/j.acn.2004.03.003. [DOI] [PubMed] [Google Scholar]
- Ehlers S, Gillberg C. The epidemiology of Asperger syndrome. A total population study. Journal of Child Psychology and Psychiatry. 1993;34:1327–1350. doi: 10.1111/j.1469-7610.1993.tb02094.x. [DOI] [PubMed] [Google Scholar]
- Ehlers S, Gillberg C, Wing L. A screening questionnaire for Asperger syndrome and other high-functioning autism spectrum disorders in school age children. Journal of Autism and Developmental Disorders. 1999;29:129–140. doi: 10.1023/a:1023040610384. [DOI] [PubMed] [Google Scholar]
- Engstrom I, Ekstrom L, Emilsson B. Psychosocial functioning in a group of Swedish adults with Asperger syndrome or high-functioning autism. Autism. 2002;7:99–110. doi: 10.1177/1362361303007001008. [DOI] [PubMed] [Google Scholar]
- Falkstein M, Hoorman J, Christ S, Hohnsbein J. ERP components on reaction errors and their functional significance: A tutorial. Biological Psychology. 2000;52:87–107. doi: 10.1016/s0301-0511(99)00031-9. [DOI] [PubMed] [Google Scholar]
- Falgatter AJ, Herrmann MJ, Roemmler J, Ehlis AC, Wagener A, Heidrich A, et al. Allelic variation of serotonin transporter function modulates the brain electrical response for error processing. Neuropsychopharmachology. 2004;29:1506–1511. doi: 10.1038/sj.npp.1300409. [DOI] [PubMed] [Google Scholar]
- Fombonne E. The prevalence of autism. Journal of the American Medical Association. 2003;289:87–89. doi: 10.1001/jama.289.1.87. [DOI] [PubMed] [Google Scholar]
- Frith C, Frith U. Interacting minds: A biological basis. Science. 1999;286:1692–1695. doi: 10.1126/science.286.5445.1692. [DOI] [PubMed] [Google Scholar]
- Frith U, Frith C. The biological basis of social interaction. Current Directions in Psychologic Science. 2001;10:151–155. [Google Scholar]
- Gehring WJ, Goss B, Coles MGH, Meyer DE, Donchin E. A neural system for error detection and compensation. Psychological Science. 1993;4:385–390. [Google Scholar]
- Gehring WJ, Himle J, Nisenson L. Action-monitoring dysfunction in obsessive compulsive disorder. American Psychological Society. 2000;11:1–6. doi: 10.1111/1467-9280.00206. [DOI] [PubMed] [Google Scholar]
- Gillberg C. Asperger syndrome and high functioning autism. British Journal of Psychiatry. 1998;172:200–209. doi: 10.1192/bjp.172.3.200. [DOI] [PubMed] [Google Scholar]
- Gillberg C, Billstedt E. Autism and Asperger syndrome: Coexistence with other clinical disorders. Acta-Psychiatrica-Scandinavica. 2000;102:321–330. doi: 10.1034/j.1600-0447.2000.102005321.x. [DOI] [PubMed] [Google Scholar]
- Gillott A, Furniss F, Walter A. Anxiety in high-functioning children with autism. Autism. 2001;5:277–286. doi: 10.1177/1362361301005003005. [DOI] [PubMed] [Google Scholar]
- Hajcak G, McDonald N, Simons RF. Error-related psychophysiology and negative affect. Brain and Cognition. 2004;56:189–197. doi: 10.1016/j.bandc.2003.11.001. [DOI] [PubMed] [Google Scholar]
- Hajcak G, Simons RF. Error-related brain activity in obsessive-compulsive undergraduates. Psychiatry Research. 2002;110:63–72. doi: 10.1016/s0165-1781(02)00034-3. [DOI] [PubMed] [Google Scholar]
- Hall G, Szectchman H, Hahmias C. Enhanced salience and emotion recognition in Autism: A PET study. American Journal of Psychiatry. 2003;160:1439–1441. doi: 10.1176/appi.ajp.160.8.1439. [DOI] [PubMed] [Google Scholar]
- Haznedar M, Buchsbaum M, Wei T, Hof P, Cartwright C, Bienstock C, et al. Limbic circuitry in patients with autism spectrum disorders studied with positron emission tomography and magnetic resonance imaging. American Journal of Psychiatry. 2000;157:1994–2001. doi: 10.1176/appi.ajp.157.12.1994. [DOI] [PubMed] [Google Scholar]
- Henderson HA. Temperamental contributions to problem solving: Affective and cognitive processes. In: Hastings P, editor. New approaches to understanding the psychophysiology of emotional development; Symposium conducted at the Biennial meetings of the Society for Research in Child Development; Tampa, FL. 2003. [Google Scholar]
- Hill EL. Evaluating the theory of executive dysfunction in autism. Developmental Review. 2004;24:189–233. [Google Scholar]
- Hill EL, Russell J. Action memory and self-monitoring in children with autism: Self versus other. Infant and Child Development. 2002;11:159–170. [Google Scholar]
- Holroyd C, Coles M. The neural basis of human error processing: Reinforcement learning, dopamine, and the error related negativity. Psychological Review. 2002;109:679–709. doi: 10.1037/0033-295X.109.4.679. [DOI] [PubMed] [Google Scholar]
- Holroyd C, Nieuwenhuis S, Yeung N, Nystrom L, Mars R, et al. Dorsal anterior cingulate cortex shows fMRI response to internal and external error signals. Nature Neuroscience. 2004;5:497–498. doi: 10.1038/nn1238. [DOI] [PubMed] [Google Scholar]
- Honda H, Shimizu Y, Misumi K, Niimi M, Ahashi Y. Cumulative incidence and prevalence of childhood autism in Japan. British Journal of Psychiatry. 1996;169:228–235. doi: 10.1192/bjp.169.2.228. [DOI] [PubMed] [Google Scholar]
- Johannes S, Wieringa BM, Nager W, Rada D, Dengler R, Emrich HM, et al. Discrepant target detection and action monitoring in obsessive-compulsive disorder. Psychiatry Research Neuroimaging. 2001;108:101–110. doi: 10.1016/s0925-4927(01)00117-2. [DOI] [PubMed] [Google Scholar]
- Just M, Cherkassky V, Keller T, Minshew N. Cortical activation and synchronization during sentence comprehension in high functioning autism: Evidence of underconnectivity. Brain. 2004;127:1811–1821. doi: 10.1093/brain/awh199. [DOI] [PubMed] [Google Scholar]
- Kiehl KA, Liddle PF, Hopfinger JB. Error processing and the rostral anterior cingulate: An event-related fMRI study. Psychophysiology. 2000;37:216–223. [PubMed] [Google Scholar]
- Kielinen M, Linna S, Moilanen I. Autism in Northern Finland. European Child and Adolescent Psychiatry. 2000;9:162–167. doi: 10.1007/s007870070039. [DOI] [PubMed] [Google Scholar]
- Kim J, Szatmari P, Bryson S, Streiner D, Wilson F. The prevalence of anxiety and mood problems among children with autism and Asperger syndrome. Autism. 2000;4:117–132. [Google Scholar]
- Klin A, Volkmar F. Asperger’s syndrome. In: Cohen D, Volkmar F, editors. Handbook of Autism and Pervasive Developmental Disorders. New York, NY: Wiley and Sons; 1997. pp. 93–122. [Google Scholar]
- Klin A, Warren J, Schultz R, Volkmar F. The enactive mind, or from actions to cognition: Lessons from autism. Philosophical Transaction of the Royal Society of London. 2003;10:1–16. doi: 10.1098/rstb.2002.1202. [DOI] [PMC free article] [PubMed] [Google Scholar]
- Kopp CB. Antecedents of self-regulation: A developmental perspective. Developmental Psychology. 1982;18:199–214. [Google Scholar]
- La Greca AM, Lopez N. Social anxiety among adolescents: Linkages with peer relations and friendships. Journal of Abnormal Child Psychology. 1998;26:83–94. doi: 10.1023/a:1022684520514. [DOI] [PubMed] [Google Scholar]
- La Greca AM, Stone WL. Social anxiety scales for children-revised: Factor structure and concurrent validity. Journal of Clinical Child Psychology. 1993;22:17–27. [Google Scholar]
- Levitt J, O’Neill J, Blanton R, Smalley S, Fadale D, McCraken J, et al. Proton magnetic resonance spectroscopic imaging of the brain in childhood autism. Biological Psychiatry. 2003;54:1355–1366. doi: 10.1016/s0006-3223(03)00688-7. [DOI] [PubMed] [Google Scholar]
- Luu P, Collins P, Tucker D. Mood, personality, and self-monitoring: Negative affect and emotionality in relation to frontal lobe mechanisms of error monitoring. Journal of Experimental Psychology: General. 2000;129:43–60. doi: 10.1037//0096-3445.129.1.43. [DOI] [PubMed] [Google Scholar]
- Luu P, Flaisch T, Tucker D. Medial-frontal cortex in action monitoring. Journal of Neuroscience. 2000;20:464–469. doi: 10.1523/JNEUROSCI.20-01-00464.2000. [DOI] [PMC free article] [PubMed] [Google Scholar]
- Mathalon DH, Fedor M, Faustman WO, Gray M, Askari N, Ford JM. Response-monitoring dysfunction in schizophrenia: An event-related brain potential study. Journal of Abnormal Psychology. 2002;111:22–41. [PubMed] [Google Scholar]
- Mathalon DH, Whitfield SL, Ford JM. Anatomy of an error: ERP and fMRI. Biological Psychology. 2003;64:119–141. doi: 10.1016/s0301-0511(03)00105-4. [DOI] [PubMed] [Google Scholar]
- McPartland J, Dawson G, Webb SJ, Panagiotides H, Carver LJ. Event-related brain potentials reveal anomalies in temporal processing of faces in autism spectrum disorder. Journal of Child Psychology and Psychiatry. 2004;45:1235–1245. doi: 10.1111/j.1469-7610.2004.00318.x. [DOI] [PubMed] [Google Scholar]
- Menon V, Adleman NE, White CD, Glover GH, Reiss AL. Error-related brain activation during a Go/NoGo response inhibition task. Human Brain Mapping. 2001;12:131–143. doi: 10.1002/1097-0193(200103)12:3<131::AID-HBM1010>3.0.CO;2-C. [DOI] [PMC free article] [PubMed] [Google Scholar]
- Meyer JA, Mundy PC, Vaughan AE, Durocher JS. Social information-processing and comorbid psychiatric symptoms in children with Asperger’s disorder, Autism. doi: 10.1177/1362361306064435. in press. [DOI] [PMC free article] [PubMed] [Google Scholar]
- Miltner WHR, Lemke U, Weiss T, Holroyd C, Scheffers MK, Coles MGH. Implementation of error-processing in the human anterior cingulate cortex: A source analysis of the magnetic equivalent of the error-related negativity. Biological Psychology. 2003;64:157–166. doi: 10.1016/s0301-0511(03)00107-8. [DOI] [PubMed] [Google Scholar]
- Mundy P. Joint attention and social-emotional approach behavior in children with autism. Development and Psychopathology. 1995;7:63–82. [Google Scholar]
- Mundy P. The neural basis of social impairments in autism: The role of the dorsal medial-frontal cortex and anterior cingulate system. Journal of Child Psychology and Psychiatry. 2003;44:793–809. doi: 10.1111/1469-7610.00165. [DOI] [PubMed] [Google Scholar]
- Mundy P, Neal R. Neural plasticity, joint attention and a transactional social-orienting model of autism. International Review of Mental Retardation. 2001;23:139–168. [Google Scholar]
- Nigg JT. On inhibition/disinhibition in developmental psychopathology: Views from cognitive and personality psychology and a working inhibition taxonomy. Psychological Bulletin. 2000;126:220–246. doi: 10.1037/0033-2909.126.2.220. [DOI] [PubMed] [Google Scholar]
- Ohnishi T, Matsuda H, Hashimoto T, Kunihiro T, Nishikawa M, Uema T, Sasaki M. Abnormal regional cerebral blood flow in childhood autism. Brain. 2000;123:1838–1844. doi: 10.1093/brain/123.9.1838. [DOI] [PubMed] [Google Scholar]
- Ozonoff S, Jensen J. Specific executive function profiles in three neurodevelopmental disorders. Journal of Autism and Developmental Disorders. 1999;29:171–177. doi: 10.1023/a:1023052913110. [DOI] [PubMed] [Google Scholar]
- Pennington BF, Ozonoff S. Executive functions and developmental psychopathology. Journal of Child Psychology and Psychiatry. 1996;37:51–87. doi: 10.1111/j.1469-7610.1996.tb01380.x. [DOI] [PubMed] [Google Scholar]
- Phillips W, Baron-Cohen S, Rutter M. Understanding intention in normal development and in autism. British Journal of Developmental Psychology. 1998;16:337–348. [Google Scholar]
- Piven J. Genetics of personality: The example of the broad autism phenotype. In: Benjamin J, Ebstein R, editors. Molecular genetics and the human personality. Washington, DC: American Psychiatric Publishing; 2002. pp. 43–62. [Google Scholar]
- Posner MI, Petersen SE. The attention system of the human brain. Annual Review of Neuroscience. 1990;13:25–42. doi: 10.1146/annurev.ne.13.030190.000325. [DOI] [PubMed] [Google Scholar]
- Rabbitt PM. Age, IQ and awareness, and recall of errors. Ergonomics. 1990;33:1291–1305. doi: 10.1080/00140139008925333. [DOI] [PubMed] [Google Scholar]
- Reynolds CR, Kamphaus RW. Behavior Assessment System for Children. American Guidance Service; 1998. [Google Scholar]
- Rinehart N, Bradshaw J, Brereton A, Tonge B. Movement preparation in high functioning autism and Asperger disorder: A serial choice reaction time task involving motor responding. Journal of Autism and Developmental Disorders. 2001;31:79–88. doi: 10.1023/a:1005617831035. [DOI] [PubMed] [Google Scholar]
- Rothbart MK, Bates JE. Temperament. In: Eisenberg N, Damon W, editors. Handbook of child psychology: Vol. 3: Social, emotional, and personality development. 5. New York: Wiley; 1998. pp. 105–176. [Google Scholar]
- Russell J. How executive disorders can bring about an inadequate theory of mind. In: Russell J, editor. Autism as an executive disorder. Oxford, UK: Oxford University Press; 1997. pp. 256–304. [Google Scholar]
- Russell J, Hill EL. Action-monitoring and intention reporting in children with autism. Journal of Child Psychology and Psychiatry. 2001;42:317–328. [PubMed] [Google Scholar]
- Russell J, Jarrold C. Error correction problems in autism: Evidence for a monitoring impairment? Journal of Autism and Developmental Disorders. 1998;28:177–188. doi: 10.1023/a:1026009203333. [DOI] [PubMed] [Google Scholar]
- Rutter M. Autism research: prospects and priorities. Journal of Autism and Developmental Disorders. 1996;26:257–275. doi: 10.1007/BF02172023. [DOI] [PubMed] [Google Scholar]
- Rutter M, Bailey A, Lord C. Manual for the social communication questionnaire. Los Angeles, CA: Western Psychological Services; 2003. [Google Scholar]
- Shallice T, Burgess P. Higher cognitive impairments and frontal lobe lesions in man. In: Levin H, Eisenberg H, Benton A, editors. Frontal lobe function and dysfunction. Oxford: Oxford University Press; 1991. pp. 125–138. [Google Scholar]
- Shoumitro D, Thompson B. Neuroimaging in autism. British Journal of Psychiatry. 1998;173:299–302. doi: 10.1192/bjp.173.4.299. [DOI] [PubMed] [Google Scholar]
- Stuss DT, Shallice T, Alexander MP, Picton TW. A multi-disciplinary approach to anterior attentional functions. Annals of the New York Academy of Sciences. 1995;769:191–211. doi: 10.1111/j.1749-6632.1995.tb38140.x. [DOI] [PubMed] [Google Scholar]
- Sutton S, Burnette C, Mundy P, Meyer J, Vaughan A, Sanders C, et al. Resting cortical brain activity and social behavior in higher functioning children with autism. Journal of Child Psychology & Psychiatry. 2005;46 doi: 10.1111/j.1469-7610.2004.00341.x. [DOI] [PubMed] [Google Scholar]
- Tonge B, Bremerton A, Gray K, Einfeld S. Behavioral and emotional disturbance in high functioning autism and Asperger syndrome. Autism. 1999;3:117–130. [Google Scholar]
- Townsend J, Westerfield M, Leaver E, Makeig S, Jung T-P, Pierce K, et al. Event-related brain response abnormalities in autism: Evidence for impaired cerebello-frontal spatial attention networks. Cognitive Brain Research. 2001;11:127–145. doi: 10.1016/s0926-6410(00)00072-0. [DOI] [PubMed] [Google Scholar]
- van Veen V, Carter C. The anterior cingulate as a conflict monitor: fMRI and ERP studies. Physiology and Behavior. 2002;77:477–482. doi: 10.1016/s0031-9384(02)00930-7. [DOI] [PubMed] [Google Scholar]
- Volkmar F, Cicchetti D, Cohen D, Bregman J. Brief report: Developmental aspects of DSM-III-R criteria for autism. Journal of Autism and Developmental Disorders. 1992;22:657–662. doi: 10.1007/BF01046334. [DOI] [PubMed] [Google Scholar]
- Volkmar FR, Lord C, Bailey A, Schultz R, Klin A. Autism and pervasive developmental disorders. Journal of Child Psychology and Psychiatry. 2004;45:135–170. doi: 10.1046/j.0021-9630.2003.00317.x. [DOI] [PubMed] [Google Scholar]
- Wechsler D. Wechsler intelligence scale for children. fourth. San Antonio, TX: The Psychological Corporation; 2003. [Google Scholar]