

Abstract
Ferritin is a widespread iron mineralizing and detoxification protein that stores iron as a hydrous ferric oxide mineral core within a shell-like structure of 4/3/2 octahedral symmetry. Iron mineralization is initiated at dinuclear ferroxidase centers inside the protein where Fe2+ and O2 meet and react to form a μ-1,2-peroxodiferric intermediate that subsequently decays to form μ-oxo dimeric and oligomeric iron(III) species and ultimately the mineral core. Several types of channels penetrate the protein shell and are possible pathways for the diffusion of iron and dioxygen to the ferroxidase centers. In the present study, UV/visible and fluorescence stopped-flow spectrophotometries were used to determine the kinetics and pathways of Fe2+ diffusion into the protein shell, its binding at the ferroxidase center and its subsequent oxidation by O2. Three fluorescence variants of human H-chain ferritin were prepared in which Trp34 was introduced near the ferroxidase center. They included a control variant #1 (W93F/Y34W), a “1-fold” channel variant #2 (W93F/Y34W/Y29Q) and a 3-fold channel variant #3 (Y34W/W93F/D131I/E134F). Anaerobic rapid mixing of Fe2+ with apo-variant #1 quenched the fluorescence of Trp34 with a rate exhibiting saturation kinetics with respect to Fe2+ concentration, consistent with a process involving facilitated diffusion. A half-life of ~ 3 ms for this process is attributed to the time for diffusion of Fe2+ across the protein shell to the ferroxidase center. No fluorescence quenching was observed with the 3-fold channel variant #3 or when Zn2+ was prebound in each of the eight 3-fold channels of variant #1, observations indicating that the hydrophilic channels are the only avenues for rapid Fe2+ access to the ferroxidase center. Substitution of Tyr29 with glutamine at the entrance of the “1-fold” hydrophobic channel had no effect on the rate of Fe2+ oxidation to form the μ-1,2-peroxodiferric complex (t1/2 ~ 38 ms), a finding demonstrating that Tyr29 and, by inference, the “1-fold” channels do not facilitate O2 transport to the ferroxidase center, contrary to predictions of DFT and molecular dynamics calculations. O2 diffusion into ferritin occurs on a time scale that is fast relative to the millisecond kinetics of the stopped-flow experiment.
Keywords: Fe2+ diffusion, stopped-flow kinetics, peroxo intermediate, fluorescence quenching, tryptophan fluorescence
INTRODUCTION
Ferritins are members of the superfamily of iron storage and detoxification proteins found throughout the animal, plant and microbial kingdoms and play key roles in the biological management of iron.1-4 These proteins sequester excess cellular iron and, in so doing, minimize “free iron” which contributes to the generation of reactive oxygen species (ROS)5-7 In the process of acquiring and storing iron, ferritins catalyze the simultaneous oxidation of two Fe2+ by a single dioxygen or hydrogen peroxide molecule by a mechanism that avoids the odd electron oxidation of iron(II) and the associated production of superoxide and hydroxyl radicals harmful to the cell.6,7 Thus, the ferritins are not only able to efficiently harvest and store iron for later use by the cell, they also help to protect the cell against oxidative stress.5
All ferritins have shell-like structures (Fig. 1) within which large amounts of iron (≤ 4500 Fe) are encapsulated as a hydrous ferric oxide mineral core with a structure resembling that of ferrihydrite and displaying superparamagnetic properties.2,3 The protein shells of mammalian ferritins are penetrated by channels and have 4/3/2 octahedral symmetry with inner and outer diameters of ~ 80 and 120 Å, respectively, and a shell thickness of ~20 Å (Fig.1). Because of its unique structural properties, the protein cavity has found application in nanotechnology as a natural template for the nucleation and synthesis of a variety of metallic nanoparticles whose growth is constrained by interior size of the protein shell.8
Figure 1.


Ferritin protein shell with views down the (A) 4-fold, (B) 3-fold and (C) 2-fold “and (D) 1-fold” axes (channels) of the protein shell. The full protein shell is shown on the left with the rotation symmetry related subunits indicated in blue. An expanded view of each type of channel is shown on the right with key residues indicated. The “1-fold” rotation axis is a C1 axis (rotation through 360°). There are an infinite number of such axes in the protein but the one shown lies along a narrow channel leading to Fe (yellow) in the A site of the ferroxidase center (See Fig. 2) and thus has special significance.9, 36, 37 Tyr29 extends into the exterior solution.
Mammalian ferritins consist of 24 H- and/or L-type subunits of similar sequence and size. The pairwise oxidation of Fe2+ occurs at ferroxidase centers located within the 4-helix bundle of the H-type subunits regardless of the source of 24mer ferritin (Fig. 2).2 The ferroxidase center is located some 7-8 Å from the inside surface of the protein shell and 12 – 13 Å from the exterior surface in a region of considerable hydrophobic character (Fig. 2).9 L-subunits lack ferroxidase centers and thus do not exhibit fast Fe2+ oxidation kinetics but facilitate nucleation of the mineral core.2,3 The dinuclear ferroxidase centers of human H-chain homopolymer ferritin (HuHF) are composed of A and B iron binding sites of conserved amino acid ligands His65, Glu27, Glu107 and Glu62 (Fig. 2).9,10 H-bonding residues Gln141 and Tyr34 are nearby. These ferroxidase centers differ functionally from those of the dinuclear cofactor sites of non-heme iron enzymes such as methane mono-oxygenase and ribonucleotide reductase. The cofactors sites of dinuclear enzymes retain and redox cycle their iron, while turning over the organic substrate to product,11 whereas the ferroxidase center of ferritin continually turns over its iron during the catalytic cycle, releasing it to the core for storage.2-4,
Figure 2.
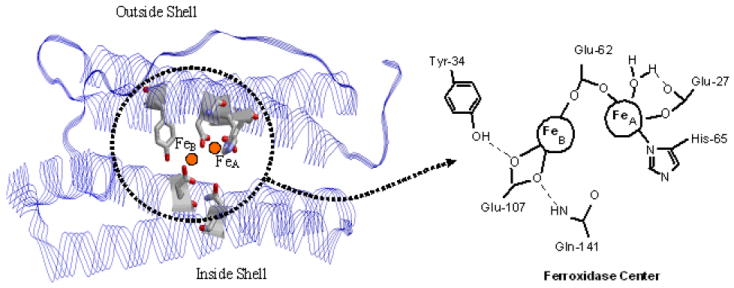
The ferroxidase center of human H-chain ferritin located within the four-helix bundle (left). Schematic view of the ferroxidase center (right). The ligands are those observed in the x-ray structure of Zn2+ bound at the ferroxidase site.9
The mechanism by which iron is sequestered within ferritin involves the diffusion of both Fe2+ and O2 (or H2O2) into the interior of the protein, the binding and oxidation of Fe2+ at the ferroxidase centers to form a diferric peroxo intermediate, the release of hydrogen peroxide, and the hydrolysis and migration of the resultant Fe3+ to form the mineral core within the protein shell.12-16 There are several potential pathways for Fe2+ entry into the protein cavity, including the eight 3-fold (Fig. 1B),17-21 the twelve 2-fold (Fig. 1C)22 and the twenty four “1-fold” channels (Fig 1D),9 all of which connect the interior of the protein to the outside solution. The weight of evidence, however, favors the 3-fold hydrophilic channels. For example, divalent cations have been shown by x-ray crystallography to bind within the 3-fold channel at three Asp131 and three Glu134 residues contributed by three separate subunits related by 3-fold symmetry (Fig. 1B) 10,23 as well as at His118 and Cys130 residues at the outer opening of the channels.10 Substitution of any of these residues decreases both the rate of iron uptake17,18 and the amount of Fe2+ binding at the ferroxidase centers24 and results in attenuation of core mineralization. Isothermal titration calorimetry (ITC) and kinetic measurements have shown that the mechanism of Tb3+ and Zn2+ inhibition of Fe2+ binding and oxidation in HuHF occurs from the binding of these metal ions in the 3-fold channels, reducing access of the Fe2+ to the ferroxidase centers.20 The ligand exchange inert Cr(TREN)(H2O)(OH)2+ complex also blocks access of Fe2+ to the cavity of ferritin, presumably by binding in the channels.21,25 In addition, localized unfolding around the 3-fold channels from the use of chaotropic agents or site-directed mutagenesis enhances the transit of iron into and out of the protein cavity.26-28
The stoichiometry and association constant of Fe2+ binding to the ferroxidase centers of HuHF have been determined by ITC under equilibrium conditions,24 but limited information is available on the dynamics of Fe2+ transfer across the protein shell to these centers. The overall process must occur in less than ~ 50 ms based on sequential stopped-flow spectroscopy29 employing 1,10-phenanthroline to measure unbound Fe2+ and on the time required for the peroxodiferric intermediate to form.29-33 An attempt has been made to measure the time for Fe2+ diffusion into horse spleen ferritin by following the generation of Prussian Blue inside the protein cavity but a much slower rate was obtained than the aforementioned studies suggest.34
To date, the pathways and rates of O2 entry into ferritin have been little explored. Based on the early crystallography of the horse spleen protein, the six 4-fold hydrophobic channels lined with leucine residues were suggested as possible avenues for diffusion of dioxygen into the protein interior (Fig. 1A).35 However, the more recent x-ray structure of E. coli bacterial ferritin (EcFtnA) has identified 24 short hydrophobic channels along the “1-fold axis” of each subunit that penetrate directly through the subunit to the ferroxidase center and are potential pathways for O2 entry (Fig. 1D).36 Similar hydrophobic channels are found in the H-chain subunit of human ferritin and are composed of residues Leu26, Ala30, Leu106 and Val110.37 Tyr29, a conserved residue, is located at the entrance to the “1-fold” channel and extends into the external solution (Fig. 1D). Density functional theory (DFT) and molecular dynamics calculations have led to the hypothesis that Tyr29 interacts with O2 in the bulk solution thereby directing it into the “1-fold” channel where it diffuses to the ferroxidase center.37
Kinetic studies of the interaction of Fe2+ with HuHF are difficult to carry out because of the insensitivity of the UV-visible and fluorescence spectra of the WT protein to Fe2+ binding.14,38 The single tryptophan residue (Trp93) per H-subunit in HuHF is situated ~ 17 Å from the ferroxidase center, and this large distance probably accounts for the lack of an effect of Fe2+ binding on the intrinsic fluorescence and absorption properties of the protein.
The present study was undertaken to measure directly the rates of Fe2+ and O2 diffusion to the ferroxidase center of HuHF. Towards this end, three variants were prepared in which a fluorescent reporter group was introduced near the ferroxidase center through the substitution Y34W. The only tryptophan in the wild-type protein (Trp93) was simultaneously eliminated by the substitution W93F to avoid contributions from this residue to the observed fluorescence. Variant #1 (W93F/Y34W) served as a “WT” control. Variant #2 (W93F/Y34W/Y29Q) was used to test the importance of Tyr29 for O2 diffusion into the protein and variant #3 (W93F/Y34W/D131I/E134F) to test the importance of the 3-fold channels for rapid Fe2+ diffusion into the protein. Stopped-flow fluorescence and stopped-flow absorbance spectrophotometries were employed to measure the kinetics of Fe2+ and O2 arrival at the ferroxidase center and the subsequent oxidation of the iron.
Our experiments show that Fe2+ rapidly traverses the protein shell (t1/2 ~ 3 ms) via the 3-fold channels and not by another rapid pathway. Diffusion into ferritin shows saturation kinetics characteristic of facilitated diffusion and is consistent with a model in which Fe2+ binds initially in the 3-fold channels and then migrates to the protein interior and ultimately to the ferroxidase center. When Fe2+ is prebound anaerobically to the ferroxidase center, the rate of Fe2+ oxidation upon rapid mixing of the Fe2+-protein complex with an aerobic solution is unaffected by the substitution Y29Q, a result indicating that Tyr29 is unimportant mechanistically for oxygen transport. The data further indicate that O2 must reach the ferroxidase center with or without Tyr29 present in a time much shorter than the observed half-life of 38 ms for Fe2+ oxidation when Fe2+ is prebound to the ferroxidase centers prior to the introduction of O2.
MATERIALS AND METHODS
Reagent grade ferrous sulfate was obtained from Baker Scientific Inc (Phillipsburg, NJ) and Mops hemisodium buffer from Research Organics (Cleveland, OH). The constructs for variant #1 (W93F/Y34W), variant #2 (W93F/Y34W/Y29Q), and variant #3 (W93F/Y34W/D131I/134F) were prepared by oligonucleotide site-directed mutagenesis on the plasmid pET-HuHF encoding human H-ferritin39 by using QuikChange kit (Stratagene). The plasmids were verified by direct DNA sequencing. The proteins were expressed in transformed E. coli and purified as previously described.39 The concentrations of all three variants on a 24mer basis were determined by Advanced Protein Assay (http://cytoskeleton.com) using BSA as a standard. Molar absorptivities at 280 nm for variants #1 and #2 were estimated to be 17,000 and 14,000 M-1cm-1 per subunit, respectively, which compare with predicted values of 17,400 and 15,900 M-1cm-1 based on their amino acid sequences (using the ProtParam tool at http://ca.expasy.org) and with the value of of 23,000 M-1cm-1 per subunit for the WT protein.40 Circular dichroism (CD) spectra and melting curves for variant #1 and the WT protein were very similar (Figs. S1 and S2), indicating that the mutation caused no major structural change in the protein. All of the variants eluted as 24mers on size exclusion chromatography. The protein was rendered iron free by continuous flow anaerobic dialysis in the presence of sodium dithionite and 2,2′-bipyridyl.41,42
CD spectra were measured on a Jasco J815 instrument. Isothermal titration calorimetry measurements were made with a CSC Model 4200 calorimeter as previously described.24 Equilibrium fluorescence measurements were performed on a Varian Cary Eclipse fluorimeter or on a SLM Aminco-Bowman Series 2 luminescence spectrometer (AB2). Titrations of 1.0 μM variant #1 in 100 mM Mops pH 7.15 at 25 °C with 0 - 48 μM FeSO4 were carried out under an argon atmosphere in a 1-cm gas-tight fluorescent cell fitted with a septum. To test the ability of O2 to quench the fluorescence of Trp-34 of variant #1, a 100% O2 atmosphere was introduced over the stirred anaerobic apoprotein solution with the fluorescence monitored before and after introduction of O2. The kinetics of fluorescence quenching was performed with the pneumatic drive Hi-Tech SFA-20M stopped-flow accessory interfaced to the Cary Eclipse fluorimeter or to the SLM Aminco-Bowman Series 2 luminescence spectrometer which acquire a data point every 12.5 ms or 0.300 ms, respectively. The AB2 spectrometer was used for the fastest reactions encountered in this work. The dead times of the two instruments were determined to be 9.2 ± 0.2 ms and 3.7 ± 0.1 ms, respectively, using the N-acetyltryptophanamide (NATA) and N-bromo-succinamide (NBS) test reaction.43 The dead times take into account both the mixing time and software delay for the two instruments. The rate constant of the test reaction run on the SFA-20M/Eclipse apparatus at NATA and NBS concentrations of 5.00 and 50.0 μM, respectively, was determined to be 34.8 ± 0.7 s-1 (t1/2 = 19.9 ± 0.4 ms) from data measured over four half lives (Fig. S3) which compares favorably with the literature value of 37.4 s-1 (t1/2 = 18.5 ms) under identical conditions.43 The test reaction run on the SFA-20M/Aminco-Bowman apparatus at NATA and NBS concentrations of 5.00 and 200 μM, respectively, gave a rate constant of 152 ± 2 s-1 (t1/2 = 4.55 ms) (Fig. S4) which is close to the literature value of 155 s-1 (t1/2 = 4.47 ms) under the same conditions.43
The kinetics of Fe2+ binding to apo-variants #1, #2 and #3 were performed anaerobically. The stopped-flow apparatus was fitted with a polyvinylchloride bag specifically designed by the manufacturer for anaerobic work and flushed with high-purity argon overnight before use. All buffers and Fe2+ solutions were made oxygen-free by extensive bubbling with moist argon overnight prior to use. Moist argon was passed over the stirred apo-protein solution overnight to remove oxygen. Then equal volumes (140 μL) of a 12-72 μM FeSO4 solution, pH ~ 2, acidified with 3N HCl with or without 25 mM NaCl (as indicated by the presence or absence of NaCl in the figure legends) and apoprotein (1.0 – 3,0 μM) in Mops buffer (50 – 100 mM), pH 7.15, were rapidly mixed in the thermostatted sample compartment and pushed through the 80 μL quartz stopped-flow cuvette. Path lengths for excitation and emission were 1.0 cm and 0.2 cm at wavelengths of 280 nm and 324 nm, respectively. A slit width of 5 nm for excitation and 10 nm for emission was used with the Cary Eclipse and 5 nm for both excitation and emission slits for the AB2.
To ensure that the Fe2+ solutions remained reduced before mixing with the apo-protein, they were prepared anaerobically in pH ~ 2 water (acidified with 3N HCl) in the absence of buffer as done in all previous stopped-flow kinetics studies of ferritins.16,29,31,34 The low pH helps to stabilize the Fe2+ from slow oxidation due to traces of O2 in the solution (< 0.5 μM as measured by Clark electrode oximetry) during the time required to prepare the stopped-flow system for each kinetic run. However, this protocol causes a 2-fold drop in Mops buffer hemisodium concentration at the start of the reaction from 50 mM to 25 mM upon rapid mixing of the protein and iron solutions and a corresponding decrease in ionic strength from μ = 25 to 12.5 mM. Therefore, the influence of ionic strength on the fluorescence and absorption spectra of the apo-protein and its iron complex was investigated. No effect was found. The change in ionic strength on the kinetics of Fe2+ diffusion was also investigated. In these experiments, the pH ~ 2 Fe2+ solution was prepared with or without added 25 mM NaCl (μ = 25 mM) while the apo-protein solution contained only 50 mM Mops (μ = 25 mM), pH 7.15. The first-order rate constants for fluorescence decay were only ~ 10% larger when NaCl was present in the Fe2+ solution than when it was absent, indicating that the 2-fold drop in ionic strength upon mixing has a minimal effect on the observed kinetics.
In the experiments to measure oxidation of prebound Fe2+ by O2, a 140 μL volume of deionized water saturated with 100% O2 was rapidly mixed with the same volume of anaerobic 3.0 μM variants #1 and #2 containing 48 Fe2+/shell in 100 mM Mops buffer pH 7.15. As indicated in the figure captions, multiple traces were averaged to improve the signal-to-noise ratio of the data prior to analysis.
Stopped-flow, multiple-wavelength absorption studies were carried out with the Hi-Tech SFA-20M apparatus interfaced to a J&M Tidas diode array spectrometer with data acquisition every 2.5 ms in the wavelength range 290 to 800 nm. The peroxodiferric species formed during oxidation of Fe2+ was monitored by its absorbance value at 650 nm. The spectrophotometer baseline was determined prior to each kinetic run with a cuvette containing equal volumes of apo-protein in buffer and acidic H2O (pH ~ 2).
Analysis of the kinetics was carried out as recently described.31,33 The data were fitted to derived kinetic equations programmed into Origin, version 7.0, software (OriginLab, Inc.). Stated errors are at the 95% confidence level from the goodness of fit unless stated otherwise. The dead time was added to all measured times post triggering of data collection and a zero point at zero-time was added to all data sets.
RESULTS
Fluorescence quenching of variant #1 by Fe2+binding
The fluorescence spectra of variant #1 (W93F/Y34W) containing different amounts of Fe2+ are shown in Figure 3 (inset). The intensites of fluorescence and absorption spectra were found to be independent of the ionic strengths of 12.5 – 25 mM employed in this work (Materials and Methods). Maximal emission occurs at 324 nm for the apoprotein, indicating that most of the observed fluorescence is contributed by the sole tryptophan residue Trp34. Anaerobic addition of Fe2+ causes a blue shift in the band maximum to 317 nm, a result suggestive of movement of the Trp34 to a more hydrophobic environment upon binding of iron to the protein.44 To establish the binding stoichiometry, the apoprotein was titrated anaerobically with Fe2+ while monitoring the fluorescence. The addition of increments of Fe2+ to variant #1 up to ~ 12 Fe2+/shell resulted in marked quenching of the protein fluorescence, beyond which quenching was less pronounced (Fig. 3). The data were fitted to eq 1 (Supporting Information) for the binding of Fe2+ to nF independent ferroxidase sites on the protein.
Figure 3.
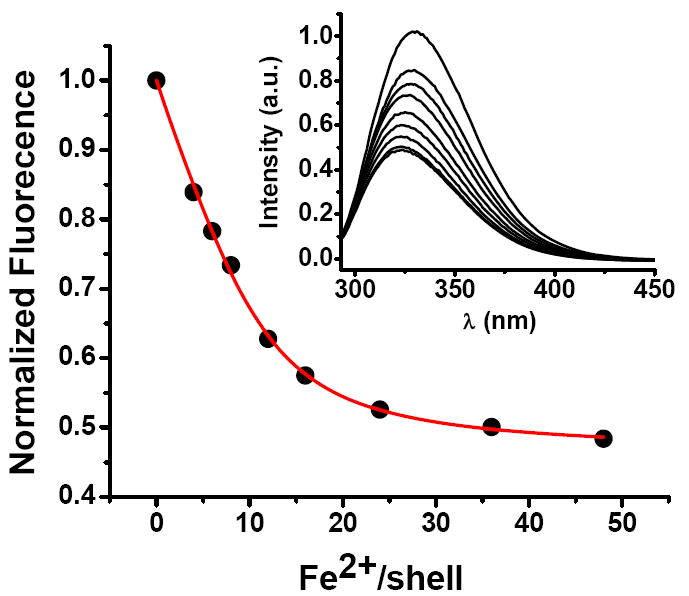
Fluorescence quenching upon Fe2+ binding anaerobically to variant #1. Inset: Family of spectra. The red line is the fit of eq 1 to these data with nF = 11.7 ± 0.7, KF = (1.1 ± 0.2) × 106 and I∞ = 0.460 ± 0.009 (95 % confidence level). The average and standard deviations obtained for four titrations are nF = 11.4 ± 2.1 and KF = (1.3 ± 0.8) × 106 M-1. Conditions: λEx. = 280 nm, λEm. = 324 nm, slits for excitation and emission of 4 and 8 nm, respectively, 1.0 μM apo-protein, 0 – 48 μM FeSO4, 50 mM Mops, pH 7.15, 25 °C.
| (1) |
Here KF is the site association constant, [P]o and [Fe]o are the 24-mer protein and iron concentrations, and Io and I∞ are the relative fluorescence intensities in the absence of Fe2+ and in the presence of Fe2+ when the sites are fully saturated, respectively. Average and standard deviation for four titrations were nF = 11.4 ± 2.1 and KF = (1.3 ± 0.8) × 106 M-1 (range: (0.7 – 2.6) × 106 M-1). The observed stoichiometry of nF ~ 12 from the fluorescence titrations was confirmed by an anaerobic UV spectrometric titration of the apo-protein with Fe2+ (Fig. S5). Isothermal titration calorimetry, which accounts for all binding that produces a measurable heat, was also carried out (Fig. 4). Two classes of binding sites were observed (n1 = 12.0 ± 0.7 and K1 = (3.9 ± 2.2) × 106 M-1; n2 = 6.8 ± 1.9 and K2 = (1.5 ± 0.5) × 105). The stoichiometry and equilibrium constant of the strong class of binding sites are the same within experimental uncertainty as those obtained from the fluorescence quenching titration (Fig. 3). The weaker binding sites (n2 = 6.8 ± 1.9) observed by ITC are attributed to the eight hydrophilic channels (vide infra).20,24 Thus, variant #1 binds about half as much Fe2+ at the ferroxidase centers as does the WT protein, which binds 24 Fe2+, one at each ferroxidase center under similar conditions.24 Fe2+ binding most likely occurs at the His65-containing A-site of the ferroxidase center of Figure 2 as previous studies suggest.10,24,29 (In constrast, both the A and B sites of the frog M protein are occupied by Fe2+.11b)
Figure 4.

Calorimetric titration of variant #1 (W93F/Y34W) with Fe2+ under anaerobic conditions. Plot of integrated heat versus Fe2+/variant #1 ratio. Inset: Raw data. The red line is the result of curve fitting to two independent classes of binding sites with n1 = 12.0 ± 0.7, K1 = (3.9 ± 2.2) × 106 M-1 and ΔH1° = -0.45 ± 0.17 kJ/mol, corresponding to ΔG1° = -37.6 ± 1.5 kJ/mol and ΔS1° = 125 ± 5 J K-1mol-1, and n2 = 6.8 ± 1.90, K2= (1.5 ± 0.5) × 105 M-1 and ΔH2° = 14.0 ± 7.3 kJ/mol, corresponding to ΔG2°= -29.5 ± 0.8 kJ/mol and ΔS2° = 146 ± 25 J/K-mol. Conditions: 3 μM protein in 0.1 M Mops and 2 mM Na2S2O4, pH 7.05. The Fe2+ solution was prepared in anaerobic 0.1 M Mops, 2 mM Na2S2O4, pH 7.05. Na2S2O4 helps to maintain an oxygen-free solution during the titration. Its presence does not affect Fe2+ binding to the protein.24
The pathway of Fe2+ entry into ferritin
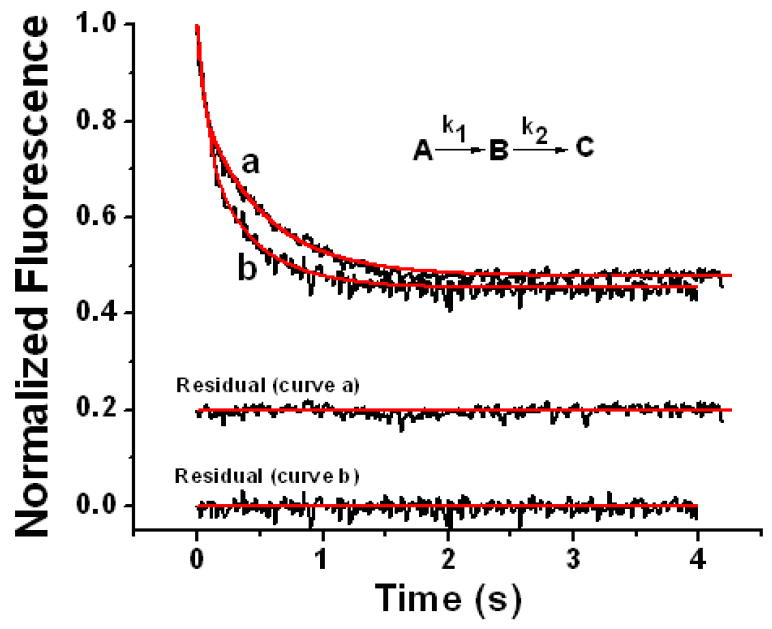
To probe the pathway for iron entry into ferritin, stopped-flow fluorescence quenching experiments were performed on the 3-fold channel variant #3 (Y34W/W93F/D131I/E134F) (Fig. 5). The intrinsic fluorescence of channel variant #3 was not quenched when the protein was rapidly mixed with an Fe2+ solution (48 Fe/shell) either anaerobically (curve a) or aerobically (not shown) as also found in a control experiment where variant #1 was rapidly mixed with just H2O (not shown). In contrast, the intrinsic fluorescence was greatly quenched when variant #1 was rapidly mixed anaerobically with 48 Fe2+ (curve d), suggesting that in the channel variant #3, Fe2+ is unable to reach the ferroxidase center within the time frame of the stopped-flow experiment. Because the four amino acid substitutions in variant #3 conceivably could render the ferroxidase center incapable of binding Fe2+, measurements were also undertaken with variant #1 having 8 Zn2+ bound per protein, one in each of the eight 3-fold channels.20 A marked reduction in quenching was observed upon the addition of Fe2+ compared to the control in the absence of Zn2+ (Fig. 5, cf. curves b and c), a result confirming that the 3-fold channels are the primary pathways for rapid Fe2+ entry into the protein shell.
Figure 5.
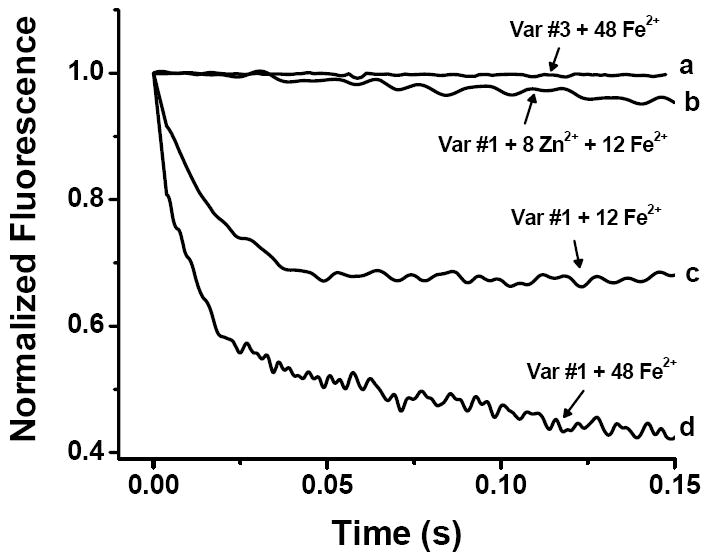
Stopped-flow fluorescence quenching by the anaerobic addition of 48 Fe2+ to apo-variant #3 (curve a), of 12 Fe2+ to apo-variant #1 with 8 Zn2+ bound (curve b), of 12 Fe2+ to apo-variant #1 (curve c), and of 48 Fe2+ to apo-variant #1 (curve d). Each curve is the average of 6 to 9 runs. Final conditions: 0.5 μM protein in 25 mM Mops hemisodium salt, 12.5 mM NaCl, pH 7.15, 25 °C. The Fe2+ solution was prepared in anaerobic 25 mM NaCl, pH ~ 2.5.
The slow further quenching beyond ~ 20 ms observed with variant #1 containing 48 Fe2+/shell (Fig. 5, curve d) is attributed to trace O2 in the solution slowly oxidizing some of the Fe2+ to Fe3+ (Fe3+ binding quenches the fluorescence about twice as much as Fe2+ binding). This additional slow quenching was not observed in the spectrometric titrations (c.f.Fig. 3) where anaerobic conditions could be maintained better than in the stopped-flow experiments.
Kinetics of Fe2+diffusion to the ferroxidase site
The rate of Fe2+ binding to the ferroxidase center was determined by fluorescence quenching stopped-flow measurements in which Fe2+ was rapidly mixed anaerobically with apo-variant #1 at Fe2+/shell ratios ranging from 4/1 to 48/1. The time courses for fluorescence quenching show simple first-order decay (Fig. 6) with little influence of ionic strength on the rates (Materials and Methods). The samples containing 36 and 48 Fe2+/shell show a second phase that is 30 - 40 times slower than the first phase due to gradual oxidation of the iron. A slow second phase was also seen for the other samples when examined on a much longer time scale (not shown). We focus on the rapid-first phase due to Fe2+ binding at the ferroxidase centers.
Figure 6.

Stopped-flow fluorescence quenching by Fe2+ binding to variant #1. The corresponding fits to the data are shown in red. Each curve is the average of 6 to 9 kinetic runs. The data shown are truncated at 0.12 s but were gathered and fitted to 2.0 s. The fits are single exponentials, , except for the 36 and 48 Fe2+/shell samples where a second more slowly decaying exponential was used. Fitting to the initial rapid decay gives kobs = 46.6 ± 1.0, 52.0 ± 1.5, 56.9 ± 1.1, 64.9 ± 0.6, 69.9 ± 1.0, 81.0 ± 2.1, 89.8 ± 2.3 and 94.4 ± 2.5 s-1 for the 4 Fe2+ through 48 Fe2+/shell samples, respectively, with errors at the 95% confidence level. Final conditions: protein concentration 0.5 μM in 25 mM Mops, 12.5 mM NaCl, pH 7.15 at 25 °C with Fe2+ added in various amounts as indicated.
The initial rate of quenching shows saturation kinetics with respect to total Fe2+ concentration (Fig. 7), a phenomenon characteristic of facilitated diffusion in membranes whereby complexation and transport of the diffusant occurs.45,46 Formally, facilitated diffusion can be modeled by a scheme analogous to that for Michaelis-Menten enzyme kinetics (eq 2).45, 46 Here the free Fe2+ in the bulk solution is
Figure 7.
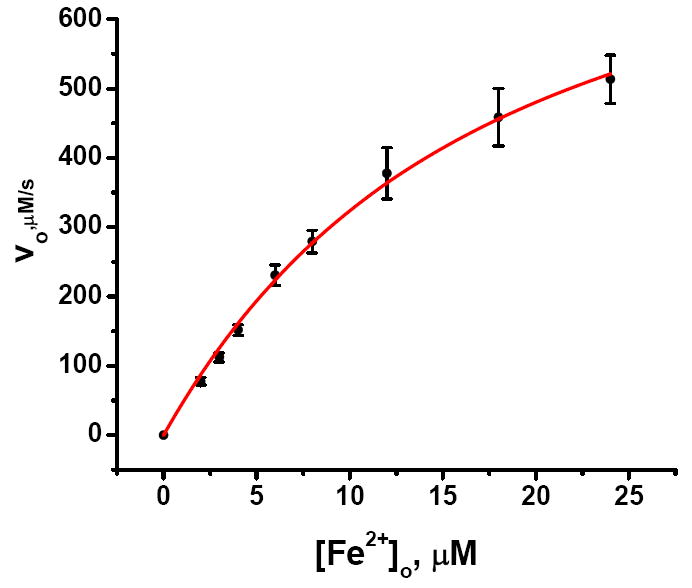
Plot of the initial velocity v0 for Fe2+ arrival at the ferroxidase center versus total Fe2+concentration. The initial velocity v0 is given by vo (μM/s) = α·kobs·(Io-I∞) where the values of kobs(s-1) and Io- I∞ are from curve fitting of each kinetic trace in Figure 6. Error bars are from the propagated errors in kobs and Io-I∞. α is the proportionality constant between the maximal concentration of Fe2+ bound at the ferroxidase centers and the maximal degree of fluorescence quenching, Io-I∞, namely α = 6μM Fe2+/0.54 = 11.1 μM (Supporting Information). Fitting of the unweighted data (red line) according to eq 3 with the concentration of channels [C]o = 4 μM gives KC = (7.0 ± 0.7) ×104 M-1 and kd = 216 ± 12 s-1 (95% confidence level).48
| (2) |
designated as Fe, the 3-fold hydrophilic channels as C, iron bound in the channels as FeC and iron bound at the ferroxidase site as FeF. KC represents the equilibrium constant for Fe2+ binding in the channels. kd is the apparent rate constant for diffusion from the channel binding site to the ferroxidase center. We assume that the first step is a rapid pre-equilibrium. Because in our experiments, the concentrations of the Fe2+ and channels are comparable, the usual assumption in Michaelis-Menten kinetics that substrate is in excess does not apply and the initial rate as a function of added Fe2+ ([Fe]o) takes on the following form (Supporting Information).47
| (3) |
In eq 3 the concentration of 3-fold channels sites [C]o is eight times the protein concentration. Curve fitting of the data in Figure 7 according to eq 3 gives KC = (0.70 ± 0.07) × 105 M-1 and kd = 216 ± 12 s-1, corresponding to a minimum half-life of 3.2 ms (at saturating Fe2+ concentration) for Fe2+ to arrive and bind at the ferroxidase center at rate saturating concentrations Fe2+ (more later).48 The value of KC from the kinetic analysis is similar to that obtained by ITC for Fe2+ binding in the channels, i.e. (0.7± 0.07) × 105 versus (1.5 ± 0.5) × 105 M-1.
Fluorescence quenching kinetics of variants #1 and #2 from O2 oxidation of prebound Fe2+
To determine whether Tyr29 plays an important role in O2 transport to the ferroxidase center, stopped-flow experiments were carried out in which anaerobic solutions of variants #1 and #2 prebound with Fe2+ (48 Fe2+ added per shell) were rapidly mixed with 100% O2 saturated water. Fe2+ oxidation by O2 resulted in rapid quenching of fluorescence in a similar fashion for both proteins (Fig. 8). (Whereas a single Fe2+ binds to the ferroxidase center at the A-site, both sites are occupied by Fe3+ following oxidation.14,15,24,29-31 After attempts to fit the data to several different models, the observed fluorescence quenching curves were best described by the standard two-step consecutive first-order reaction pathway as per eq 4:
Figure 8.
Stopped-flow fluorescence quenching by O2 oxidation of Fe2+ prebound to variants #1 (curve a) and #2 (curve b) containing 48 Fe2+/shell. Fitted curves are shown in red. The rate constants and intrinsic fluorescence constants for variant #1 from curve-fitting (curve a) are: k1 = 19.0 ± 3.1 s-1 and k2 = 1.86 ± 0.04 s-1, IA = 1.01 ± 0.02 μM-1 on a per iron dimer basis, IB = 0.655 ± 0.021 μM-1 dimer, and IC = 0.0425 + 0.0012 μM-1 dimer (curve a); and for variant #2 (curve b) are: k1 = 16.6 ± 2.3 s-1 and k2 = 2.38 ± 0.15 s-1, IA = 0.711 ± 0.011 μM-1 dimer, IB = 0.320 ± 0.030 μM-1 dimer, and IC = 0.0158 ± 0.0013 μM-1 dimer (curve b) from eq 5 with the equations for the concentrations of species given elsewhere.31 The residual is the difference between the fitted and experimental curves. The stated rate constants and associated errors are averages and standard deviations, respectively, from curve fits to three separate kinetic runs. The observed quenching kinetics is from the oxidation of the prebound Fe2+ and not from the binding of Fe2+ itself. Final conditions: anaerobic 1.5 μM apo-variants containing 48 Fe2+/shell in 50 mM Mops pH 7.15 rapidly mixed with H2O saturated with 100% O2, 25 °C.
| (4) |
In this model, species A corresponds to a colorless “Fe2+-O2-protein” complex rapidly formed at the ferroxidase center that converts to the peroxodiferric dimer B through a first-order process with a rate constant k1 as previously discussed.31 The unstable intermediate B then decays to a μ-oxodiferric dimer, species C, with a rate constant k2. The total fluorescence intensity, I(λ, t), of the reaction mixture as a function of time was fitted to the following equation for multiple species:
| (5) |
where the Ii terms are molar intensity constants for the intrinsic fluorescence of species A, B and C at the specified wavelength. The standard equations for the concentrations [A(t)], [B(t)], and [C(t)] as a function of time for the consecutive reaction A→B→C are given elsewhere31 and found in most standard physical chemistry texts. The data in Figure 8 conform well to eq 5, giving fitted values of the apparent first-order rate constants for variant #1 of k1 = 19.0 ± 3.1 and k2 = 1.86 ± 0.04 s-1 (curve a) and for variant #2 of k1 = 16.6 ± 2.3 and k2 = 2.38 ± 0.15 s-1 (curve b). The values of k1 for formation of the peroxodiferric intermediate for both variants #1 and #2 are identical within the experimental uncertainty, indicating that the substitution Y29Q has no significant effect on the kinetics of iron oxidation. Thus, O2 arrival at the ferroxidase center is not limiting the rate of Fe2+ oxidation in these proteins. We conclude that Tyr29 does not play a significant role in facilitating O2 diffusion to the ferroxidase center, contrary to theoretical prediction.37
UV-Vis absorption kinetics of variants #1 and #2 from O2 oxidation of prebound Fe2+
UV-visible stopped-flow spectrophotometry was carried out under the same conditions as the fluorescence experiments discussed above (Fig. 9). Again the model A→B→C gives the best description of the kinetics. The blue peroxodiferric intermediate B has an absorbance maximum at ~ 650 nm where the kinetics were monitored (Fig. 9). The data were curve-fitted according to eq 6 for the absorbance Y(λ, t) as a function of time where the εi correspond to molar absorptivities of species B and C at 650 nm as described elsewhere.31.33
Figure 9.
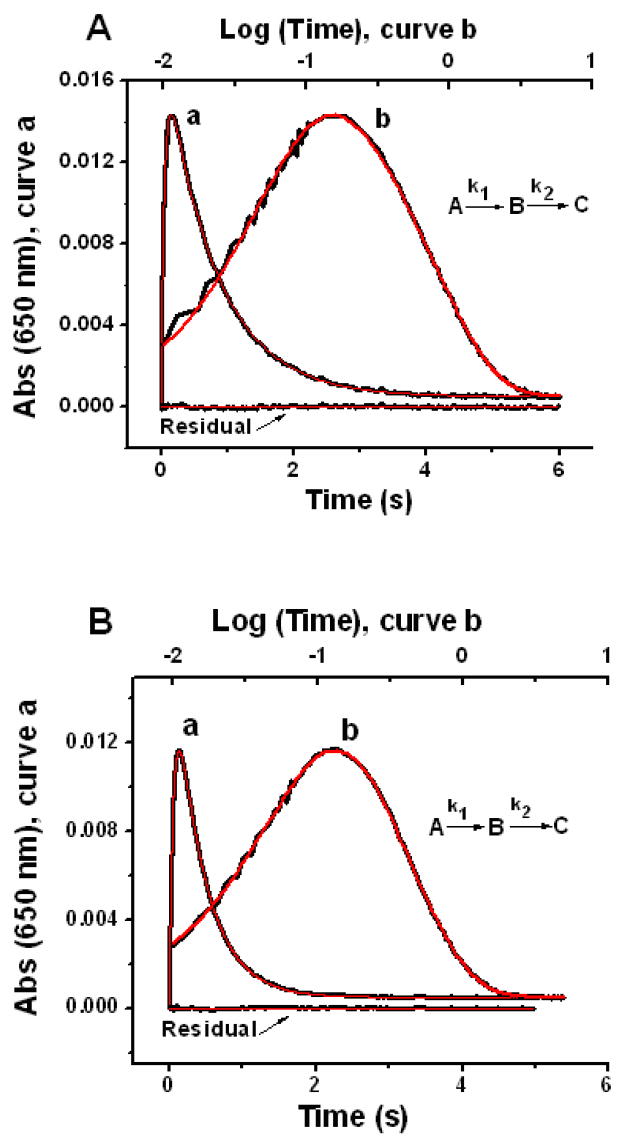
Stopped-flow absorbance versus time (curve a) and log(time) (curve b) for O2 oxidation of Fe2+ prebound to variants #1 (panel A) and #2 (panel B) containing 48 Fe2+/shell. Fitted curves are shown in red. The rate constants from curve-fitting are: k1 = 18.4 ± 0.4 s-1 and k2 = 1.29 ± 0.02 s-1 for variant #1 (Fig. 9A); k1 = 17.5 ± 0.6 s-1 and k2 = 2.49 ± 0.06 s-1 for variant #2 (Fig. 9B) from eq 6 with the equations for the concentrations of species given elsewhere.31 The stated rate constants and associated errors are averages and standard deviations, respectively, from curve fits to three separate kinetic runs. The residual is the difference between the fitted and experimental linear time curves. The conditions are the same as in Figure 8.
| (6) |
Curve fitting yielded k1 = 18.4 ± 0.4 and k2 = 1.29 ± 0.02 s-1 for variant #1 (Fig. 9A); and k1 = 17.5 ± 0.6 and k2 = 2.49 ± 0.06 s-1 for variant #2 (Fig. 9B), respectively (95% confidence level). The rate constants obtained from fitting the absorbance and fluorescence stopped-flow data are generally very similar (Figs. 8 and 9). However, we consider the rate constants from the absorbance data of Figure 9 to be more accurate because the formation and decay of the peroxo intermediate B are measured directly without significant contributions to the 650 nm absorbance from the other species. Again the rate constant k1 for formation of the peroxo intermediate is virtually unchanged by the substitution Y29Q, 18.4 versus 17.5 s-1, indicating that Tyr29 is not important kinetically for directing O2 to the ferroxidase center. However, substitution of Tyr29 with Gln29 ~ 12Ǻ from the ferroxidase center in variant #2 increases the rate constant k2 for decay of the peroxo intermediate by ~ 2-fold compared to variant #1, 2.49 s-1 vs. 1.29 s-1. Long range effects of substitutions have been noted previously for ferritins.49,50
To determine whether O2 binds at or near the ferroxidase center in the absence of Fe2+, an anaerobic solution of either variant #1 or #2 (0.5 μM) was exposed to 100% O2 atmosphere while monitoring the protein fluorescence. No quenching of fluorescence from the presence of O2 was observed (data not shown), suggesting that O2 by itself does not appreciably bind in the vicinity of Trp34 at the PO2 ~ 1 atm of the experiment.
DISCUSSION
The migration of Fe2+ through the protein shell to the ferroxidase center is one early event occurring prior to formation of the μ-peroxodiferric intermediate in ferritin. The present data demonstrate that the 3-fold channels are the only pathways for rapid Fe2+ entry into the protein because no fluorescence quenching is observed with variant #3 lacking coordinating residues in the channels and because there is minimal quenching when Zn2+ is bound in the channels of variant #1 (Fig. 5). Electrostatic calculations are consistent with Fe2+ migration to the ferroxidase center via a route involving these channels.51,52 The initial contact and equilibrium binding of Fe2+ in the channels modeled by eqs 2 and 3 likely involves the residues His118 and Cys130 at the outer opening of the channels as previous work suggests10,49,53,54 followed by the sequential migration to the deeper triads of Glu134 and Asp 131 residues. VO2+ binds at His118 and can be displaced by Fe2+, 49,54 and substitution of the His118 and Cys130 with alanine reduces iron uptake by the protein.53 Recent x-ray structural data on Zn2+ (an Fe2+ surrogate) binding in the 3-fold channels of HuHF show metal occupancy of all of the three channel sites (His118 + Cys130, Glu134 and Asp131 sites)10 in accord with the sequence of iron migration proposed here. It is not known which of these sites corresponds to the KC measured in this work, but the soft character of the ligands of the His118 + Cys130 site would seem to be particularly well suited for binding Fe2+. Figure 10 illustrates the putative pathway into the protein via the 3-fold channel and across the interior of the protein to the ferroxidase center. The residues Thr135, His136 and Tyr137 may be involved in guiding iron from the inner opening of the channel to the ferroxidase centers within the 4-helix bundle. This path on the protein interior is a somewhat more direct route than that previously postulated.17,51
Figure 10.
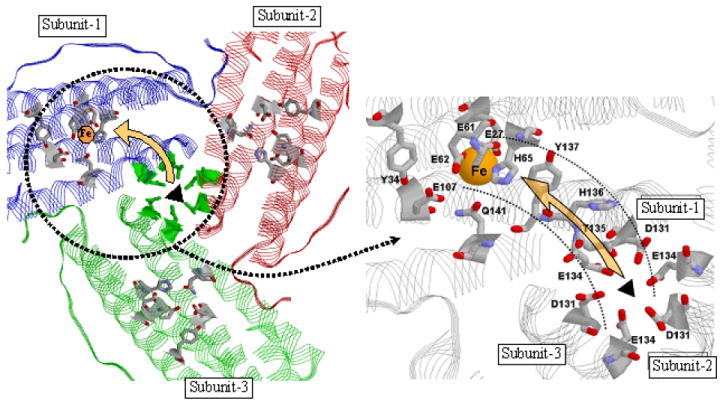
View from inside of the protein showing the suggested pathway for iron movement from the 3-fold channel to the ferroxidase center (left panel). Expanded view (right panel). The triads of 3-fold channel residues Asp131 and Glu134 are indicated. For clarity the three His118 and three Cys130 residues at the outer opening of the 3-fold channel are not shown. The ferroxidase center ligands His65, Glu27, Glu61, Glu107 and Glu62 and the residues Thr135, His136 and Tyr137 suggested to be involved in shuttling Fe2+ from the channels to the ferroxidase center are shown on the right. Residues Gln141 and Tyr34 involved in H-bonding in Figure 2 are also shown. The single Fe atom at the A-site (His-65 site) of the ferroxidase center is depicted in yellow.
Fe2+ entry into the protein likely involves ligand exchange reactions between coordinated water of Fe(H2O)62+ and the Asp131 and Glu134 residues of the channels because the 6.2 Å diameter of the aqua Fe2+ ion exceeds the 3–4 Å diameter of narrowest section of the channels. Such exchange reactions would enable the Fe2+ to overcome the restrictive porosity of the channels as proposed by Raymond and coworkers.21,25 A gated process allowing the preferential passage of iron could also be operable as suggested by experiments employing mutagenesis and chaotropic agents.26-28 “Breathing” of the channels probably accounts for the ability of slightly larger (7 – 9 Å dia) nitroxide spin probes to diffuse into ferritin, albeit at rates 106-fold slower than that of Fe2+ observed here, a process that is also inhibited by Zn2+.55
The stopped-flow fluorescence quenching data of Figures 6 and 7 reveal that binding of Fe2+ to the ferroxidase center occurs rapidly with a hyperbolic dependence of the rate characteristic of facilitated diffusion,45,46 in accord with a model in which Fe2+ is complexed by the channels and passed through them. Because ligand exchange/substitution reactions of Fe2+ chelates typically occur on the microsecond time scale56 compared to the millisecond kinetics observed here, diffusion is most likely the rate limiting step for iron to bind at the ferroxidase center; thus we equate the measured value of the rate constant kd = 216 s-1 from Figure 7 and eq 2 with the rate constant for diffusion (or its lower limit). When the channels are saturated with Fe2+, the maximal rate of diffusion across the protein shell occurs with a half-life of 3 ms (or less), consistent with a previous multimixing stopped-flow study predicting that it be less than ~ 50 ms for the wild-type protein29 and in accord with it being less than the half-life of ~ 50 ms for the formation of the peroxo complex in variant #1 under aerobic conditions for both protein and iron solutions (Fig. S6).
A more detailed model for iron migration down the channels of ferritin is not easily formulated because it involves a combination of Fickian diffusion, drift forces from the electric field gradient on the protein surface,51 fluxional character of the channels26-28 and the dynamics of ligand exchange reactions within the channels.21,25 If we assume that Fickian diffusion solely applies, an estimate of the “apparent diffusion coefficient” can be obtained. We equate the first-order half-life from the kinetics measurements to the time for half of the Fe2+ to travel the thickness of the protein shell d through a one-dimensional random walk process,45 namely or . By substituting kd = 216 s-1 and d = 12 Å (corresponding to the length of the narrowest region of the channel), into the above equation, we obtain D ~ 5 × 10-16 m2/s.57 This value of D is considerably smaller than the measured diffusion coefficient for Fe(H2O)62+ in water (D = 7.0 × 10⁻¹⁰ m2/s).58,59 If we correct the diffusion coefficient in water for the small fraction (0.0005) of the external surface area of the protein shell occupied by the openings of the eight funnel shaped channels, each having a cross-sectional area of ~ 25 Å2,51 we obtain a predicted value of D ~ 3.5 × 10⁻¹³ m2/s. This latter value corresponds to that expected for the unimpeded movement of the Fe2+ through the channels by a completely random walk process where the total cross-sectional area of the channels (assumed to be rigid pipes) and the viscosity of water are the only factors limiting the rate of transport into the protein shell. The estimated apparent diffusion coefficient of 5 × 10-16 m2/s from the value of kd is nearly 1000-fold slower than the predicted value of D ~ 3.5 × 10⁻¹³ m2/s, further emphasizing the importance of other factors in affecting the movement of iron down the channels.
The approximately 10-fold greater conditional constant for Fe2+ binding at the ferroxidase centers compared to the channel binding sites (KF ~ 106 M-1 vs. KC ~ 105 M-1) is consistent with the ferroxidase center being a thermodynamic sink for Fe2+, favoring the translocation of iron to the center where oxidation takes place. The binding of Fe2+ in both instances is entropically driven (Fig. 4 caption). That only ~ 12 of the 24 ferroxidase centers bind Fe2+in variant #1 (Figs. 3, 4 and S5) compared to all 24 Fe2+ centers for the WT protein24 was unexpected in that the two proteins appear to fold similarly (Figs. S1 and S2). However, a similar phenomenon has been observed with mitochondrial ferritin (MtF) which has the same ferroxidase center residues and overall structure as human H-chain ferritin.60 Only 12 of the 24 ferroxidase centers of MtF bind iron and are catalytically active.61 The origin of this effect in WT MtF and the variant #1 of HuHF is unclear.
The rate constant kd = 216 s-1 reported here for diffusion of Fe2+ through the 3-fold channels to the ferroxidase center of human H-chain is at variance with the 540-fold smaller value of 0.40 s-1 reported for the transfer of Fe2+ down the channels of horse spleen ferritin to the protein cavity where it reacts with encapsulated ferricyanide, K3Fe(CN)6, to form Prussian Blue, KFe[Fe(CN)6].34 The rate constant of 0.40 s-1 (t1/2 = 1.7 s) cannot correspond to migration of iron across the protein shell because it is smaller than the recently measured rate constant of 17.7 s-1 (t1/2 = 39 ms) for formation of the peroxodiferric complex in horse spleen ferritin.33 In the Prussian blue study, the authors suggest that Fe2+ might rapidly bind to the ferroxidase site and then slowly transfer to the “core” K3Fe(CN)6, thus accounting for the low rate of formation of KFe[Fe(CN)6].34 In any case, the kinetics observed in the Prussian blue experiment are considerably more complex than those reported here and do not appear to be a true measure of diffusion of Fe2+ across the ferritin shell.
Our data do not support the hypothesis37 that the “1-fold” channels are important pathways for O2 penetration to the ferroxidase center (Figs. 8 and 9). Tyr29 at the entrance to these channels (Fig. 1D) does not have a functional role because essentially identical rates of formation of the peroxo intermediate for the control variant #1 and the Y29Q variant #2 are obtained (k1 = 18.4 ± 0.4 vs. 17.5 ± 0.6 s-1, respectively) when O2 is rapidly mixed with the protein prebound with Fe2+ (Figs. 8 and 9). Thus, O2 must penetrate to the ferroxidase centers faster than the millisecond time scale of our experiments and therefore does not influence the rate of Fe2+ oxidation. Oxygen has been shown to travel through protein matrices at near diffusion controlled rates.62
Finally, we note that the substitution Y34W influences both the thermodynamic and kinetic properties of the human H-chain ferritin even though the CD and melting properties of the protein are changed little by the substitution (Figs. S1 and S2). Not only is the stoichiometry of Fe2+ binding reduced from 24 to 12 Fe2+/shell (Figs. 3, 4 and S5), the rate constant for formation of the peroxo diFe3+ complex under aerobic conditions is reduced as well, from 48.1 s-1 per 24 ferroxidase sites for the WT protein to 13.8 s-1 per 12 ferroxidase sites for variant #1 (Fig. S6), corresponding to a reduction by a factor of 1.7 in rate constant per ferroxidase site. A similar reduction in the rate of iron uptake has also been reported for variant Y34F of HuHF.14 Elimination of the H-bond from Tyr34 to the ligand Glu-107 (Fig. 2) by the substitution Y34W or Y34F may be partly responsible for the observed changes in the properties of the protein. Despite these differences, the main conclusions derived from the present study likely apply to the wild type protein, namely that Fe2+ diffusion is rapid and occurs through the eight 3-fold channels and that Tyr29 is not important for O2 diffusion into the protein.
In summary, our experiments with Y34W variants of human H-chain ferritin have provided new insights into the very early events of iron deposition in ferritin. In particular, the rate at which Fe2+ arrives at the ferroxidase center has been measured directly for the first time and shown to be ~15-fold faster than the rate of aerobic Fe2+ oxidation in the variants studied, t1/2 = 3 ms vs. 50 ms (Fig. S6). Moreover, the 3-fold channels have been demonstrated kinetically to be the only pathways for rapid iron entry into the protein by a process involving facilitated diffusion. O2 diffusion into the protein does not depend on Tyr29 and occurs on a time scale much faster than milliseconds.
Supplementary Material
Circular dichroism spectra of apo-HuHF and apo-variant #1, kinetic data for test reactions of the stopped-flow instrumentation, anaerobic ultraviolet spectrometric titration of apo-variant #1 with Fe2+, stopped-flow absorbance-time curves for aerobic addition of Fe2+ to apo-variant #1 and to apo-HuHF, derivation of the Fe2+ binding isotherm (eq 1) and deriviation of the kinetic model for diffusion (eq 3). This information is available free of charge via the Internet at http://pubs.acs.org/.
Acknowledgments
This work was supported by Grant R01 GM20194-33 from the National Institute of General Medical Sciences (N.D.C.) and by grant MIUR-PRIN 2006 (P.A.). The authors thank Prof. Martin Case of the University of Vermont for measuring the CD spectra and melting curves for the WT and variant #1 proteins.
ABBREVIATIONS
- BSA
bovine serum albumin
- CD
circular dichroism
- EcFtnA
Escherichia coli bacterial ferritin type A
- MtF
human mitochondrial ferritin
- HuHF
human H-subunit ferritin
- ITC
isothermal titration calorimetry
- Mops
3-(N-morpholino)propanesulfonic acid
- NATA
N-acetyltryptophanamide
- NBS
N-bromo-succinamide
- WT
wild-type
References
- 1.Smith JL. Crit Rev Microbiol. 2004;30:173–185. doi: 10.1080/10408410490435151. [DOI] [PubMed] [Google Scholar]
- 2.Harrison PM, Arosio P. Biochim Biophys Acta Bio-Energ. 1996;1275:161–203. doi: 10.1016/0005-2728(96)00022-9. [DOI] [PubMed] [Google Scholar]
- 3.Chasteen ND, Harrison PM. J Struct Biol. 1999;126:182–194. doi: 10.1006/jsbi.1999.4118. [DOI] [PubMed] [Google Scholar]
- 4.Liu XS, Theil EC. Acc Chem Res. 38:167–175. doi: 10.1021/ar0302336. [DOI] [PubMed] [Google Scholar]
- 5.Galaris D, Pantopoulos K. Crit Rev Cl Lab Sci. 2008;45:1–23. doi: 10.1080/10408360701713104. [DOI] [PubMed] [Google Scholar]
- 6.Zhao G, Bou-Abdallah F, Arosio P, Levi S, Janus-Chandler C, Chasteen ND. Biochemistry. 2003;42:3142–3150. doi: 10.1021/bi027357v. [DOI] [PubMed] [Google Scholar]
- 7.Zhao G, Arosio P, Chasteen ND. Biochemistry. 2006;45:3429–3436. doi: 10.1021/bi052443r. [DOI] [PubMed] [Google Scholar]
- 8.(a) Mayes EL, Mann S. Nanobiotechnology. 2004:278–287. [Google Scholar]; (b) Klem MT, Mosolf J, Young M, Douglas T. Inorg Chem. 2008;47:2237–2239. doi: 10.1021/ic701740q. [DOI] [PubMed] [Google Scholar]; (c) Kasyutich O, Sarua A, Schwarzacher W. J Physics D: Applied Physics. 2008;41:134022/1–134022/3. [Google Scholar]; (d) Miura A, Uraoka Y, Fuyuki T, Yoshii S, Yamashita I. J Applied Physics. 2008;103:074503/1–074503/10. [Google Scholar]
- 9.Lawson DM, Artymiuk PJ, Yewdall SJ, Smith JMA, Livingstone JC, Treffry A, Luzzago A, Levi S, Arosio P, Cesareni G, Thomas CD, Shaw WV, Harrison PM. Nature. 1991;349:541–544. doi: 10.1038/349541a0. [DOI] [PubMed] [Google Scholar]
- 10.Toussaint L, Bertrand L, Hue L, Crichton RR, Declercq J-P. J Mol Biol. 2007;365:440–452. doi: 10.1016/j.jmb.2006.10.010. [DOI] [PubMed] [Google Scholar]
- 11.(a) Theil EC, Liu XS, Matzapetakis M. Metal Ions in Life Sciences. 2008;4:327–341. [Google Scholar]; (b) Schwartz JK, Liu XS, Tosha T, Theil EC, Solomon EI. J Am Chem Soc. 2008;130:9441–9450. doi: 10.1021/ja801251q. [DOI] [PMC free article] [PubMed] [Google Scholar]
- 12.Bou-Abdallah F, Papaefthymiou G, Scheswohl DS, Stanga S, Arosio P, Chasteen ND. Biochem J. 2002;364:57–63. doi: 10.1042/bj3640057. [DOI] [PMC free article] [PubMed] [Google Scholar]
- 13.Treffry A, Zhao Z, Quail MA, Guest JR, Harrison PM. Biochemistry. 1995;34:15204–15213. doi: 10.1021/bi00046a028. [DOI] [PubMed] [Google Scholar]
- 14.Zhao Z, Treffry A, Quail MA, Guest JR, Harrison PM. J Chem Soc Dalton Trans. 1997:3977–3978. [Google Scholar]
- 15.Pereira AS, Small W, Krebs C, Tavares P, Edmondson DE, Theil EC, Huynh BH. Biochemistry. 1998;37:9871–9876. doi: 10.1021/bi980847w. [DOI] [PubMed] [Google Scholar]
- 16.Waldo GS, Theil EC. Biochemistry. 1993;32:13262–13269. doi: 10.1021/bi00211a039. [DOI] [PubMed] [Google Scholar]
- 17.Treffry A, Bauminger ER, Hechel D, Hodson NW, Nowik I, Yewdall SJ, Harrison PM. Biochem J. 1993;296:721–728. doi: 10.1042/bj2960721. [DOI] [PMC free article] [PubMed] [Google Scholar]
- 18.Levi S, Santambrogio P, Corsi B, Cozzi A, Arosio P. Biochem J. 1996;317:467–73. doi: 10.1042/bj3170467. [DOI] [PMC free article] [PubMed] [Google Scholar]
- 19.Treffry A, Harrison PM, Luzzago A, Cesareni G. FEBS Lett. 1998;247:268–272. doi: 10.1016/0014-5793(89)81350-x. [DOI] [PubMed] [Google Scholar]
- 20.Bou-Abdallah F, Arosio P, Levi S, Janus-Chandler C, Chasteen ND. J Biol Inorg Chem. 2003;8:489–497. doi: 10.1007/s00775-003-0455-6. [DOI] [PubMed] [Google Scholar]
- 21.Barnés CM, Theil EC, Raymond KN. PNAS. 2002;99:5195–5200. doi: 10.1073/pnas.032089399. [DOI] [PMC free article] [PubMed] [Google Scholar]
- 22.Michaux MA, Dautant A, Gallois B, Granier T, d’Estaintot BL, Precigoux G. Proteins. 1996;24:314–21. doi: 10.1002/(SICI)1097-0134(199603)24:3<314::AID-PROT4>3.0.CO;2-G. [DOI] [PubMed] [Google Scholar]
- 23.Harrison PM, Ford GC, Rice DW, Smith JMA, Treffry A, White JL. The three-dimensional structure of apoferritin. A framework controlling ferritin’s iron storage and release. In: Xavier A, editor. Frontiers in Bioinorganic Chemistry. VCH; Weinheim, Germany: 1986. pp. 268–277. [Google Scholar]
- 24.Bou-Abdallah F, Arosio P, Santambrogio P, Yang X, Janus-Chandler C, Chasteen ND. Biochemistry. 2002;41:11184–11191. doi: 10.1021/bi020215g. [DOI] [PubMed] [Google Scholar]
- 25.Barnés CM, Petoud S, Cohen SM, Raymond KN. J Biol Inorg Chem. 2003;8:195–205. doi: 10.1007/s00775-002-0409-4. [DOI] [PubMed] [Google Scholar]
- 26.Liu X, Jin W, Theil EC. PNAS. 2003;100:3653–3658. doi: 10.1073/pnas.0636928100. [DOI] [PMC free article] [PubMed] [Google Scholar]
- 27.Liu X, Theil EC. Acc Chem Res. 2005;38:167–175. doi: 10.1021/ar0302336. [DOI] [PubMed] [Google Scholar]
- 28.Theil EC, Takagi H, Small GW, He L, Tipton AR, Danger D. Inorg Chim Acta. 2000;297:242–251. [Google Scholar]
- 29.Treffry A, Zhao Z, Quail MA, Guest JR, Harrison PM. Biochemistry. 1997;36:432–441. doi: 10.1021/bi961830l. [DOI] [PubMed] [Google Scholar]
- 30.Moënne-Loccoz P, Krebs C, Herlihy K, Edmondson DE, Theil EC, Huynh BH, Loehr TM. Biochemistry. 1999;38:5290–5295. doi: 10.1021/bi990095l. [DOI] [PubMed] [Google Scholar]
- 31.Bou-Abdallah F, Zhao G, Mayne HR, Arosio P, Chasteen ND. J Am Chem Soc. 2005;127:3885–3893. doi: 10.1021/ja044355k. [DOI] [PubMed] [Google Scholar]
- 32.Liu X, Theil EC. PNAS. 2004;101:8557–8562. doi: 10.1073/pnas.0401146101. [DOI] [PMC free article] [PubMed] [Google Scholar]
- 33.Zhao G, Su M, Chasteen ND. J Mol Biol. 2005;352:467–477. doi: 10.1016/j.jmb.2005.07.039. [DOI] [PubMed] [Google Scholar]
- 34.Zhang B, Watt RK, Gálvez N, Dominguez-Vera J, Watt GD. Biophys Chem. 2006;120:96–105. doi: 10.1016/j.bpc.2005.10.005. [DOI] [PubMed] [Google Scholar]
- 35.Ford GC, Harrison PM, Rice DW, Smith JMA, Treffry A, White JL, Yariv J. Phil Trans Roy Soc London. 1984;304:551–565. doi: 10.1098/rstb.1984.0046. [DOI] [PubMed] [Google Scholar]
- 36.Stillman TJ, Hempstead PD, Artymiuk PJ, Andrews SC, Hudson AJ, Treffry A, Guest JR, Harrison PM. J Mol Biol. 2001;307:587–603. doi: 10.1006/jmbi.2001.4475. [DOI] [PubMed] [Google Scholar]
- 37.Ciacchi LC, Payne MC. Chem Phys Lett. 2004;390:491–495. [Google Scholar]
- 38.Yang X, Chen-Barrett Y, Arosio P, Chasteen ND. Biochemistry. 1998;37:9743–9750. doi: 10.1021/bi973128a. [DOI] [PubMed] [Google Scholar]
- 39.Santambrogio P, Cozzi A, Levi S, Rovida E, Magni F, Albertini A, Arosio P. Protein Expr Purif. 2000;19:212–218. doi: 10.1006/prep.2000.1212. [DOI] [PubMed] [Google Scholar]
- 40.Zhao G, Bou-Abdallah F, Yang X, Arosio P, Chasteen ND. Biochemistry. 2001;40:10832–10838. doi: 10.1021/bi011052j. [DOI] [PubMed] [Google Scholar]
- 41.Bauminger ER, Harrison PM, Hechel D, Nowik I, Treffry A. Biochim Biophys Acta. 1991;1118:48–58. doi: 10.1016/0167-4838(91)90440-b. [DOI] [PubMed] [Google Scholar]
- 42.Treffry A, Hirzmann J, Yewdall SJ, Harrison PM. FEBS Lett. 1992;302:108–112. doi: 10.1016/0014-5793(92)80417-f. [DOI] [PubMed] [Google Scholar]
- 43.Peterman BF. Anal Biochem. 1979;93:442–444. doi: 10.1016/s0003-2697(79)80176-1. [DOI] [PubMed] [Google Scholar]
- 44.Lakowicz JR. Principles of Fluorescence Specctroscopy. Klewer Academic; New York: 1999. pp. 454–456. [Google Scholar]
- 45.Weiss TF. Cellular Biophysics. Chaps 3 and 6. Vol 1: Transport. MIT Press; Cambridge, MA: 1996. [Google Scholar]
- 46.Keener J, Sneyd . J Mathematical Physiology. Springer; New York: 1998. pp. 38–48. [Google Scholar]
- 47.Segel IH. Enzyme Kinetics. Wiley-Interscience; New York: 1975. pp. 72–74. [Google Scholar]
- 48.Fitting of the data to eq 3 with each data point weighted by its error bar σi (wi= 1/σi2) gave KC = (5.2 ± 1.1) × 104 M-1 and kd = 252 ± 36 (95 % confidence level) which are within the error of the values from the unweighted fitting.
- 49.Grady JK, Shao J, Arosio P, Santambrogio P, Chasteen ND. J Inorg Biochem. 2000;80:107–113. doi: 10.1016/s0162-0134(00)00046-5. [DOI] [PubMed] [Google Scholar]
- 50.Trikha J, Theil EC, Allewell NM. J Mol Biol. 1995;248:949–967. doi: 10.1006/jmbi.1995.0274. [DOI] [PubMed] [Google Scholar]
- 51.Douglas T, Ripoll DR. Protein Sci. 1998;7:1083–1089. doi: 10.1002/pro.5560070502. [DOI] [PMC free article] [PubMed] [Google Scholar]
- 52.Takahashi T, Kuyucak S. Biophys J. 2003;84:2256–2263. doi: 10.1016/S0006-3495(03)75031-0. [DOI] [PMC free article] [PubMed] [Google Scholar]
- 53.Levi S, Santambrogio P, Corsi B, Cozzi A, Arosio P. Biochem J. 1996;317:467–473. doi: 10.1042/bj3170467. [DOI] [PMC free article] [PubMed] [Google Scholar]
- 54.Hanna PM, Chasteen ND, Rottman GA, Aisen P. Biochemistry. 1991;30:9210–9216. doi: 10.1021/bi00102a012. [DOI] [PubMed] [Google Scholar]
- 55.Yang X, Arosio P, Chasteen ND. Biophys J. 2000;78:2049–2069. doi: 10.1016/S0006-3495(00)76752-X. [DOI] [PMC free article] [PubMed] [Google Scholar]
- 56.Wilkins RG. Kinetics and Mechanism of Reactions of Transition Metal Complexes. VCH; Weinheim: 1991. p. 202. [Google Scholar]
- 57.The equation used here differs by a factor of ~16 from the relationship previously used to estimate D in other studies of the diffusion of Fe2+ and nitroxides into ferritin.34,55 This relationship is not appropriate since its derivation is based on the relaxation time τss for reaching a steady state in diffusant concentration with distance rather than the half-life, τ1/2, for material transport.45 Therefore, in previous work34,55 the “apparent Fickian diffusion coefficients” were underestimated by a factor of ~16.
- 58.Leaist DG, Hao L. J Chem Soc Faraday Trans. 1994;90:133–136. [Google Scholar]
- 59.Spiro M, Creeth AM. J Chem Soc Faraday Trans. 1990;86:3573–3576. [Google Scholar]
- 60.Langlois d′Estaintot B, Santambrogio P, Granier T, Gallois B, Chevalier JM, Precigoux G, Levi S, Arosio P. J Mol Biol. 2004;340:277–293. doi: 10.1016/j.jmb.2004.04.036. [DOI] [PubMed] [Google Scholar]
- 61.Bou-Abdallah F, Santambrogio P, Levi S, Arosio P, Chasteen ND. J Mol Biol. 2005;347:543–554. doi: 10.1016/j.jmb.2005.01.007. [DOI] [PubMed] [Google Scholar]
- 62.Coppy M, Jameson DM, Alpert B. FEBS Lett. 1981;126:191–194. doi: 10.1016/0014-5793(81)80239-6. [DOI] [PubMed] [Google Scholar]
Associated Data
This section collects any data citations, data availability statements, or supplementary materials included in this article.
Supplementary Materials
Circular dichroism spectra of apo-HuHF and apo-variant #1, kinetic data for test reactions of the stopped-flow instrumentation, anaerobic ultraviolet spectrometric titration of apo-variant #1 with Fe2+, stopped-flow absorbance-time curves for aerobic addition of Fe2+ to apo-variant #1 and to apo-HuHF, derivation of the Fe2+ binding isotherm (eq 1) and deriviation of the kinetic model for diffusion (eq 3). This information is available free of charge via the Internet at http://pubs.acs.org/.