

Abstract
The actions of luteinizing hormone (LH) mediated through its receptor (LHR) are critical for testicular steroidogenesis and Leydig cell differentiation. We have previously characterized transgenic mice expressing a genetically engineered, constitutively active yoked hormone-receptor complex (YHR), in which a fusion protein of human chorionic gonadotropin (hCG) was covalently linked to LHR. Elevated testosterone levels were detected in male mice expressing YHR (YHR+) at 3 and 5 weeks of age, accompanied by decreases in testicular weight and serum levels of LH and FSH. Here we report a temporal study to identify testicular genes whose expression is altered in YHR+ mice during postnatal development. The mRNA expression levels for the steroidogenic enzymes, P450 17α-hydroxylase, 17β-hyroxysteroid dehydrogenase3 and 5α-reductase1 were down-regulated in 3 and 5 week old YHR+ testis. This result coupled with an immunohistochemical analysis of Leydig cell specific proteins and quantification of Leydig cell numbers identified a decrease in adult Leydig cells in YHR+ mice. Surprisingly, no change was detected for cytochrome P450 side-chain cleavage or steroidogenic acute regulatory protein RNA levels between WT and YHR+ mice. In contrast, mRNA levels for insulin-like growth factor binding protein 3 were up-regulated in 3 and 5 week old YHR+ mice. The mRNA levels for several germ cell-specific proteins were up-regulated at 5 weeks of age in both WT and YHR+ mice. We conclude that premature high levels of testosterone alter the expression of a select number of testicular genes and impair the differentiation of adult Leydig cells in mice.
Keywords: Luteinizing hormone receptor, gene expression, Leydig cell development
1. Introduction
The gonadotropins, LH, human chorionic gonadotropin (hCG) and follicle stimulating hormone (FSH) and their respective seven transmembrane G protein-coupled receptors, LHR (which binds both LH and hCG) and FSHR, are critical for reproductive function. LH, hCG and FSH are heterodimeric hormones consisting of a common α-subunit and a β-subunit that is hormone specific (Hearn and Gomme, 2000). In males, LHR is expressed in the Leydig cells of the testis where its primary function is the stimulation of steroidogenesis. Activation of FSHR in Sertoli cells is important in testicular development and spermatogenesis (Themmen and Huhtaniemi, 2000). Both receptors signal primarily through the Gαs mediated cAMP pathway. Additionally, LHR activates the phospholipase C/inositol phosphate pathway (Fanelli et al., 2001; Ascoli et al., 2002) as well as the mitogenic ERK1/2 cascade in MA-10 Leydig cells and in primary cultures of rat Leydig cells (Hirakawa et al., 2002; Shiraishi and Ascoli, 2007). Several activating or gain-of-function germ-line mutations in human LHR have been identified in males with gonadotropin-independent precocious puberty, characterized by prepubertal increases in testosterone and Leydig cell hyperplasia (Themmen and Huhtaniemi, 2000; Themmen, 2005). In contrast, inactivating mutations in LHR result in male pseudohermaphroditism and Leydig cell hypoplasia (Themmen and Huhtaniemi, 2000; Themmen, 2005).
Previous studies with LHR knock-out mice have demonstrated that, unlike the situation in humans, sexual development in mice is normal until birth (Lei et al., 2001; Zhang et al., 2001). However, postnatal Leydig cell development, steroidogenesis and spermatogenesis are blocked (Lei et al., 2004; Zhang et al., 2004). Similar results are obtained with the LHβ knock-out mice (Ma et al., 2004), illustrating the important role of LH in Leydig cell development and steroidogenesis.
We have previously reported the phenotypic characterization of a transgenic mouse model expressing a genetically engineered, constitutively active hCG-LHR complex (YHR+) (Meehan et al., 2005). In this construct (YHR), a fusion protein containing the β and α-subunits of hCG was covalently linked to LHR in a single polypeptide chain (Wu et al., 1996). In cell culture, YHR exhibited constitutive activity increasing the basal levels of both cAMP and IP3 (Meehan and Narayan, 2007). In male YHR+ mice, testosterone levels and seminal vesicle weights were elevated at the ages of 3 and 5 weeks in comparison to wild type (WT) mice (Meehan et al., 2005) while the serum levels of LH, FSH and testicular weights were decreased at these ages. However, testosterone and LH levels were not different in adult WT and YHR+ mice (8 and 12 weeks of age). In contrast, serum FSH levels and testes weights remained decreased in adult animals. The smaller testes size in the YHR+ mice was attributed to a significant reduction in tubule size. In contrast to the precocious puberty observed in humans harboring a constitutively active mutant LHR, YHR+ mice do not show any signs of advanced puberty and there was no evidence that spermatogenesis was accelerated in these mice (Meehan et al., 2005).
To study the molecular basis for the histological and endocrine changes observed as a result of constitutive LHR signaling, we have examined the expression of proteins that are important in testicular endocrine function and growth and differentiation during prepubertal and adult stages of development in WT and YHR+ mice. Our results show that there are alterations in the expression of several testicular genes and impairment in postnatal Leydig cell development.
2. Materials and Methods
2.1. Animal husbandry
We have previously described the generation and phenotypic characterization of transgenic mice expressing a yoked hormone receptor complex (YHR) (Meehan et al., 2005). Briefly, transgenic mice expressing YHR (YHR+) under the control of the inhibin α-subunit promoter were bred with C57BL/6J mice. The mice were genotyped by PCR of tail DNA as described previously (Meehan et al., 2005). The mice were maintained in a conventional colony with a 12h light, 12h dark cycle and fed a standard laboratory chow (Purina Labdiet 5008). All animal studies were approved by the Institutional Animal Care and Use Committee at Southern Illinois University and the University of Georgia.
2.2. RNA isolation, cDNA synthesis and real-time RT-PCR
Testes were dissected from WT and YHR+ mice at 3, 5 and 8 weeks of age and flash frozen in liquid nitrogen. Total RNA was extracted from testis after homogenization in RNA Stat-60 (Tel-test Inc., Friendswood, TX) following the manufacturer’s directions, and RNA concentrations were determined by spectrophotometry. RNA was treated with DNase I (DNA-free kit, Ambion, Austin, TX) for 30 min at 37 °C to remove potential contaminating DNA followed by treatment with inactivating reagent to remove the DNase. cDNA was synthesized using the Retroscript Kit (Ambion, Austin, TX). Briefly, 1 μg of DNase treated RNA was incubated for 1 h at 44 °C with 10 μM random decamers, 1 μM deoxy-NTP mixture, 10 U RNase inhibitor and 100 U Moloney murine leukemia virus reverse transcriptase in a final volume of 20 μl of 1x reverse transcriptase buffer. The reaction was terminated by heating at 94 °C for 10 min.
Real-time RT-PCR analysis for LHR (Lhcgr) was performed on a MyIQ real time PCR detection system (Bio-Rad Laboratories, Hercules, CA) using Sybr green PCR master mix (Bio-Rad Laboratories, Hercules, CA). The forward primer was designed to anneal to the signal sequence of mLHR (5′ GGTGCTGGCAATGCTGGTG 3′) and the reverse primer within the sequence of the mature protein (5′ CGCACTCGCAGGGCTCAG 3′). 10 ng of cDNA was used in a 25 μl reaction volume and samples and controls were run in duplicate. A template negative control and a calibrator sample, prepared by mixing equal amounts of RNA from all the samples, were also analyzed. In addition, a control without reverse transcriptase was included to ensure the effectiveness of the DNase treatment. Ribosomal protein S2 (Rps 2) was used as the endogenous control because its levels did not change significantly in the testis at the different ages. Four independent samples of each genotype were analyzed. The amplification protocol consisted of an initial denaturation at 95 °C for 3 min followed by 35 cycles for 15 sec at 95 °C and 57 °C annealing for 1 min. Amplification was followed by melt curve analysis to ensure that no primer-dimer amplification occurred. For each primer, a standard curve was made by a dilution series of a reference testis RNA sample to ensure that amplification efficiencies were not significantly different. The data were analyzed by the ΔΔCT method (Livak and Schmittgen, 2001). The difference in the CT value between Lhcgr and Rps 2 was defined at ΔCT. The difference in ΔCT between the gene of interest and calibrator was defined as ΔΔCT. The fold-change in Lhcgr normalized to Rps 2 and relative to calibrator was defined by 2−ΔΔCT.
2.3. Real time RT-PCR with gene expression cards
7900HT microfluidic cards (configuration 8) were designed and purchased from Applied Biosystems (Foster City, CA). Each of these 384 well Low Density Array cards contained 95 gene targets and one 18s rRNA internal control. The list of genes is provided in Supplementary Table 1. Total RNA was prepared as described above and submitted to the Functional Genomics Resource Facility at the University of Georgia. The integrity of the RNA was verified and quantified using a RNA 6000 Series II Nano Assay (Agilent Technologies) and the Agilent 2100 Bioanalyzer. cDNA was synthesized from 500 ng of total RNA in a 20 μl reaction using the cDNA archive kit (Applied Biosystems, Foster City, CA) according to the manufacturer’s protocols. Quantitative PCR (TaqMan) assays were performed using the TaqMan universal PCR master mix on the ABI PRISM Sequence Detection System. 100 ng of cDNA was injected into each port and the cycle conditions were 94.5 °C for 15 min followed by 40 cycles of 97 °C for 30 s and 59.7 °C for 1 min. Three independent samples of each genotype (WT and YHR+) were evaluated in duplicate at 3, 5 and 8 weeks of age. In addition, a calibrator sample was prepared by mixing equal amounts of RNA from all the samples. The data were analyzed with the ABI Prism SDS 2.2 software (Applied Biosystems, Foster City, CA) using the automatic threshold cycle (CT) setting and relative quantitation (2−ΔΔCT) method (Livak and Schmittgen, 2001). The CT value of the internal control (18S rRNA) was subtracted from the gene of interest to obtain the ΔCT value for each gene. The difference in ΔCT between the gene of interest and calibrator was defined as ΔΔCT and the relative quantity by 2−ΔΔCT. The fold-changes in YHR+ expression relative to WT at each age (Fig. 1) were determined by the ΔΔCT values obtained by subtracting the ΔCT value for WT from that for YHR+. The data were visualized using Java TreeView (Saldanha, 2004).
Fig. 1.


Fig. 1A. Gene expression changes in YHR+ transgenic mice. The expression of 95 genes was assayed by real-time RT-PCR using the ABI microfluidic cards. Data are expressed as fold change in expression levels of each gene at 3, 5 and 8 weeks of age in YHR+ mice compared to WT mice (n=3 for each age and genotype). Genes that showed a statistically significant decrease in expression are indicated in red and increase in expression in blue. The full names of the genes shown here with their GenBank accession numbers can be found in Supplementary Table 1. B. Pathway of testosterone biosynthesis showing the Proteins/Genes required for each step. Genes whose expression was down-regulated in 3 and 5 week old YHR+ mice compared to WT mice (data from Figs. 1A and 3) are shown in bold.
2.4. Western blot analysis
Testes were dissected and flash frozen in liquid nitrogen. Total protein lysates from testis of three independent WT and YHR+ mice at each age were prepared by homogenization in lysis buffer consisting of 50 mM Tris HCl, pH 7.8, 150 mM NaCl, 1% NP-40, 0.15% SDS, 1mM DTT, 2 mM EDTA, 50% protease inhibitor cocktail (Sigma Chemicals, St. Louis, MO), 4 mM sodium flouride, and 100 μM sodium vanadate followed by centrifugation at 13,000 × g for 30 min. The supernatant was collected and protein concentration determined by the Bradford assay (Bio-Rad Laboratories, Hercules CA).
Total protein (50 μg) was resolved on 10% SDS/polyacrylamide gels under denaturing conditions and transferred electrophoretically to Immobilon-P membrane (Millipore, Bedford, MA). The membranes were blocked with LI-COR Odyssey blocking buffer (LI-COR Biosciences, Lincoln, NE) diluted 1:1 with PBS for 1 h at room temperature followed by incubation with primary antibodies overnight at 4 °C. All primary antibodies were diluted 1:2500 in 1:1 Odyssey blocking buffer/PBS. Primary antibodies used were goat anti-actin (Santa Cruz Biotechnology, Santa Cruz, CA) as an internal control, along with one of the following: rabbit anti-cytochrome P450 side chain cleavage (P450scc) (Millipore, Bedford, MA) or rabbit anti-3β hydroxysteroid dehydrogenase 1 (3βHSD1) (provided by Dr. Anita Payne, Stanford University, CA). The membrane was washed four times with PBS/0.1% Tween 20 and then incubated for 1 h with secondary antibody (donkey anti-goat IgG conjugated with Alexa Fluor 680 (Invitrogen, Carlsbad, CA) and donkey anti-rabbit IgG conjugated with IRDye 800 (Rockland Immunochemicals, Gilbertsville, PA) diluted 1:10,000 in 1:1 Odyssey blocking buffer/PBS. The membrane was washed three times in PBS/0.1% Tween with a final wash in PBS. The membrane was scanned and the protein bands quantified with the Odyssey Infrared Imaging System. The actin band is detected at 700 nM and the steroidogenic enzymes at 800 nM.
2.5. Immunohistochemistry
Testes from 3 WT and 3 YHR+ mice at 3, 5 and 8 weeks of age were fixed in Bouin’s solution and embedded in paraffin. Serial sections (5 μm) of the testis were stained with hematoxylin and eosin or were used to perform immunohistochemistry with a 1:400 dilution of P450scc, 1:800 dilution of 3βHSD1, 1:1000 dilution of cytochrome P450 17α-hydroxylase (P450c17) (provided by Dr. Anita Payne, Stanford University, CA) and 1:75 dilution of 5α-reductase1 antibodies (provided by Dr. Bernard Robaire, McGill University, Canada). After incubation for 1 h at room temperature, sections were incubated with biotinylated secondary antibody for 10 min followed by incubation with Vectastain Elite ABC reagent (Vector Labs, Burlingame, CA). The antibody-antigen complexes were visualized with diaminobenzidine to produce brown deposits and sections were counterstained with hematoxylin.
2.6. Leydig cell quantification
Leydig cell number was determined by an adaptation of the method described by Eacker et al. (Eacker et al., 2008). Bouins fixed testes were cut in half and embedded in paraffin. 5μm serial sections were prepared and three nonadjacent sections that represented different regions of the testis were stained with 3βHSD1 as described above to unambiguously identify the Leydig cells. Five randomly chosen fields of defined area in each section were imaged using a 40 x objective. All 3βHSD1 positive cells were counted and classified as either fetal (cells with round nucleus present in distinct clusters), progenitor (spindle shaped) or adult (round) Leydig cells. Five animals at each age and genotype were used for the analysis. Leydig cell density was determined based on the number of cells in the defined area of the 5μm thick section. Total number of Leydig cells per testis was determined by multiplying the cell density by testis volume. Testis weight was used as an estimate of testis volume (mm3) because the density of the testis is approximately 1mg/ml (Mori and Christensen, 1980).
2.7. Statistical Analysis
Real time RT-PCR and Western data were normalized by logarithmic transformation before analysis. Data were analyzed by 2-way ANOVA and Bonferroni post-tests using the Prism software program (GraphPad Software, Inc., San Diego, CA, USA). All data are expressed as mean ± SEM.
3. Results
3.1. Developmental changes in gene expression in the postnatal testis of WT and YHR+ mice
In order to assess quantitative changes in the expression of a large number of genes during post-natal development of WT and YHR+ mice, gene expression microfluidic cards containing 95 gene targets and one endogenous control were used. The cards were designed to enable analysis of testis and ovary RNA. The genes included those for the steroidogenic enzymes, gonadotropin and steroid hormone receptors, cell cycle dependent proteins, signaling molecules, apoptotic genes and sperm specific proteins including those implicated in sperm motility. A list of these genes with their gene symbols is presented in Supplementary Table 1.
We analyzed the data for genes that were differentially expressed in YHR+ testis relative to WT testis and for genes whose expression was altered during postnatal development. We chose to examine expression at 3, 5 and 8 weeks of age because our previous studies had shown that the endocrine changes of increased testosterone and decreased LH and FSH occurred in YHR+ mice at the ages of 3 and 5 weeks (Meehan et al., 2005). At 3 and 5 weeks of age, testicular testosterone levels in YHR+ mice were 18 ± 2.9 and 69.9 ± 5.1ng/g testis compared to 1.5 ± 0.4 and 4.8 ± 0.9 ng/g testis in WT mice, respectively (Meehan et al., 2005; Meehan and Narayan, 2007). Genes whose expression was below the recommended lower limit (CT value greater than 34) were removed from the analysis (8 genes). A dendrogram of the fold change (positive or negative) in gene expression in YHR+ mice relative to WT mice at each age is shown in Figure 1A. The majority of genes showed less than 2-fold change in expression between WT and YHR+ mice at any age. Three genes, encoding steroidogenic enzymes P450c17 (Cyp17a1), 17β hydroxysteroid dehydrogenase3 (Hsd17b3) and steroid 5α-reductase1 (Srd5a1) (Fig. 1B), showed a statistically significant 2-fold or greater downregulation in 3 and 5 week old mice, while the only gene that was up-regulated was the insulin like growth factor binding protein 3 (Igfbp3).
The expression of a subset of genes was altered during postnatal development but unchanged between WT and YHR+ mice. These were germ cell specific genes that were expressed at low or undetectable levels at 3 weeks, significantly up-regulated in 5 week-old mice and remained unchanged at 8 weeks (Fig. 2). The exception was lactate dehydrogenase3 (Ldh3), which is also germ cell specific but was not significantly altered between 3 and 8 weeks of age.
Fig. 2.

Expression of germ cell-specific genes. RNA levels and relative quantity were determined as described for Figure 2. Data are expressed as mean of 3 animals per group. Catsper1, cation channel of sperm 1; Fhl5, five and a half LIM domains 5; Gapds, glyceraldehydes-3-phosphate dehydrogenase, spermatogenic; Ldh3, lactate dehydrogenase 3, sperm specific; Pgk2, phosphoglycerate kinase 2; Prm1, 2, protamine 1 and 2; Sacy, soluble adenylyl cyclase; Tnp1, 2, transition protein 1 and 2. Significant differences (P<0.05) were observed between 3 and 5 weeks of age for all genes, except Ldh3, in WT and YHR+ mice.
We further examined the developmental changes in the genes that were differentially expressed in YHR+ mice compared to WT mice (Fig. 3). IGFBP3 expressed in Sertoli and Leydig cells was significantly up-regulated at 3 and 5 weeks of age in YHR+ testis but not at 8 weeks of age. Its RNA levels decreased during pubertal development with lowest levels seen in adult mice of both genotypes. It was interesting that all the down-regulated genes were Leydig cell specific. Expression levels of P450c17 RNA in YHR+ but not WT mice increase significantly from 3 to 5 weeks of age. At 3 and 5 weeks of age, there is a significant reduction in P450c17 RNA levels compared to WT mice, but not in 8 week-old adult mice. Expression of 17β hydroxysteroid dehydrogenase3 (17βHSD3), which catalyzes the last step in testosterone biosynthesis (Fig. 1B), was significantly down-regulated in YHR+ mice compared to WT mice at 3 and 5 weeks. This gene (Hsd17b3) is expressed only in adult Leydig cells (O’Shaughnessy et al., 2002) and its expression is significantly up-regulated in 5 week-old WT mice consistent with the timing of adult Leydig cell differentiation (Mendis-Handagma and Ariyaratne, 2001). However, 17βHSD3 RNA levels remain low in 5 week-old YHR+ mice and do not increase until 8 weeks of age at which time their levels are still slightly lower than that seen in WT mice. One possible explanation for the down-regulation of 17βHSD3 RNA levels is that there is a decrease in the number of adult Leydig cells and a possible delay in their appearance in YHR+ testis. In contrast to the expression pattern of 17βHSD3 RNA, the mRNA levels of 5α-reductase1 in WT mice are highest before puberty and decrease in the adult mouse. The levels in YHR+ mice are significantly decreased at 3 and 5 weeks of age and do not vary during development. Srd5a1 is expressed in high levels in immature adult Leydig cells (Mendis-Handagma and Ariyaratne, 2001) again suggesting a decrease in the number of adult Leydig cells in YHR+ mice at 3 and 5 weeks of age.
Fig. 3.

Expression of genes altered in YHR+ mice during postnatal development. Relative quantity was determined by the ΔΔCT method and represents expression relative to a calibrator sample prepared by mixing equal amounts RNA from all the samples. Data are expressed as mean ± SEM of 3 animals for each group. The data were analyzed to (i) determine significant differences between WT and YHR+ samples at each age and these are indicated by * (*, P < 0.05) and (ii) determine significant differences between ages within a genotype indicated by the different letters above the bars (P < 0.05). Igfbp3, insulin like growth factor binding protein 3; Cyp17a1, cytochrome P450 17α-hydroxylase; Hsd17b3, 17β-hydroxysteroid dehydrogenase 3; Srd5a1, steroid 5α-reductase 1.
3.2. Alterations in Leydig cell number and differentiation in YHR+ mice
To further examine the prediction of decreased Leydig cell numbers in YHR+ mice, cell specific expression of the Leydig cell specific proteins, P450scc, 3βHSD1, P450c17 and 5α-reductase1 were examined by immunohistochemistry of testicular sections (Fig. 4). Examination of sections showed that the size of the Leydig cell clusters specifically stained with these antibodies was smaller in YHR+ mice, particularly at 5 weeks of age. This difference persisted at 8 weeks of age although it was less apparent. Specific 5α-reductase1 immunostaining of Leydig cells was not detected in 8 week old WT and YHR+ testis consistent with a drop in 5α-reductase enzyme activity in adult Leydig cells (Benton et al., 1995; Ariyaratne et al., 2000).
Fig. 4.
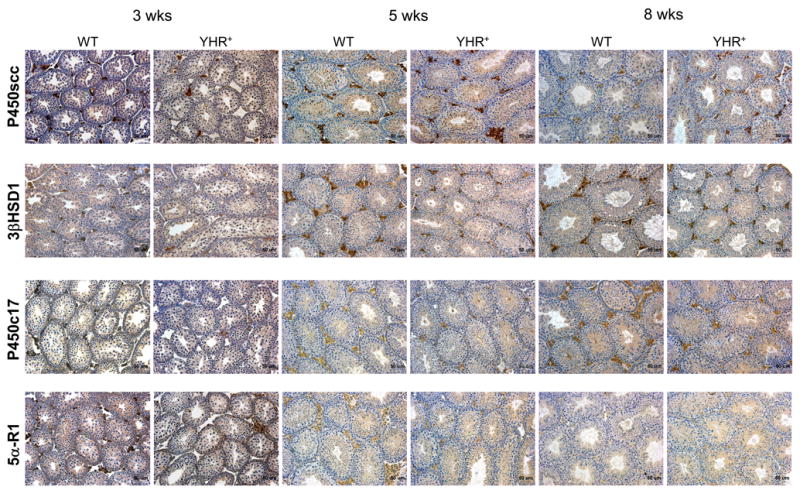
Immunohistochemical analysis of the steroidogenic enzymes in testis sections of WT and YHR+ mice at 3, 5 and 8 weeks of age. Sections from 3 mice at each age and genotype were analyzed. Representative photomicrographs show Leydig cell-specific staining, visualized by the brown deposits, for all the enzymes. P450scc, cytochrome P450 side chain cleavage; 3βHSD1, 3β hydroxysteroid dehydrogenase 1; P450c17, cytochrome P450 17α-hydroxylase; 5α-R1, steroid 5α-reductase 1.
To validate this qualitative decrease observed in the Leydig cell population in YHR+ mice, we performed a systematic histological analysis to estimate Leydig cell number as described in Materials and Methods. Fetal Leydig cells (FLC) were only detected at 3 weeks of age. The FLC density (cells/mm3) of WT mice was 3620 ± 259 compared to 7756 ± 2593 in YHR+ mice. Progenitor Leydig cell (PLC) density was not significantly different between WT and YHR+ mice except at 8 weeks of age (Fig. 5A). However, there was a significant decrease in PLC density in WT mice between 3 and 5 weeks of age and in YHR+ mice between 5 and 8 weeks of age. Adult Leydig cell (ALC) density on the other hand was significantly decreased in YHR+ mice compared to WT mice at 3 and 5 weeks of age but not at 8 weeks of age (Fig. 5B) consistent with the relative changes in 17βHSD3 RNA levels seen previously (Fig. 3). The testes of YHR+ mice are significantly smaller that WT mice at all ages (Fig. 5C) and these testes weights were used to calculate the total number of Leydig cells in the WT and YHR+ testis. As shown in Fig. 5D, the total number of Leydig cells is significantly decreased in YHR+ testis at all ages. Together, these data and the immunohistological data shown in Fig. 4 suggest that there is a delay in the differentiation of PLC to ALC and an overall decrease in the number of Leydig cells in the YHR+ testis.
Fig. 5.

Quantification of Leydig cell numbers. Cell density and total Leydig cell numbers were determined as described in Materials and Methods. Data are expressed as mean ± SEM of 5 animals for each group. Significant differences between genotypes are indicated by * (*, P <0.05; **, P< 0.01; ***, P < 0.001). Significant differences between ages within a genotype are indicated by the different letters above the bars (P < 0.05). PLC, progenitor Leydig cell; ALC, Adult Leydig cell; LC, Leydig cell.
3.3. Postnatal expression of Leydig cell specific genes
Since one of the major changes in YHR+ mice was an increase in testosterone levels at 3 and 5 weeks of age, we expected that the expression of steroidogenic enymes would be upregulated in YHR+ mice. The enzymes/genes in the testosterone biosynthetic pathway and their relative expression in YHR+ testis compared to WT are summarized in Fig. 1B. The first step in steroid biosynthesis is the transport of cholesterol from the outer to inner mitochondrial membrane by steroid acute regulatory protein (StAR). Although testicular expression of this gene (Star) was up-regulated during postnatal development in both WT and YHR+ mice (data not shown), it was unchanged between the genotypes (Fig. 1A and B). As Leydig cell numbers in YHR+ mice are significantly less than in WT mice, we wanted to determine Star expression levels in WT and YHR+ mice after correcting for Leydig cell number. The data shows that the StAR RNA levels per cell were unchanged with age or genotype (Fig 6). The mRNA levels for P450scc (Cyp11a1) and 3βHSD1 (Hsd3b1) also remain the same in WT and YHR+ mice after Leydig cell number correction. Expression of these RNA transcripts per Leydig cell appears to decrease with age although their expression levels before Leydig cell number correction remained constant during pubertal development (data not shown). Since LHR activation in the Leydig cells is the first step in the initiation of steroidogenesis, we examined its RNA expression during development. Because the primer designed for the microfluidic cards would detect both LHR and YHR, we performed a separate real time RT-PCR experiment for LHR (Lhcgr) wherein one of the RT-PCR primers was designed to hybridize to the signal sequence of LHR and the other in a sequence coding for the mature protein. This ensured that the primers would only amplify LHR as YHR lacks the signal sequence. The data (Fig. 6) showed that LHR mRNA levels, after correcting for Leydig cell numbers, are similar between WT and YHR+ mice.
Fig. 6.

Expression of genes required for Leydig cell steroidogenesis. Relative quantity was determined by real-time RT-PCR with the mircrofluidic cards as in Fig. 3, except that the values were normalized for Leydig cell numbers that had been determined for each age and genotype (Fig. 5). Expression of LHR was not determined with the microfluidic cards but with primers that would distinguish the endogenous gene for LHR (Lhcgr) from YHR and Rps2 was used as the internal control. Data are expressed as mean ± SEM of 3 animals for each group except for Lhcgr which included 4 animals/group. Data were analyzed as described for Fig. 3. Significant differences between ages within a genotype are indicated by the different letters (P < 0.05).
Protein expression of two steroidogenic enzymes was examined by Western blot analysis. Testis extracts prepared from 3, 5 and 8 week old mice and probed with antibody against P450scc showed a specific band with an apparent molecular weight of 44 kDa (Fig. 7A). Quantification of band intensity with β actin as loading control and corrected for Leydig cell numbers, indicated that protein levels were similar in WT and YHR+ mice from 3 to 8 week old WT testis. The levels of 3βHSD1 with an apparent molecular weight of 40 kDa were also unchanged during development and between genotypes (Fig. 7B).
Figure 7.

Western Blot analysis of P450scc and 3βHSD1 in WT and YHR+ mice at different ages. Testis extracts were resolved on a 10% SDS polyacrylamide gel, transferred to membrane and probed with antibodies against P450scc, 3βHSD1 or β actin (loading control). Fluorescently labeled secondary antibodies were utilized to detect proteins simultaneously. The blots were scanned and the densities of the bands were quantified. The intensities of P450scc (A) and 3βHSD1 (B) bands relative to β actin and normalized for Leydig cell numbers are shown at each age. A representative gel showing the bands for the protein of interest and βactin at the corresponding ages and genotype is shown above the graph. The data are expressed as mean ± SEM of 3 animals per group.
Discussion
In the present study, using a combination of gene expression and quantitative histological analyses, we demonstrate that premature activation of LHR impairs the development of adult Leydig cells in mice. The gene expression studies identified two patterns of changes (i) a subset of genes that were up-regulated during postnatal development but unchanged with genotype and (ii) genes whose levels were altered in YHR+ mice during development. Genes whose expression was unchanged with genotype, but up-regulated from 3 to 5 weeks of age were sperm specific genes expressed in meiotic spermatocytes, spermatids or during spermiogenesis. The exception was Ldh3, which was already present at high levels in 3 week-old mice. This is consistent with previous reports that demonstrated that Ldh3 expression is detected in pachytene spematocytes as early as postnatal day 16 (Thomas et al., 1990). The expression pattern of these genes is consistent with a spermatogenic wave of about 35 days in mice and our previous observation that spermatogenesis is not initiated earlier in YHR+ mice (Meehan et al., 2005).
Of those genes whose expression was altered in YHR+ mice, three genes encoding the steroidogenic enzymes, P450c17, 5α-reductase1 and 17β-HSD3, were down-regulated in YHR+ mice at 3 and 5 weeks of age, but not in adult mice, and the fourth gene encoding IGFBP3, was up-regulated. Although the YHR+ mRNA levels are lower for P450c17 and 5α-reductase1, the developmental profile of these genes is similar in WT and YHR+ mice. P450c17 mRNA levels increase at 5 weeks preceding the pubertal rise in testosterone levels in WT mice. In contrast, the mRNA levels for the testosterone metabolizing enzyme 5α-reductase1 are high at 3 and 5 weeks and decline at 8 weeks as testosterone levels increase. The decrease in the levels of P450c17 and 5α-reductase1 mRNA levels in YHR+ mice occurs at 3 and 5 weeks of age when testosterone levels in these animals are elevated compared to WT mice (Meehan et al., 2005). Previous studies have demonstrated that testosterone negatively regulates the mRNA levels of P450c17 and 5α-reductase1 (Hales et al., 1987; Burgos-Trinidad et al., 1997; Pratis et al., 2003). This difference is not seen at 8 weeks of age since testosterone levels are similar in WT and YHR+ mice and any negative regulation would likely be the same in both genotypes. In addition, the low levels of 5α-reductase1 in 3 and 5 week old YHR+ mice may be due to the decreased levels of FSH measured in these mice (Meehan et al., 2005) and consistent with previous studies that demonstrated that FSH positively regulates 5α-reductase1 mRNA (Pratis et al., 2003). It is possible that the down-regulation of 5α-reductase1, which metabolizes testosterone to 5α-dihydrotestosterone, may in turn contribute to the elevated testosterone levels in YHR+ mice. The third down-regulated gene, Hsd17b3, encodes the enzyme required for the last step in testosterone biosynthesis, the conversion of androstenedione to testosterone (Fig. 1B). This gene is expressed predominantly in adult Leydig cells (O’Shaughnessy et al., 2002), and its temporal expression in WT mice is consistent with the timing of adult Leydig cell differentiation that has been previously reported (Mendis-Handagma and Ariyaratne, 2001; O’Shaughnessy et al., 2002). The temporal expression of Hsd17b3 in YHR+ mice however is different and a significant increase in the mRNA levels does not occur till 8 weeks of age suggesting a delay in adult Leydig cell development. However, the possibility that testosterone also negatively regulates the expression of 17βHSD3 cannot be excluded.
It was surprising that the RNA levels of neither StAR nor P450scc, involved in the rate limiting steps of testosterone biosynthesis, were up-regulated in YHR+ mice. The RNA and protein levels for P450scc were maximal at 3 weeks suggesting that the enzyme and cholesterol levels are sufficient to promote steroidogenesis in prepubertal YHR+ mice. The levels of 3βHSD1 mRNA and protein were unchanged between WT and YHR+ mice, in agreement with previous studies indicating that expression of this gene is independent of LH (Baker et al., 2003; Zhang et al., 2004).
During testicular development, there are two morphologically and functionally distinct populations of Leydig cells (Habert et al., 2001). The first are the fetal Leydig cells (FLC) that differentiate in fetal life, are present at birth and decline postnatally. The second are the adult Leydig cells with steroidogenic potential that develop from mesenchymal precursor cells through several steps of proliferation and differentiation (Mendis-Handagma and Ariyaratne, 2001; Ge et al., 2005; Ge and Hardy, 2007). In rodents, the spindle shaped PLC arise from the differentiation of precursor cells at about 10–13 days. The PLCs are proliferative and express the steroidogenic enzymes, P450scc, 3βHSD1 and P450c17 (Ariyaratne et al., 2000; Ge et al., 2005). At around day 21, these cells begin differentiating into round immature Leydig cells (ILC) and these are the predominant cell type between 28–56 days postnatally. ILCs express high levels of 5α-reductase1 and the predominant steroid is 5α-reduced androgen. By postnatal day 56, ILCs undergo a final transition to ALCs, express high levels of 17βHSD3, and testosterone is the predominant androgen that is secreted by the testis. LH is critical for the establishment of the adult Leydig cell population and androgens are required for the differentiation of progenitor cells (Stocco et al., 1990; Murphy et al., 1994; Benton et al., 1995).
Immunohistochemical analysis of testis sections with several Leydig cell specific steroidogenic enzymes reveals that there is an apparent decrease in the number of immunopositive cells in YHR+ mice. Quantitative analysis of PLCs and ALCs in WT and YHR+ testis showed a significant difference in the ALC but not PLC density between genotypes at 3 and 5 weeks of age. Together, these studies indicate that differentiation of PLCs to ALCs is impaired in YHR+ testis resulting in an overall decrease in the Leydig cell population YHR+ mice.
It is interesting that the only gene that was significantly up-regulated in our initial gene expression screen was Igfbp3 that is produced by the prepubertal Sertoli cell (Smith et al., 1992; Rappaport and Smith, 1995) as well as Leydig cells (Lin et al., 1993) and modulates the biological activity of testicular insulin-like growth factor1 (IGF-1). Expression of IGFBP3 mRNA is negatively regulated by FSH (Smith et al., 1992; Rappaport and Smith, 1995). Previous studies have shown that IGF-1 regulates the proliferation and differentiation of Leydig cell precursors (Wang and Hardy, 2004). IGF-1 and LH act in concert to stimulate steroidogenic enzyme gene expression (Wang et al., 2003), and IGFBP3 can neutralize the effects of IGF-1 on Leydig cell-induced steroidogenesis (Lin et al., 1993) and Leydig cell growth and proliferation. Current evidence suggests that the role of FSH on Leydig cell development is mediated through Sertoli cell secreted proteins. Two Sertoli cell factors, desert hedgehog and platelet derived growth factor A have been implicated in Leydig cell development (Clark et al., 2000; Gnessi et al., 2000). The decreased levels of FSH in YHR+ mice may, in addition to increasing IGFBP3 mRNA levels, also affect expression of trophic factors required for Leydig cell development.
Androgens produced by the FLCs in the neonatal testis may have an effect on adult Leydig cell differentiation and both PLCs and ILCs have androgen receptors (Mendis-Handagma and Ariyaratne, 2001). Studies suggest that androgens are stimulatory for some steps in Leydig cell development and inhibitory to others. A previous report (Gaytan et al., 1994) suggested that rats treated with hCG on days 2–4 showed an increase in the size and number of FLCs in 5 day old rats but a long term decrease in the number of ALCs. On the other hand, administration of hCG on days 20–22 showed similar short term and long term effects and resulted in an increase in ALCs. FLCs express functional LHR and can respond to elevated LH or hCG with increased testosterone and cell proliferation (Zhang et al., 1994; O’Shaughnessy et al., 1998). In agreement with these observations, a recent study in hCG overexpressing transgenic mice found that Leydig cell adenomas appeared only in the fetal population and not in the adult cells (Ahtiainen et al., 2005). A similar situation may occur in YHR+ mice. The inhibin α-subunit promoter that controls YHR expression, is active in FLCs (Majdic et al., 1997), and therefore, it is likely that YHR is active in these cells. Our preliminary data suggests that testosterone levels are elevated in 10 and 14 day-old mice (M. Coonce and P. Narayan, unpublished observations). Whether these high levels of testosterone have a direct effect on the proliferation of FLCs or differentiation of PLCs to ALCs in YHR+ mice remains to be determined.
In summary, we present evidence that elevated testosterone levels during early postnatal development in the mouse impairs adult Leydig cell development and alters the expression of some Leydig cell-specific genes required for steroidogenesis. We posit that testosterone exerts its effects both directly on Leydig cells and indirectly by lowering the serum levels of LH and FSH and altering the expression of factors regulated by these hormones and important for Leydig cell maturation.
Supplementary Material
Acknowledgments
We thank Roger Nilsen at the University of Georgia Functional Genomics Resource Facility for RNA analysis, Maureen Doran for assistance with histology, Drs. Anita Payne and Bernard Robaire for providing us with antibodies and Dr. Buffy Ellsworth for critical reading of the manuscript. This work was supported by NIH grant HD044119 (PN).
Footnotes
Publisher's Disclaimer: This is a PDF file of an unedited manuscript that has been accepted for publication. As a service to our customers we are providing this early version of the manuscript. The manuscript will undergo copyediting, typesetting, and review of the resulting proof before it is published in its final citable form. Please note that during the production process errors may be discovered which could affect the content, and all legal disclaimers that apply to the journal pertain.
References
- Ahtiainen P, Rulli SB, Shariatmadari R, Pelliniemi LJ, Toppari J, Poutanen M, Huhtaniemi IT. Fetal but not adult Leydig cells are susceptible to adenoma formation in response to persistently high hCG level: a study on hCG overexpressing transgenic mice. Oncogene. 2005;24:7301–7309. doi: 10.1038/sj.onc.1208893. [DOI] [PubMed] [Google Scholar]
- Ariyaratne HBS, Mendis-Handagama SMLC, Hales DB, Mason JI. Studies on the onset of Leydig precursor cell differentiation in the prepubertal rat testis. Biol Reprod. 2000;63:165–171. doi: 10.1095/biolreprod63.1.165. [DOI] [PubMed] [Google Scholar]
- Ascoli M, Fanelli F, Segaloff DL. The lutropin/choriogonadotropin receptor, a 2002 perspective. Endocr Rev. 2002;23:141–174. doi: 10.1210/edrv.23.2.0462. [DOI] [PubMed] [Google Scholar]
- Baker PJ, Johnston H, Abel M, Charlton HM, O’Shaughnessy PJ. Differentiation of adult-type Leydig cells occurs in gonadotrophin-deficient mice. Reproductive Biology and Endocrinology. 2003;1:4. doi: 10.1186/1477-7827-1-4. [DOI] [PMC free article] [PubMed] [Google Scholar]
- Benton L, Shan LX, Hardy MP. Differentiation of adult Leydig cells. J Steroid Biochem Molec Biol. 1995;53:61–68. doi: 10.1016/0960-0760(95)00022-r. [DOI] [PubMed] [Google Scholar]
- Burgos-Trinidad M, Youngblood GL, Marato MR, Scheller A, Robins DM, Payne AH. Repression of cAMP-induced expressioni of the mouse P450 17a-hydroxylase/C17-20 lyase gene (Cyp17) by androgens. Mol Endocrinol. 1997;11:87–96. doi: 10.1210/mend.11.1.9871. [DOI] [PubMed] [Google Scholar]
- Clark AM, Garland KK, Russell LD. Desert hedgehog (Dhh) gene Is required in the mouse testis for formation of adult-type Leydig cells and normal development of peritubular cells and seminiferous tubules. Biol Reprod. 2000;63:1825–1838. doi: 10.1095/biolreprod63.6.1825. [DOI] [PubMed] [Google Scholar]
- Eacker SM, Agrawal N, Qian K, Dichek HL, Gong EY, Lee K, Braun RE. Hormonal regulation of testicular steroid and cholesterol homeostasis. Mol Endocrinol. 2008;22:623–635. doi: 10.1210/me.2006-0534. [DOI] [PMC free article] [PubMed] [Google Scholar]
- Fanelli F, Themmen APN, Puett D. Lutropin receptor function: insights from natural, engineered and computer-simulated mutations. IUBMB Life. 2001;51:149–155. doi: 10.1080/152165401753544214. [DOI] [PubMed] [Google Scholar]
- Gaytan F, Pinilla L, Romero JL, Aguilar E. Differential effects of the administration of human chorionic gonadotropin to postnatal rats. J Endocrinol. 1994;142:527–534. doi: 10.1677/joe.0.1420527. [DOI] [PubMed] [Google Scholar]
- Ge R, Hardy MP. Regulation of Leydig cells during pubertal development. In: Payne AH, Hardy MP, editors. The Leydig cell in health and disease. Humana Press; Totawa, NJ: 2007. pp. 55–70. [Google Scholar]
- Ge RS, Dong Q, Sottas CM, Chen H, Zirkin BR, Hardy MP. Gene expression in rat Leydig cells during development from the progenitor to adult stage: a cluster analysis. Biol Reprod. 2005;72:1405–1415. doi: 10.1095/biolreprod.104.037499. [DOI] [PubMed] [Google Scholar]
- Gnessi L, Basciani S, Mariani S, Arizzi M, Spera G, Wang C, Bondjers C, Karlsson L, Betsholtz C. Leydig Cell Loss and Spermatogenic Arrest in Platelet-derived Growth Factor (PDGF)-A-deficient Mice. J Cell Biol. 2000;149:1019–1026. doi: 10.1083/jcb.149.5.1019. [DOI] [PMC free article] [PubMed] [Google Scholar]
- Habert R, Lejeune H, Saez JM. Origin, differentiation and regulation of fetal and adult Leydig cells. Mol Cell Endocrinol. 2001;179:47–74. doi: 10.1016/s0303-7207(01)00461-0. [DOI] [PubMed] [Google Scholar]
- Hales DB, Sha L, Payne AH. Testosterone inhibits cAMP-induced de novo synthesis of Leydig cell cytochrome P4 5017a by an androgen receptor-mediated mechanism. J Biol Chem. 1987;262:11200–11206. [PubMed] [Google Scholar]
- Hearn MT, Gomme PT. Molecular architecture and biorecognition process of the cysteine knot protein superfamily: part I. The glycoprotein hormones. J Mol Recog. 2000;13:223–278. doi: 10.1002/1099-1352(200009/10)13:5<223::AID-JMR501>3.0.CO;2-L. [DOI] [PubMed] [Google Scholar]
- Hirakawa T, Galet C, Ascoli M. MA-10 cells transfected with the human lutropin/choriogonadotropin receptor (hLHR): a novel experimental paradigm to study the functional properties of the hLHR. Endocrinology. 2002;143:1026–1035. doi: 10.1210/endo.143.3.8702. [DOI] [PubMed] [Google Scholar]
- Lei ZM, Mishra S, Zou W, Xu B, Foltz M, Li X, Rao CV. Targeted disruption of luteinizing hormone/human chorionic gonadotropin receptor gene. Mol Endocrinol. 2001;15:184–200. doi: 10.1210/mend.15.1.0586. [DOI] [PubMed] [Google Scholar]
- Lei ZM, Mishra S, Ponnuru P, Li X, Yang ZW, Rao CV. Testicular phenotype in luteinizing hormone receptor knockout animals and the effect of testosterone replacement therapy. Biol Reprod. 2004;71:1605–1631. doi: 10.1095/biolreprod.104.031161. [DOI] [PubMed] [Google Scholar]
- Lin T, Wang D, Nagpal ML, Shimasaki S, Ling N. Expression and regulation of insulin-like growth factor-binding protein- 1, -2, -3, and -4 messenger ribonucleic acids in purified rat Leydig cells and their biological effects. Endocrinology. 1993;132:1898–1904. doi: 10.1210/endo.132.5.7682935. [DOI] [PubMed] [Google Scholar]
- Livak KJ, Schmittgen TD. Analysis of relative gene expression data using real-time quantitative PCR and the 2−••CT method. Methods. 2001;25:402–408. doi: 10.1006/meth.2001.1262. [DOI] [PubMed] [Google Scholar]
- Ma X, Dong Y, Matzuk MM, Kumar TR. Targeted disruption of luteinizing hormone beta-subunit leads to hypogonadism, defects in gonadal steroidogenesis, and infertility. Proc Natl Acad Sci USA. 2004;101:17294–17299. doi: 10.1073/pnas.0404743101. [DOI] [PMC free article] [PubMed] [Google Scholar]
- Majdic G, McNeilly AS, Sharpe RM, Evans LR, Groome NP, Saunders PT. Testicular expression of inhibin and activin subunits and follistatin in the rat and human fetus and neonate and during postnatal development in the rat. Endocrinology. 1997;138 doi: 10.1210/endo.138.5.5135. [DOI] [PubMed] [Google Scholar]
- Meehan TP, Harmon BG, Overcast ME, Yu KK, Camper SA, Puett D, Narayan P. Gonadal defects and hormonal alterations in transgenic mice expressing a single chain human chorionic gonadotropin-lutropin receptor complex. J Mol Endocrinol. 2005;34:489–503. doi: 10.1677/jme.1.01669. [DOI] [PubMed] [Google Scholar]
- Meehan TP, Narayan P. Constitutively active luteinizing hormone receptors: consequences of in vivo expression. Mol Cell Endocrinol. 2007:260–262. 294–300. doi: 10.1016/j.mce.2006.03.045. [DOI] [PMC free article] [PubMed] [Google Scholar]
- Mendis-Handagma SMLC, Ariyaratne HBS. Differentiation of the adult leydig cell population in the postnatal testis. Biol Reprod. 2001;65:660–671. doi: 10.1095/biolreprod65.3.660. [DOI] [PubMed] [Google Scholar]
- Mori H, Christensen K. Morphometric analysis of Leydig cells in the normal rat testis. J Cell Biol. 1980;84:340–354. doi: 10.1083/jcb.84.2.340. [DOI] [PMC free article] [PubMed] [Google Scholar]
- Murphy L, Jeffcoate IA, O’Shaughnessy PJ. Abnormal Leydig cell development at puberty in androgen-resistant Tfm mouse. Endocrinology. 1994;135:1372–1377. doi: 10.1210/endo.135.4.7925099. [DOI] [PubMed] [Google Scholar]
- O’Shaughnessy PJ, Baker P, Sohnius U, Haavisto AM, Charlton HM, Huhtaniemi I. Fetal Development of Leydig Cell Activity in the Mouse Is Independent of Pituitary Gonadotroph Function. Endocrinology. 1998;139:1141–1146. doi: 10.1210/endo.139.3.5788. [DOI] [PubMed] [Google Scholar]
- O’Shaughnessy PJ, Willerton L, Baker PJ. Changes in Leydig cell gene expression during development in the mouse. Biol Reprod. 2002;66:966–975. doi: 10.1095/biolreprod66.4.966. [DOI] [PubMed] [Google Scholar]
- Pratis K, O’Donnell L, Ooi GT, Stanton PG, McLachlan RI. Differential regultion of rat testicular 5a-reductase type 1 and 2 isoforms by testosterone and FSH. J Endocrinol. 2003;176:393–403. doi: 10.1677/joe.0.1760393. [DOI] [PubMed] [Google Scholar]
- Rappaport MS, Smith EP. Insulin-like growth factor (IGF) binding protein 3 in the rat testis: follicle stimulating hormone dependence on mRNA expression and inhibition of IGF-1 action on cultuted Sertoli cells. Biol Reprod. 1995;52:419–425. doi: 10.1095/biolreprod52.2.419. [DOI] [PubMed] [Google Scholar]
- Saldanha AJ. Java Treeview-extensible visualization of microarray data. Bioinformatics. 2004;20:3246–3248. doi: 10.1093/bioinformatics/bth349. [DOI] [PubMed] [Google Scholar]
- Shiraishi K, Ascoli M. Lutropin/Choriogonadotropin stimulate the proliferation of primary cultures of rat Leydig cells through a pathway that involves activation of the extracellularly regulated kinase 1/2 cascade. Endocrinology. 2007;148:3214–3225. doi: 10.1210/en.2007-0160. [DOI] [PMC free article] [PubMed] [Google Scholar]
- Smith EP, Cheung PT, Ferguson A, Chernausek SD. Mechanisms of Sertoli cell insulin-like growth factor (IGF)-binding protein-3 regulation by IGF-1 and adenosine 3′5′-monophosphate. Endocrinology. 1992;131:2733–2741. doi: 10.1210/endo.131.6.1280204. [DOI] [PubMed] [Google Scholar]
- Stocco DM, Teerds KJ, Noort MV, Rommerts FFG. Effects of hypophysectomy and human chorionic gonadotropin on Leydig cell function in mature rats. J Endocrinol. 1990;126:367–375. doi: 10.1677/joe.0.1260367. [DOI] [PubMed] [Google Scholar]
- Themmen APN, Huhtaniemi IT. Mutations of gonadotropins and gonadotropin receptors: elucidating the physiology and pathophysiology of pituitary-gonadal function. Endocr Rev. 2000;21:551–583. doi: 10.1210/edrv.21.5.0409. [DOI] [PubMed] [Google Scholar]
- Themmen APN. An update of the pathophysiology of human gonadotrophin subunit and receptor gene mutations and polymorphisms. Reproduction. 2005;130:263–274. doi: 10.1530/rep.1.00663. [DOI] [PubMed] [Google Scholar]
- Thomas K, Del Mazo J, Eversole P, Bellve A, Hiraoka Y, Li SS, Simon M. Developmental regulation of expression of the lactate dehydrogenase (LDH) multigene family during mouse spermatogenesis. Development. 1990;109:483–493. doi: 10.1242/dev.109.2.483. [DOI] [PubMed] [Google Scholar]
- Wang G, O’Shaughnessy PJ, Chubb C, Robaire B, Hardy MP. Effects of insulin-like growth factor 1 on steroidogenic enzyme expression levels in mouse Leydig cells. Endocrinology. 2003;144:5058–5064. doi: 10.1210/en.2003-0563. [DOI] [PubMed] [Google Scholar]
- Wang G, Hardy MP. Development of Leydig cells in the insulin-like growth factor-1 (IGF-1) knockout mouse: effects of IGF-1 replacement and gonadotropin stimulation. Biol Reprod. 2004;70:632–639. doi: 10.1095/biolreprod.103.022590. [DOI] [PubMed] [Google Scholar]
- Wu C, Narayan P, Puett D. Protein engineering of a novel constitutively active hormone-receptor complex. J Biol Chem. 1996;271:31638–31642. doi: 10.1074/jbc.271.49.31638. [DOI] [PubMed] [Google Scholar]
- Zhang FP, Poutanen M, Wilbertz J, Huhtaniemi I. Normal prenatal but arrested postnatal sexual development of luteinizing hormone receptor knockout (LuRKO) mice. Mol Endocrinol. 2001;15:172–183. doi: 10.1210/mend.15.1.0582. [DOI] [PubMed] [Google Scholar]
- Zhang FP, Pakarainen T, Zhu F, Poutanen M, Huhtaniemi I. Molecular characterization of postnatal development of testicular steroidogenesis in luteinizing hormone receptor knockout mice. Endocrinology. 2004;145:1453–1463. doi: 10.1210/en.2003-1049. [DOI] [PubMed] [Google Scholar]
- Zhang FP, Hamalainen T, Kaipia A, Pakarinen P, Huhtaniemi I. Ontogeny of luteinizing hormone reeptor gene expression in the rat testis. Endocrinology. 1994;134:2206–2213. doi: 10.1210/endo.134.5.8156923. [DOI] [PubMed] [Google Scholar]
Associated Data
This section collects any data citations, data availability statements, or supplementary materials included in this article.