Abstract
There are currently no antiviral drugs approved for the highly lethal Biosafety Level Four pathogens Nipah and Hendra virus. A number of researchers are developing surrogate assays amenable to Biosafety Level Two biocontainment but ultimately, the development of a High Throughput Screening method for directly quantifying these viruses in a Biosafety Level Four environment will be critical for final evaluation of antiviral drugs identified in surrogate assays, in addition to reducing the time required for effective antiviral drug development. By adapting an existing immunoplaque assay and using enzyme linked immunodetection in a microtitre plate format, the current experiments describe a simple two step assay protocol involving an overnight virus inoculation of Vero cell monolayers (with or without antiviral drug treatment) at Biosafety Level Four, followed by cell fixation and virus inactivation enabling removal of plates from the Biosafety Level Four laboratory and a subsequent immunodetection assay using a chemiluminescent Horse Radish Peroxidase substrate to be performed at Biosafety Level Two. The analytical sensitivity (limit of detection) of this assay is 100 Tissue Culture Infectious Dose50/ml of either Nipah or Hendra virus. In addition this assay enables linear quantitation of virus over three orders of magnitude and is unaffected by Dimethyl Sulfoxide concentrations of 1% or less. Intra-assay coefficients of variation are acceptable (less than 20%) when detecting a minimum of 1,000 Tissue Culture Infectious Dose50/ml of either virus although inter-assay variation is considerably greater. By an assessment of efficacies of the broad spectrum antiviral Ribavirin and an experimental fusion inhibitory peptide, this assay reveals a good correlation with previously published fluorescent immunodetection assays. The current experiments describe for the first time, a High Throughput Screening method amenable for direct assessment of live henipavirus antiviral drug activity.
Keywords: Paramyxovirus, Hendra virus, Nipah virus, Henipavirus, High Throughput Screening, Monolayer Assay, Immunoassay
1. Introduction
The Paramyxoviridae include some of the historically important and ubiquitous disease causing viruses of humans and animals, including one of the most infectious viruses known (measles virus) (Fields et al., 2007). The Paramyxoviridae are enveloped viruses with a linear non-segmented, negative sense RNA genome of approximately 15.5kb (Nagai, 1999). They are grouped taxonomically in the order Mononegavirales, in which genes are arranged in a highly conserved order (Takeda et al., 2006; Wang et al., 2001). The family Paramyxoviridae is further classified into two subfamilies Paramyxovirinae and Pneumovirinae (Fields et al., 2007) which includes a number of thoroughly studied human and animal pathogens in addition to recently emerged agents (Nagai, 1999). Two of the recently emerged paramyxoviruses are Hendra (HeV) and Nipah (NiV) virus (Wang et al., 2001).
Overall, many of the features of the genomes of HeV and NiV are related most closely to those of the Respirovirus and Morbillivirus genera, such as gene order, conserved intergenic, transcriptional initiation and transcriptional termination sequences (Harcourt et al., 2000). However, there are several features that make HeV and NiV unique in the subfamily Paramyxovirinae (Wang et al., 2001), such as extremely large genomes (>18,200 nt) (Bellini et al., 2005; Harcourt et al., 2000), an unusually broad host range (Harcourt et al., 2000; Murray et al., 1995) and being serologically distinct from all other Paramyxoviruses (Chua et al., 1999). Thus, NiV and HeV are classified into a new genus of the Paramyxovirinae called Henipavirus (Wang et al., 2001).
In contrast to other Paramyxoviruses studied thus far, the Henipaviruses are capable of zoonotic infections in a broad number of species resulting in fatalities in a variety of animal species including humans (Eaton et al., 2006). HeV first emerged in Australia in September 1994 resulting in the deaths of 14 horses and 2 humans in close contact with the infected horses (Murray et al., 1995). NiV was isolated in March 1999 and subsequently identified as the etiological agent responsible for an outbreak of fatal viral encephalitis in Malaysia and Singapore resulting in 109 human fatalities and the slaughter of more than a million pigs (Chua, 2003; Harcourt et al., 2000).
There are currently no therapeutics or vaccines available to treat or prevent NiV and HeV infections (Halpin and Mungall, 2007). A limited non-randomised trial of ribavarin during the initial NiV outbreak in Malaysia showed ribavarin therapy was able to reduce mortality of acute NiV encephalitis (Chong et al., 2001). While this study reported no serious side effects, ribavarin has been associated with a range of side effects primarily related to hemolytic anemia (De Franceschi et al., 2000). This may result in worsening of cardiac disease that has led to fatal and nonfatal myocardial infarctions (Shakil et al., 2002) while significant teratogenic and/or embryocidal effects have also been indicated for ribavirin (Chutaputti, 2000). However, a recent study showed that the 5 ethyl analogue of ribavarin but not ribavarin was able to prevent mortality in five of six animals in a hamster model of NiV infection (Georges-Courbot et al., 2006) suggesting that other replication inhibitors may be effective against Henipaviruses. The lack of effective therapeutic modalities for Henipaviruses, their classification as biological safety level-4 (BSL4) pathogens, and their inclusion as National Institute of Allergy and Infectious Diseases (NIAID) Category C priority pathogens make novel antiviral drug development a high priority.
The current tests available commercially to detect Nipah and Hendra virus infections include virus isolation, immunohistochemistry (performed on formalin fixed tissues), electron microscopy, polymerase chain reaction and sequencing, serum neutralization tests and ELISA (Crameri et al., 2002; Daniels et al., 2001). Recently, a multicycle pseudotyped virus replication assay was described that detects Hendra virus antibodies, as well as other antiviral compounds that target the viral entry steps, and is amenable to High Throughput Screening (HTS) (Porotto et al., 2007). This assay can be carried out entirely in BSL2 conditions, however it targets only entry inhibitors and requires validation using live viruses.
While many of these techniques are important for specific identification and characterization of virus infections, and for antiviral drug development, they have not yet been applied to High Throughput Screening (HTS), essential for the rapid identification of novel antiviral drugs. The current data details a new HTS method, utilising a modification of a previously reported cell monolayer based immune-plaque assay (Crameri et al., 2002) enabling rapid quantitation of Nipah and Hendra virus infection and the semi-automated evaluation of large libraries of antiviral compounds.
2. Materials and Methods
2.1 Virus and cells
African Green monkey (Vero) cells were grown in Eagle’s Minimal Essential Medium containing Earle's salts (EMEM), antibiotics (100 U/ml Penicillin, 100 µg/ml Streptomycin and 500 µg/ml Fungizone) and 10% fetal calf serum, designated EMEM-10. HeV was isolated in Vero cells from the lung of a horse infected in the Brisbane outbreak in October 1994 (9) and was passaged five times in Vero cells followed by triple plaque purification and a further five passages in Vero cells as described previously (Hyatt and Selleck, 1996). NiV was isolated in Vero cells from the brain of a human fatally infected in the 1998–99 Malaysian outbreak and was passaged three times in Vero cells then double plaque purified and passaged a further three times in Vero cells as described previously (Shiell et al., 2003). HeV and NiV stock titers were adjusted to 1×10⁶ TCID50/ml.
2.2 Hendra and Nipah viral infection of cells
Vero cells were seeded at a density of 2×10⁴ into individual wells of 96-well microtitre plates and incubated at 37 °C and 5% CO2 overnight in 100 µl EMEM-10. Under BSL4 conditions, medium was removed from the plates and half-log dilutions (105-101 TCID50/ml) of virus in EMEM-10 were added to replicate wells of Vero cells in volumes of 100 µl and incubated overnight at 37 °C and 5% CO2. The culture medium was then discarded, plates were immersed in ice-cold absolute methanol, enclosed in heat sealed plastic bags and the bag surface sterilized with lysol during removal from the BSL4 laboratory. The Australian Animal Health Laboratory has rigorous microsecurity requirements ensuring all materials from BSL3 and BSL4 laboratories are thoroughly inactivated prior to removal. Previous experiments within this laboratory have shown that submersion in ice-cold methanol for 10 minutes reduces the infectious titer of NiV and HeV by more than six logs (data not shown). Methanol-fixed plates were air dried at room temperature for a minimum of 30 minutes prior to immunolabeling. To evaluate the effect of plate storage at 4°C on assay sensitivity and specificity, a number of methanol fixed, air dried plates were sealed and stored at 4°C (for 7 days) prior to immunolabeling. To evaluate the reproducibility of virus inhibition, the broad spectrum antiviral Ribavirin and an experimental inhibitory peptide derived from the F protein of human parainfluenza virus type 3 (HPIV-3) (Porotto et al., 2007; Porotto et al., 2006) were used as positive controls for NiV and HeV inhibition, with the associated scrambled peptide acting as a negative control.
2.3 Immunolabeling assays for viral antigen
Viral protein expressed by infected cells was quantified using a number of immunoassay modifications all utilising a primary anti-NiV antibody (rabbit polyclonal anti-nucleoprotein (N), complements of Brian Shiell). Three different secondary antibody assays were evaluated: one using a direct fluorescent conjugate, the others standard horseradish peroxidase (HRP) and alkaline phosphatase (AP) conjugates with various substrate reactions (Table 1). A chemiluminescent substrate system was compared for each of the latter conjugates in addition to a standard ELISA substrate for HRP (Table 1). Briefly, all plates were washed 3 times with Phosphate Buffered Saline containing 0.05% Tween-20 (PBS-T). All plates were protein blocked with 100ul of 2% skim milk in PBS-T and incubated at 37°C for 30 minutes. After protein blocking, plates were washed 3 times with PBS-T, followed by incubation with 100ul anti-NiV antibody diluted 1:1000 in PBS-T containing 2% skim milk for 30 minutes at 37°C and then washed 3 times with PBS-T. HRP plates were incubated with 1% H2O2 (Sigma) for 15 minutes at room temperature then washed with PBS-T a further 3 times.
Table 1.
Summary of immunoassay combinations evaluated.
| Assay Format | ||||
|---|---|---|---|---|
| AP-CL | HRP-CL | HRP-TMB | FL | |
| Protein block | 2% skim milk | 2% skim milk | 2% skim milk | 2% skim milk |
| 1° antisera | α-NiV N | α-NiV N | α-NiV N | α-NiV N |
| Enzyme block | - | 1% H2O2 | 1% H2O2 | - |
| 2° antisera conjugate | alkaline phosphatase1 | horse radish peroxidase3 | horse radish peroxidase3 | Alexa-fluor 4881 |
| Substrate | CDP-Star2 | CPS-33 | TMB3 | - |
Invitrogen,
Applied Biosystems,
Sigma.
The three secondary antibodies used were: i) anti-rabbit conjugated AP (Invitrogen, Carlsbad, USA) diluted 1:1000, ii) anti-rabbit conjugated HRP (Sigma) diluted 1:2000, or iii) anti-rabbit conjugated Alexa-fluor 488 (Invitrogen) diluted 1:1000 and containing a 1:500 dilution of 4',6-diamidino-2-phenylindole (DAPI, ICN Biomedicals). All conjugates were diluted in PBS-T containing 2% skim milk, 100ul added to each well and plates incubated at 37°C for 30 minutes then washed 3 times with PBS-T. For detection, 100ul of Chemiluminescent Peroxidase Substrate-3 (CPS-3, Sigma) or 100ul of 3,3’,5,5’-Tetramethylbenzidine (TMB, Sigma) was added to the HRP labeled plates while 100ul of CDP-Star (Applied Biosystems, Foster City, USA) was added to AP labeled plates. Both of the chemiluminescent substrates were diluted 1:10 in chemiluminescent assay buffer (20mM Tris-HCl, 1mM MgCl2, pH = 9) prior to addition. 100ul of PBS-T was added to each well of the fluorescent assay (FL) plates to prevent the monolayer drying out. TMB plates were developed at room temperature for 10 minutes then 100ul of 0.18M H2SO4 was added and the absorbance at 450nm (A450nm)was read in a conventional microplate reader. Chemiluminescent plates were incubated at room temperature for 15 minutes, then read using a Luminoskan Ascent luminometer (Thermo Fisher Scientific, Waltham, USA) using 100mSec integration per well.
Immunofluorescence was visualized using an Olympus IX71 inverted microscope (Olympus Australia, Mt. Waverley, Australia) coupled to an Olympus DP70 high resolution colour camera. All images were obtained at an original magnification of x40 and images were imported into Adobe Photoshop 7.0 for merging of Alexa-fluor 488 and Dapi images. Image analysis was performed using AnalySIS® image analysis software (Soft Imaging System GmbH, Munster, Germany) to determine the total number and area of each syncytium. To ensure repeatability between images, all procedures were performed as a macro function with fixed parameters. Images were captured using a 4x magnification objective equating to approximately 60% of each well of a 96 well plate.
2.4 Statistical Analysis
All data are expressed as mean ± standard error of the mean (S.E.M.) unless otherwise stated. Data was analysed using one way analysis of variance (ANOVA) and Student t-tests. Results were considered statistically significant with p-values less than 0.05 (p<0.05).
3. Results
3.1 Comparison of immunolabeling assay formats to quantify NiV and HeV
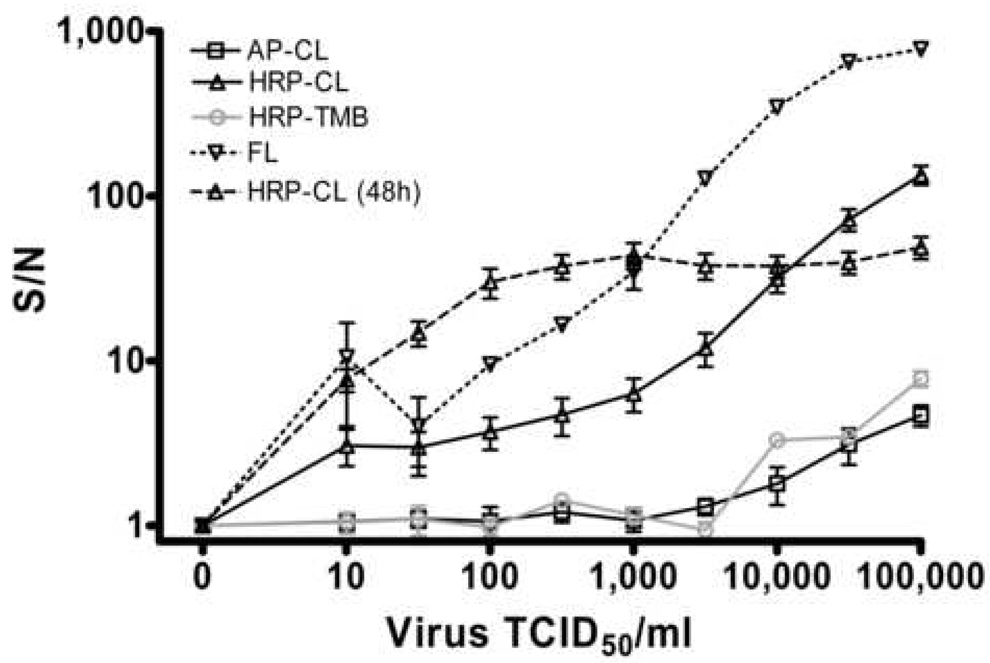
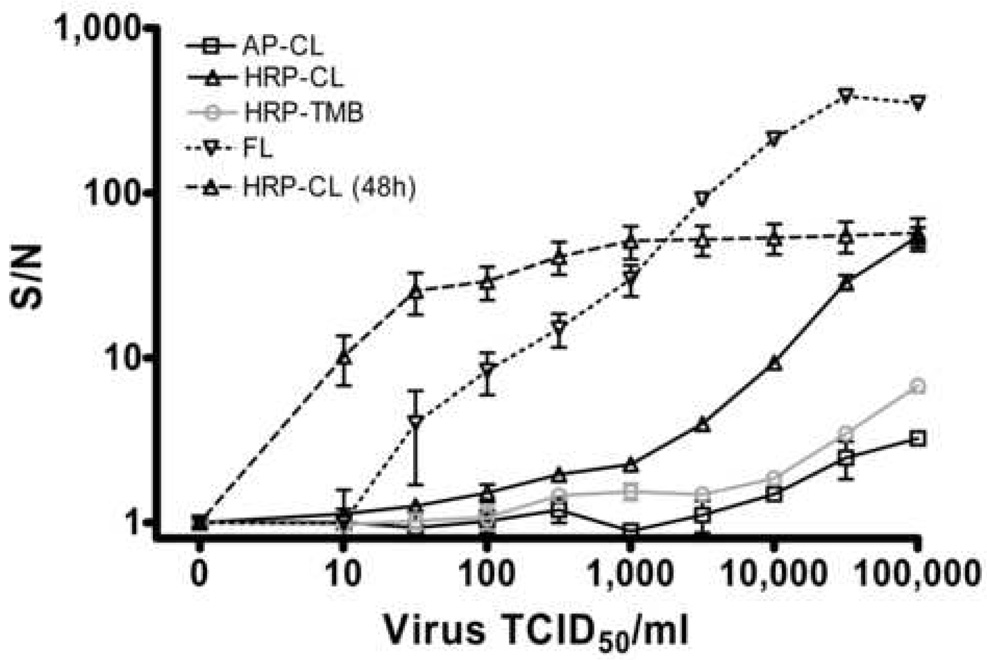
Based on the assumption that assay systems for detecting in vitro viral infection, and specifically, changes in infection due to antiviral drug activity, require excellent sensitivity with minimal background activity, our initial comparisons focused on determining the limit of detection for each assay format. Figure 1 shows the comparative detection of NiV (Fig. 1a) and HeV (Fig. 1b) after 24 hour infection of Vero cells using AP, HRP or FL conjugated immunolabeling and detection with either CDP-Star, TMB or CPS-3 substrates (Table 1). The statistical difference from background (10 TCID50/ml) for each assay is represented in Table 2 with the lowest virus concentration displaying a p value of 0.05 or less indicated in bold. Interestingly, the chemiluminescent HRP substrate displayed signal:noise ratios 16–28 fold greater than the equivalent AP substrate for the highest viral concentration of HeV (54.4 ± 8.73 vs 3.24 ± 0.11, Fig. 1b) and NiV (134 ± 27.86 vs 4.67 ± 0.34, Fig. 1a.), respectively. These results indicate that under equivalent reaction conditions, the HRP conjugate appears to be far more sensitive for chemiluminescent detection than the AP conjugate.
Figure 1. Detection of NiV (a) and HeV (b) via immunodetection assays.
½ log dilutions of virus (100ul) were incubated with 40,000 Vero cells per well for 24 hours at 37°C and 5% CO2. Monolayers were fixed with methanol, air dried and immunostained with anti-NiV-nucleoprotein polyclonal antisera (1:1000) followed by conjugated secondary antibodies (1:1000 – 1:2000). AP-CL, Alkaline Phosphatase conjugate with chemiluminescent substrate detection (n=4 replicate wells). HRP-CL (n=10), Horse Radish Peroxidase conjugate with chemiluminescent detection. HRP-TMB, Horse Radish Peroxidase conjugate with 3,3’,5,5’-Tetramethylbenzidine detection (A450nm, n=5). FL, Alexa-Fluor 488 conjugate (n=3). CL HRP (48h) as for HRP-CL after 48 hour virus infection (n=9). S/N, Signal:noise ratios calculated as signal/background values. Values are expressed as the Mean +/− S.E.
Table 2.
Statistical analysis (T-test) of assay sensitivity for each virus concentration compared to background (10 TCID50 /ml) wells.
| Virus TCID50 /ml | NiV | HeV | ||||||||
|---|---|---|---|---|---|---|---|---|---|---|
| AP-CL | HRP-CL | HRP-TMB | FL | CL HRP (48h) | AP-CL | HRP-CL | HRP-TMB | FL | CL HRP (48h) | |
| 100,000 | <0.01 | <0.001 | <0.01 | <0.001 | <0.001 | <0.001 | <0.001 | <0.001 | <0.001 | <0.01 |
| 31,646 | <0.05 | <0.001 | <0.01 | <0.001 | <0.001 | <0.05 | <0.001 | <0.001 | <0.001 | <0.01 |
| 10,014 | NS1 | <0.001 | <0.001 | <0.01 | <0.001 | <0.05 | <0.001 | <0.01 | <0.001 | <0.01 |
| 3,169 | NS | <0.01 | NS | <0.001 | <0.001 | NS | <0.001 | <0.01 | <0.01 | <0.01 |
| 1,003 | NS | <0.01 | NS | <0.001 | <0.001 | NS | <0.001 | <0.05 | NS | <0.01 |
| 317 | NS | <0.01 | NS | NS | <0.001 | NS | <0.01 | <0.01 | NS | <0.05 |
| 100 | NS | <0.05 | NS | NS | <0.01 | NS | <0.01 | NS | NS | <0.05 |
| 32 | NS | NS | NS | NS | <0.01 | NS | NS | NS | NS | <0.05 |
| n2 | 4 | 10 | 5 | 3 | 9 | 4 | 12 | 5 | 3 | 9 |
Not significant
Number of replicate wells.
TMB substrate detection was significantly different from background when infecting with 316 TCID50/ml of HeV and 10,000 TCID50/ml of NiV but assay linearity was poor (Table 2, Fig. 1). In contrast, HRP chemiluminescent detection repeatedly (and significantly) detected infections with 100 TCID50/ml of either virus (Fig. 1) and remained linear over three orders of magnitude. Fluorescent immunodetection of both NiV and HeV infection provided the largest signal:noise ratios and remained linear over four orders of magnitude but in its current format (digital microscopy followed by image analysis) is extremely resource intensive, precluding it from HTS applications. Nevertheless, there appeared to be a good correlation between the fluorescent detection and HRP-CL substrate detection assays (Fig. 1). The analytical sensitivity of each assay format (Fig. 1 and Fig. 2) was further characterised in terms of the degree of statistical certainty with which each concentration of virus could be distinguished from assay background (Table 2). Confirming the graphical representations of this data, the chemiluminescent-AP substrate assay could only detect (with statistical confidence) the presence of greater than 10,000 and 30,000 TCID50/ml of HeV and NiV, respectively. The TMB-HRP substrate assay was similarly insensitive for NiV detection but showed remarkable sensitivity for HeV detection (300 TCID50/ml) while in contrast, the fluorescent immunodetection assay was ½ log less sensitive for HeV detection than NiV (1,000 TCID50/ml). The best analytical sensitivity was achieved with the chemiluminescent-HRP assay detecting as little as 100 TCID50/ml of both NiV and HeV accurately, making it our preferred assay format. Based on superior sensitivity and linearity of detection with the HRP-CL assay, the HRP-TMB and the AP-CL assays were not evaluated further.
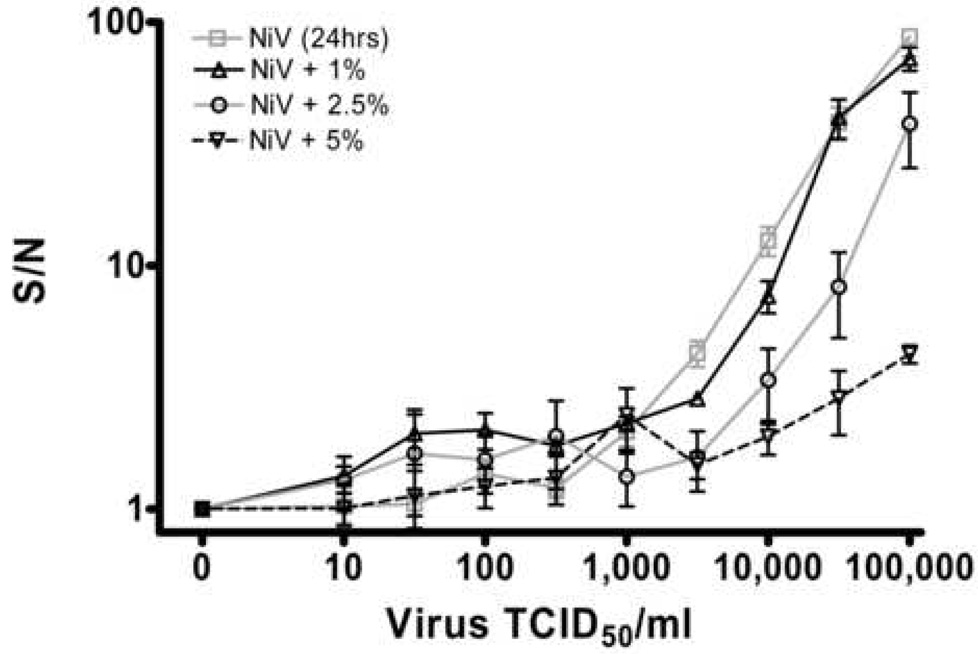
Figure 2. Effect of DMSO on NiV infection.
½ log dilutions of virus were incubated as described in Figure 1 (24 hours) in the presence or absence of 1%, 2.5% and 5% DMSO (n=12 replicate wells). Cell monolayers were fixed, immunolabeled and detected using the HRP-CL assay. S/N, Signal:noise ratios. Values are expressed as the Mean +/− S.E.
While increasing the time of infection to 48 hours further enhanced the sensitivity of detection of both viruses (10 TCID50/ml of NiV and HeV, Fig. 1a and b, respectively) by HRP-CL, the linearity of detection for both viruses was reduced to approximately two logs at very low virus concentrations, rapidly reaching assay saturation (Fig. 1). Additionally, given the majority of experimental library compounds to be tested are dissolved in DMSO, it is likely that the increased cell toxicity of potential antiviral drugs over this period may complicate analyses. To evaluate the potential toxicity effects of DMSO on assay sensitivity, 24 hour NiV infections were also performed in the presence of 1, 2.5 and 5% DMSO (Fig. 2). While all DMSO concentrations reduced the absolute HRP-CL assay signal, signal:noise ratios in the presence of 1% DMSO were not markedly different from untreated controls. Additionally, virus infections in the presence of both 1% and 2.5% DMSO maintained assay linearity over two logs at the upper end of virus concentrations, suggesting assay performance could be maintained with low concentrations of DMSO. In contrast, 5% DMSO drastically reduced assay signal, largely due to direct cellular toxicity observed by nuclear staining (data not shown).
3.2 Effect of microplate storage
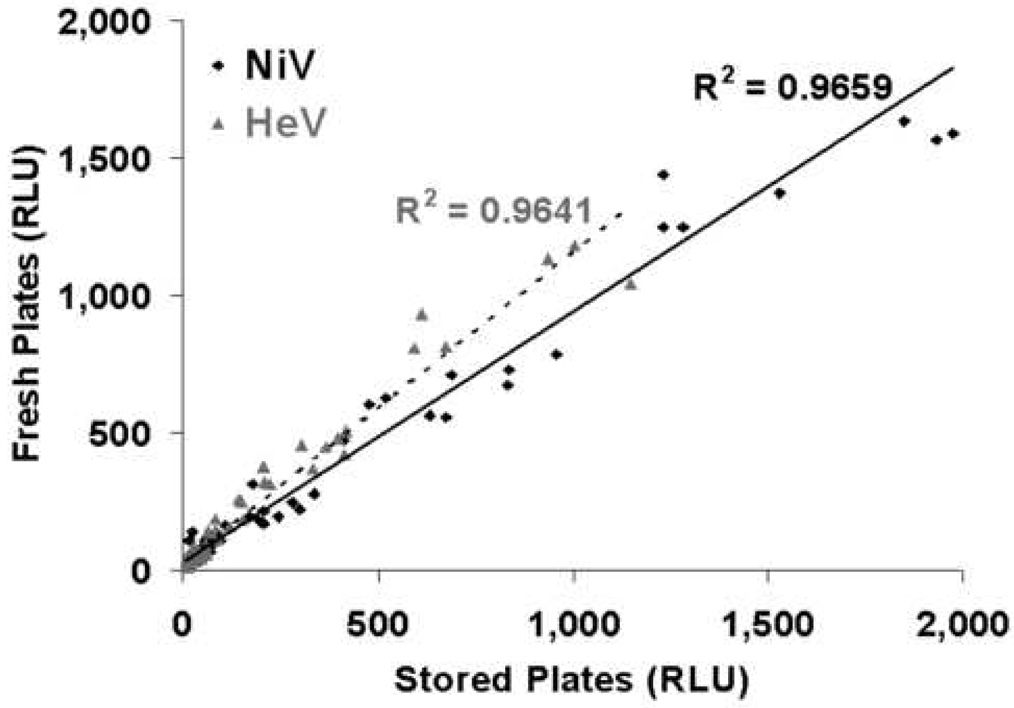
To accommodate large numbers of assay plates in HTS applications with a multi-step assay format involving a separate infection stage (at BSL4) and an immunoassay stage (at BSL2), it will inevitably be more efficient to process batches of plates together rather than individually, necessitating variable storage times following fixation and removal from the BSL4 facility. In an effort to evaluate the effect of microplate storage on assay sensitivity, fixed and dried microplates were stored for one week or more at 4°C and assayed in parallel with plates immunolabeled immediately after being air dried. There appeared to be no differences in assay sensitivity for either virus as demonstrated by the high degree of correlation between plates assayed immediately after fixation (Fig. 3, Fresh plates) and those assayed one week after fixation (Fig. 3 Stored Plates).
Figure 3. Effect of plate storage on assay detection.
½ log dilutions of NiV and HeV were incubated, immunolabeled and detected as described in Figure 1 (24 hours, HRP-CL). 4 plates containing 3 replicate wells were assayed immediately and compared to 4 plates stored at 4°C for 1 week prior to assay. Corresponding raw signal values (RLU, relative light units) for each virus dilution were plotted as Fresh (assayed immediately) vs Stored (assayed after storage). Correlation coefficients for each virus are indicated.
3.3 Assay validation
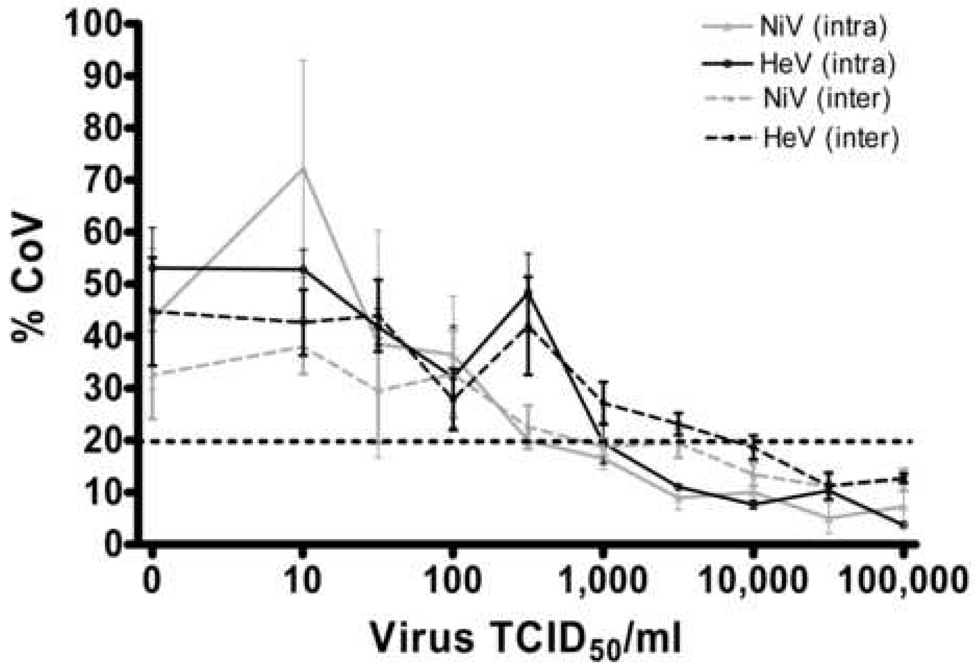
In any biological assay system the inherent variability from well-to-well and plate-to-plate will be considerably greater than in simple liquid assay formats such as ELISAs. The reproducibility of the current assay was examined through serial testing of variation within a given plate (intra plate, n=6) in addition to variation between plates assayed the same day (n=4) or on different days (n=4). Figure 4 shows the coefficient of variation (CoV) calculated for each dilution of virus within (intra) and between plates (inter). Using a maximum of 20% CoV as suggested by Jacobson (Jacobsen, 1998) as adequate for assay development, the chemiluminescent-HRP provides acceptable variation when detecting greater than 1,000 TCID50/ml of either HeV or NiV (Fig. 4, intraplate variation) or greater than 10,000 TCID50/ml between plates.
Figure 4. Effect of virus concentration on assay coefficient of variation.
½ log dilutions of NiV and HeV were incubated, immunolabeled and detected as described in Figure 1 (24 hours, HRP-CL). Coefficient of variation is plotted against virus concentration. Intra assay values are averages of 3 plates containing 6 replicates. Inter assay values are averages of 6 replicates. Values are expressed as the Mean +/− S.E.
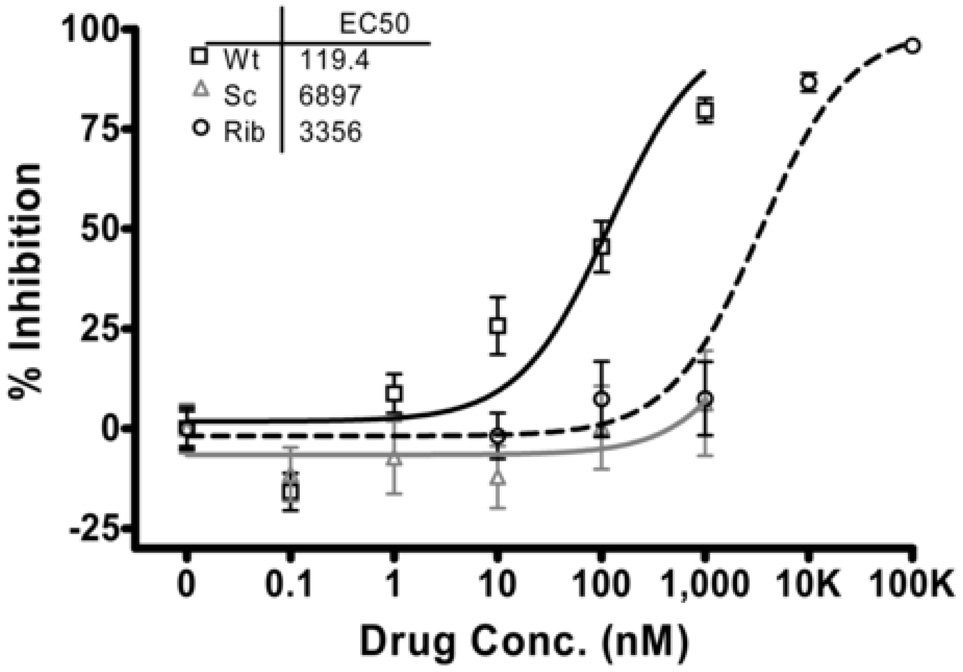
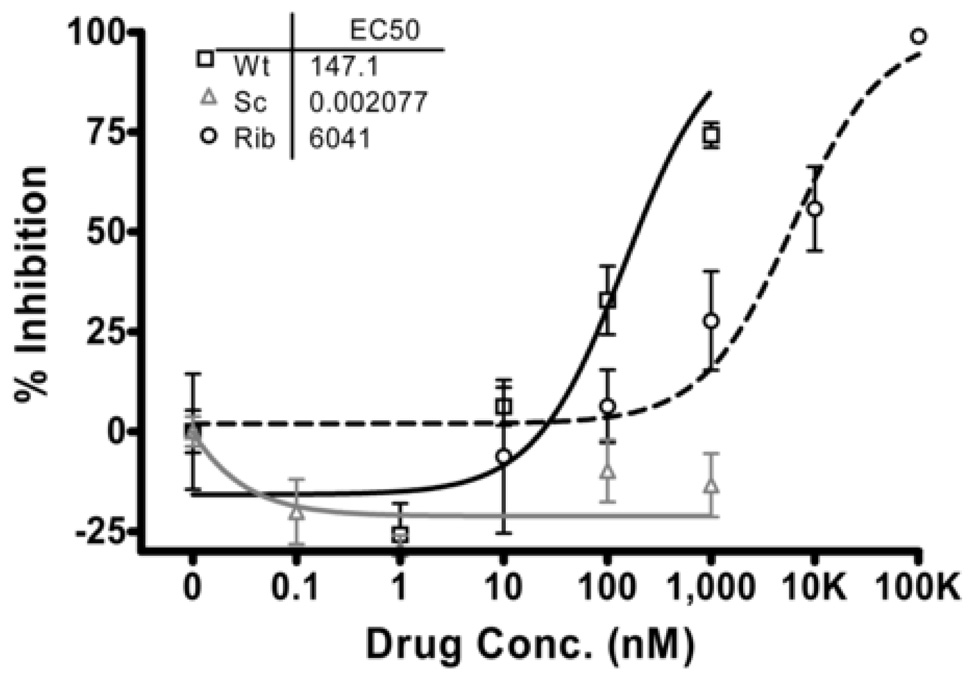
The analytical precision of this assay was tested using known in vitro henipavirus antiviral drugs. Based on previous studies in this laboratory (Porotto et al., 2007; Wright et al., 2005), assay performance was assessed using two positive controls: (Ribavirin (1–100 uM) and a fusion inhibitory peptide derived from the fusion protein of human parainfluenza virus-3 (HPIV-3; Wt, 10–1000 nM) in addition to the corresponding negative control scrambled peptide (Sc, 10–1000nM). These previous studies utilised a CPE based titration readout (Ribavirin, (Wright et al., 2005)) or fluorescent immunoassay format with inhibition endpoints assessed by a reduction in the number of detectable syncytia, as well as a pseudotyped entry assay with inhibition assessed by reduction in entry or multicycle replication of HeV pseudotyped viruses (HPIV-3, (Porotto et al., 2007). When infecting with 10,000 TCID50/ml NiV (m.o.i =0.25), the effect of the controls was clearly and repeatably detected using the chemiluminescent-HRP immunodetection assay (Fig. 5a). The level of inhibition (defined as the concentration of antiviral drug resulting in 50% inhibition, IC50) observed with this assay was comparable to those previously reported in this laboratory (208 nM HPIV3-wt PN-IC50 (Porotto et al., 2007), 2 µM Ribavirin (Wright et al., 2005)) (Figs. 5a and b). Non-linear regression analysis (GraphPad Prism) indicated the concentration of each positive control resulting in 50% inhibition of NiV infection (IC50) was comparable in both fluorescent and chemiluminescent assays and with that previously reported (Porotto et al., 2007).
Figure 5. Evaluation of Henipavirus inhibitors using HRP-chemiluminescent (a) and fluorescent (b) detection.
NiV (m.o.i.= 0.25) was inoculated onto Vero cells preincubated with log dilutions of HPIV3 F protein derived peptide (Wt), Scrambled HPIV3 F peptide (Sc) or Ribavirin (Rib), incubated for 24 hours at 37°C and 5% CO2 then fixed, immunolabeled and detected as described in Figure 1 (HRP-CL). % inhibition was determined compared to untreated, infected wells and values are expressed as the Mean +/− S.E (n=8 replicate wells). Non-linear regression analysis was performed (GraphPad Prism) to determine the 50% inhibitory concentration (IC50).
4. Discussion
In addition to the human health costs, NiV and HeV outbreaks have resulted in a considerable economical burden on affected countries with an estimated US$105 million lost from the pig industry in Malaysia alone as a result of the initially detected outbreak of NiV (Fields, January 2002). The subsequent re-emergence of both HeV and NiV in Australia and Bangladesh, respectively, suggests outbreaks cannot be predicted. Nor will either virus be eradicated based solely on changes in farming practices. The initial drivers for the Malaysian outbreak have been linked to a number of anthropogenic factors such as deforestation and weather related limitations in food supply, forcing enhanced bat encroachment into human populated areas, combined with the locations of fruit orchards and piggery designs (Chua, 2003; Field et al., 2007). Addressing some or all of these issues appears to have been successful in preventing further outbreaks in Malaysia but most of these indicators are not present in the Bangladesh or Indian outbreaks, suggesting a more targeted approach may be required in these locations. NiV has continued to cause fatal encephalitis in humans in Bangladesh and India, and for the first time, person-to-person transmission appeared to have been a primary mode of spread (Gurley et al., 2007; Icddr, 2004a; Icddr, 2004b). In addition, there appeared to be direct transmission of the virus from its natural host, the flying fox, to humans ( Luby et al., 2006) with a case mortality greater than 90%, significantly higher than any other NiV outbreak to date.
These two viruses still pose a significant threat to many countries in the region and other parts of the world. Henipaviruses possess several features that make them highly adaptable for use as bio-warfare agents. These include their ability to be isolated from natural sources (Chua et al., 2002; Reynes et al., 2005), they can be readily grown in cell culture to high titers (Crameri et al., 2002), they are highly infectious and transmitted via the respiratory tract (Field et al., 2001; Hooper et al., 2001) and they can be amplified and spread in livestock serving as a source for transmission to humans. This laboratory has demonstrated recently that both viruses display a broad tolerance to pH changes (e.g. in bat urine) and remain viable for considerable periods in a range of fruit juices (Fogarty et al., 2008), supporting recent epidemiological evidence for food-borne transmission (Luby et al., 2006). When combined with the recent evidence of person to person transmission (Gurley et al., 2007; Icddr, 2004a; Icddr, 2004b) and the absence of any vaccines or therapeutics to treat these viruses, there is an urgent need to develop effective therapeutic intervention strategies for Henipaviruses.
While surrogate assays amenable to BSL2 biocontainment are being developed (Porotto et al., 2007), the development of a HTS method for directly quantifying these viruses in a BSL4 environment will be critical both for final evaluation of antiviral drugs identified in surrogate assays and for reducing the time required for effective antiviral drug development. A number of important challenges exist for the development of a BSL4 HTS assay, not the least of which is its cost effectiveness. Simple assays based on quantitation of cytopathic effect (CPE) are often time consuming, may be confounded by compound toxicity effects and may not be directly amenable to a HTS format. More sensitive assays such as indirect ELISAs typically require dedicated plate washing and detection equipment within the BSL4 laboratory. By adapting an existing immunoplaque assay (Crameri et al., 2002) and using ELISA style immunodetection in a microtitre plate format, this assay addresses a number of problems inherent in assay logistics at BSL4. While there is still a risk of cytotoxicity inherent in this assay format, selecting lead compounds based initially on inhibition of virus production, followed by specific toxicity assays, reduces significantly the number of false positives likely to be produced by comparable surrogate assays. This assay reduces the time required for viral detection from up to 3 days in the traditional microneutralisation assay to 1 day in our monolayer immunodetection assay, and all immunodetection steps are performed on fixed cell monolayers after removal from the BSL4 laboratory, ensuring comparable costs with equivalent BSL2 assays. Importantly, this format provides all the benefits of BSL4 antiviral drug screening while minimising the considerable costs and time requirements associated with BSL4 experimentation.
Data from the present study indicate that the use of a chemiluminescent substrate with a secondary antibody conjugated HRP displayed significantly greater (almost 30 fold) signal: noise ratios compared to equivalent detection with an AP conjugate (Figure 1). This effect may be due in part to an effective reduction of background signals in cell monolayers resulting from endogenous peroxidase activity (Atamna and Boyle, 2006) by H2O2 treatment prior to addition of substrate. This results in a more sensitive and repeatable detection of viral protein. However, the more commonly used ELISA substrate for HRP conjugated antibodies (TMB) displayed comparable S/N ratios to AP detection, despite the addition of peroxide blocking steps. While fluorescent immunodetection was consistently the most sensitive and linear of all assay formats compared here, the intensive microscopic analysis required would require a specific dedicated microscopy facility for its adaptation to HTS assay format. The analytical sensitivity for HeV and NiV infection in Vero cells was 100 TCID50/ml, respectively, using the chemiluminescent-HRP immunodetection assay. However the intra and inter assay variation inherent in biological assay systems suggests that while intraplate comparisons will be highly robust, interplate comparisons may only be possible when detecting greater than 10,000 TCID50/ml virus, equivalent to an m.o.i of 0.25. This assay consistently evaluated a well characterised experimental henipavirus inhibitor (Porotto et al., 2007) in addition to the broad spectrum antiviral, Ribavirin, providing valuable internal controls for subsequent HTS applications.
The IC50 reported for Ribavirin in the current study (3–6µM) is comparable to that reported previously for inhibition of HeV in this laboratory despite different methods of detection (2µM, (Wright et al., 2005)). Additionally, these results are similar to those reported in investigations of other RNA viruses (IC50s between 1.6 and 66.7 µg/ml) including orthomyxoviruses (influenza virus) and paramyxoviruses (parainfluenza virus, mumps virus, measles virus, and respiratory syncytial virus) in vitro (Huffman et al., 1973; Shigeta et al., 1992). However, a direct comparison of results is difficult because a variety of methods have been used to assess the effect of ribavirin. The methods include the reduction of CPE, virus titer, viral RNA, viral antigen and viral protein synthesis, and virus-induced cell fusion. This report of a simple immunodetection assay provides for the first time, a HTS method amenable for direct assessment of live henipavirus antiviral drug activity.
Acknowledgements
The authors thank Dr. Axel Colling, CSIRO-AAHL, for assistance with assay validation guidelines and Dr. Jackie Pallister for critical evaluation of the manuscript. This work was supported by NIH (NIAID) Northeast Center of Excellence for Bio-defense and Emerging Infections Disease Research U54AI057158 Developmental and Innovation Research Grants to AM (PI of Center of Excellence grant: W.I. Lipkin). We acknowledge the Northeast Center of Excellence for Bio-defense and Emerging Infections Disease Research’s Proteomics Core for peptide synthesis and purification.
Abbreviations
- NiV
Nipah virus
- HeV
Hendra virus
- BSL4
Biosafety level 4
- ELISA
Enzyme Linked Immunosorbent Assay
- HTS
High Throughput Screening
- EMEM
Eagle’s Modified Essential Medium
- FCS
Foetal Calf Serum
- TCID
Tissue Culture Infectious Dose
- TMB
3,3’,5,5’-Tetramethylbenzidine
- HRP
Horse Radish Peroxidase
- AP
Alkaline Phosphatase
- CPS-3
Chemiluminescent Peroxidase Substrate
- DMSO
Dimethyl Sulfoxide
- HPIV-3
Human Parainfluenza Virus-3
- CPE
Cytopathic Effect.
Footnotes
Publisher's Disclaimer: This is a PDF file of an unedited manuscript that has been accepted for publication. As a service to our customers we are providing this early version of the manuscript. The manuscript will undergo copyediting, typesetting, and review of the resulting proof before it is published in its final citable form. Please note that during the production process errors may be discovered which could affect the content, and all legal disclaimers that apply to the journal pertain.
References
- Atamna H, Boyle K. Amyloid-beta peptide binds with heme to form a peroxidase: relationship to the cytopathologies of Alzheimer's disease. Proc Natl Acad Sci U S A. 2006;103:3381–3386. doi: 10.1073/pnas.0600134103. [DOI] [PMC free article] [PubMed] [Google Scholar]
- Bellini WJ, Harcourt BH, Bowden N, Rota PA. Nipah virus: an emergent paramyxovirus causing severe encephalitis in humans. J Neurovirol. 2005;11:481–487. doi: 10.1080/13550280500187435. [DOI] [PubMed] [Google Scholar]
- Chong H, Kamarulzaman A, Tan C, Goh K, Thayaparan T, Kunjapan SR, Chew N, Chua K, Lam S. Treatment of Acute Nipah Encephalitis With Ribavirin. Annals of Neurology. 2001;49:810–813. doi: 10.1002/ana.1062. [DOI] [PubMed] [Google Scholar]
- Chua KB. Nipah virus outbreak in Malaysia. J Clin Virol. 2003;26:265–275. doi: 10.1016/s1386-6532(02)00268-8. [DOI] [PubMed] [Google Scholar]
- Chua KB, Goh KJ, Wong KT, Kamarulzaman A, Tan PS, Ksiazek TG, Zaki SR, Paul G, Lam SK, Tan CT. Fatal encephalitis due to Nipah virus among pig-farmers in Malaysia. Lancet. 1999;354:1257–1259. doi: 10.1016/S0140-6736(99)04299-3. [DOI] [PubMed] [Google Scholar]
- Chua KB, Koh CL, Hooi PS, Wee KF, Khong JH, Chua BH, Chan YP, Lim ME, Lam SK. Isolation of Nipah virus from Malaysian Island flying-foxes. Microbes Infect. 2002;4:145–151. doi: 10.1016/s1286-4579(01)01522-2. [DOI] [PubMed] [Google Scholar]
- Chutaputti A. Adverse effects and other safety aspects of the hepatitis C antivirals. J Gastroenterol Hepatol. 2000;15 Suppl:E156–E163. doi: 10.1046/j.1440-1746.2000.02114.x. [DOI] [PubMed] [Google Scholar]
- Crameri G, Wang LF, Morrissy C, White J, Eaton BT. A rapid immune plaque assay for the detection of Hendra and Nipah viruses and anti-virus antibodies. J Virol Methods. 2002;99:41–51. doi: 10.1016/s0166-0934(01)00377-9. [DOI] [PubMed] [Google Scholar]
- Daniels P, Ksiazek T, Eaton BT. Laboratory diagnosis of Nipah and Hendra virus infections. Microbes Infect. 2001;3:289–295. doi: 10.1016/s1286-4579(01)01382-x. [DOI] [PubMed] [Google Scholar]
- De Franceschi L, Fattovich G, Turrini F, Ayi K, Brugnara C, Manzato F, Noventa F, Stanzial AM, Solero P, Corrocher R. Hemolytic anemia induced by ribavirin therapy in patients with chronic hepatitis C virus infection: role of membrane oxidative damage. Hepatology. 2000;31:997–1004. doi: 10.1053/he.2000.5789. [DOI] [PubMed] [Google Scholar]
- Eaton BT, Broder CC, Middleton D, Wang LF. Hendra and Nipah viruses: different and dangerous. Nat Rev Microbiol. 2006;4:23–35. doi: 10.1038/nrmicro1323. [DOI] [PMC free article] [PubMed] [Google Scholar]
- Field H, Young P, Yob JM, Mills J, Hall L, Mackenzie J. The natural history of Hendra and Nipah viruses. Microbes Infect. 2001;3:307–314. doi: 10.1016/s1286-4579(01)01384-3. [DOI] [PubMed] [Google Scholar]
- Field HE, Mackenzie JS, Daszak P. Henipaviruses: emerging paramyxoviruses associated with fruit bats. Curr Top Microbiol Immunol. 2007;315:133–159. doi: 10.1007/978-3-540-70962-6_7. [DOI] [PMC free article] [PubMed] [Google Scholar]
- Fields BN, Knipe DM, Howley PM. Fields' virology. Philadelphia: Lippincott Williams & Wilkins; 2007. [Google Scholar]
- Fields H. Manual On The Diagnosis Of Nipah Virus Infection In Animals. In: F.a.A.O.o.t.U. Nations, editor. Regional Office for Asia and the Pacific. Animal Production and Health Commission for Asia and the Pacific (APHCA); 2002. [Google Scholar]
- Fogarty R, Halpin K, Hyatt A, Daszak P, Mungall BA. Henipavirus susceptibility to environmental variables. Virus Res. 2008 doi: 10.1016/j.virusres.2007.11.010. [DOI] [PMC free article] [PubMed] [Google Scholar]
- Georges-Courbot MC, Contamin H, Faure C, Loth P, Baize S, Leyssen P, Neyts J, Deubel V. Poly(I)-poly(C12U) but not ribavirin prevents death in a hamster model of Nipah virus infection. Antimicrob Agents Chemother. 2006;50:1768–1772. doi: 10.1128/AAC.50.5.1768-1772.2006. [DOI] [PMC free article] [PubMed] [Google Scholar]
- Gurley ES, Montgomery JM, Hossain MJ, Islam MR, Molla MA, Shamsuzzaman SM, Akram K, Zaman K, Asgari N, Comer JA, Azad AK, Rollin PE, Ksiazek TG, Breiman RF. Risk of nosocomial transmission of nipah virus in a Bangladesh hospital. Infect Control Hosp Epidemiol. 2007;28:740–742. doi: 10.1086/516665. [DOI] [PubMed] [Google Scholar]
- Halpin K, Mungall BA. Recent progress in henipavirus research. Comp Immunol Microbiol Infect Dis. 2007 doi: 10.1016/j.cimid.2007.05.008. [DOI] [PubMed] [Google Scholar]
- Harcourt BH, Tamin A, Ksiazek TG, Rollin PE, Anderson LJ, Bellini WJ, Rota PA. Molecular characterization of Nipah virus, a newly emergent paramyxovirus. Virology. 2000;271:334–349. doi: 10.1006/viro.2000.0340. [DOI] [PubMed] [Google Scholar]
- Hooper P, Zaki S, Daniels P, Middleton D. Comparative pathology of the diseases caused by Hendra and Nipah viruses. Microbes Infect. 2001;3:315–322. doi: 10.1016/s1286-4579(01)01385-5. [DOI] [PubMed] [Google Scholar]
- Huffman JH, Sidwell RW, Khare GP, Witkowski JT, Allen LB, Robins RK. In vitro effect of 1-beta-D-ribofuranosyl-1,2,4-triazole-3-carboxamide (virazole, ICN 1229) on deoxyribonucleic acid and ribonucleic acid viruses. Antimicrob Agents Chemother. 1973;3:235–241. doi: 10.1128/aac.3.2.235. [DOI] [PMC free article] [PubMed] [Google Scholar]
- Hyatt AD, Selleck PW. Ultrastructure of equine morbillivirus. Virus Res. 1996;43:1–15. doi: 10.1016/0168-1702(96)01307-x. [DOI] [PubMed] [Google Scholar]
- Icddr B. Nipah Encephalitis Outbreak Over Wide Area of Western Bangladesh, 2004. Health and Science Bulletin. 2004a;2(1):7–11. [Google Scholar]
- Icddr B. Person-to-person transmission of Nipah virus during outbreak in Faridpur District, 2004. Health and Science Bulletin. 2004b;2(2):5–9. [Google Scholar]
- Jacobsen RH. Validation of serological assays for diagnosis of infectious diseases. Rev. Sci. Tech. Off. Int. Epiz. 1998;17:469–486. doi: 10.20506/rst.17.2.1119. [DOI] [PubMed] [Google Scholar]
- Luby SP, Rahman M, Hossain MJ, Blum LS, Husain MM, Gurley E, Khan R, Ahmed BN, Rahman S, Nahar N, Kenah E, Comer JA, Ksiazek TG. Foodborne transmission of Nipah virus, Bangladesh. Emerg Infect Dis. 2006;12:1888–1894. doi: 10.3201/eid1212.060732. [DOI] [PMC free article] [PubMed] [Google Scholar]
- Murray K, Selleck P, Hooper P, Hyatt A, Gould A, Gleeson L, Westbury H, Hiley L, Selvey L, Rodwell B, et al. A morbillivirus that caused fatal disease in horses and humans. Science. 1995;268:94–97. doi: 10.1126/science.7701348. [DOI] [PubMed] [Google Scholar]
- Nagai Y. Paramyxovirus replication and pathogenesis. Reverse genetics transforms understanding. Rev Med Virol. 1999;9:83–99. doi: 10.1002/(sici)1099-1654(199904/06)9:2<83::aid-rmv244>3.0.co;2-5. [DOI] [PubMed] [Google Scholar]
- Porotto M, Carta P, Deng Y, Kellogg GE, Whitt M, Lu M, Mungall BA, Moscona A. Molecular determinants of antiviral potency of paramyxovirus entry inhibitors. J Virol. 2007;81:10567–10574. doi: 10.1128/JVI.01181-07. [DOI] [PMC free article] [PubMed] [Google Scholar]
- Porotto M, Doctor L, Carta P, Fornabaio M, Greengard O, Kellogg GE, Moscona A. Inhibition of hendra virus fusion. J Virol. 2006;80:9837–9849. doi: 10.1128/JVI.00736-06. [DOI] [PMC free article] [PubMed] [Google Scholar]
- Reynes JM, Counor D, Ong S, Faure C, Seng V, Molia S, Walston J, Georges-Courbot MC, Deubel V, Sarthou JL. Nipah virus in Lyle's flying foxes, Cambodia. Emerg Infect Dis. 2005;11:1042–1047. doi: 10.3201/eid1107.041350. [DOI] [PMC free article] [PubMed] [Google Scholar]
- Shakil AO, McGuire B, Crippin J, Teperman L, Demetris AJ, Conjeevaram H, Gish R, Kwo P, Balan V, Wright TL, Brass C, Rakela J. A pilot study of interferon alfa and ribavirin combination in liver transplant recipients with recurrent hepatitis C. Hepatology. 2002;36:1253–1258. doi: 10.1053/jhep.2002.36162. [DOI] [PubMed] [Google Scholar]
- Shiell BJ, Gardner DR, Crameri G, Eaton BT, Michalski WP. Sites of phosphorylation of P and V proteins from Hendra and Nipah viruses: newly emerged members of Paramyxoviridae. Virus Res. 2003;92:55–65. doi: 10.1016/s0168-1702(02)00313-1. [DOI] [PubMed] [Google Scholar]
- Shigeta S, Mori S, Baba M, Ito M, Honzumi K, Nakamura K, Oshitani H, Numazaki Y, Matsuda A, Obara T, et al. Antiviral activities of ribavirin, 5-ethynyl-1-beta-D-ribofuranosylimidazole-4-carboxamide, and 6'-(R)-6'-C-methylneplanocin A against several ortho- and paramyxoviruses. Antimicrob Agents Chemother. 1992;36:435–439. doi: 10.1128/aac.36.2.435. [DOI] [PMC free article] [PubMed] [Google Scholar]
- Takeda M, Nakatsu Y, Ohno S, Seki F, Tahara M, Hashiguchi T, Yanagi Y. Generation of measles virus with a segmented RNA genome. J Virol. 2006;80:4242–4248. doi: 10.1128/JVI.80.9.4242-4248.2006. [DOI] [PMC free article] [PubMed] [Google Scholar]
- Wang L, Harcourt BH, Yu M, Tamin A, Rota PA, Bellini WJ, Eaton BT. Molecular biology of Hendra and Nipah viruses. Microbes Infect. 2001;3:279–287. doi: 10.1016/s1286-4579(01)01381-8. [DOI] [PubMed] [Google Scholar]
- Wright PJ, Crameri G, Eaton BT. RNA synthesis during infection by Hendra virus: an examination by quantitative real-time PCR of RNA accumulation, the effect of ribavirin and the attenuation of transcription. Arch Virol. 2005;150:521–532. doi: 10.1007/s00705-004-0417-5. [DOI] [PubMed] [Google Scholar]


