

Abstract
We have extended our previously developed 3D multi-scale agent-based brain tumor model to simulate cancer heterogeneity and to analyze its impact across the scales of interest. While our algorithm continues to employ an epidermal growth factor receptor (EGFR) gene-protein interaction network to determine the cells’ phenotype, it now adds an implicit treatment of tumor cell adhesion related to the model’s biochemical microenvironment. We simulate a simplified tumor progression pathway that leads to the emergence of five distinct glioma cell clones with different EGFR density and cell ‘search precisions’. The in silico results show that microscopic tumor heterogeneity can impact the tumor system’s multicellular growth patterns. Our findings further confirm that EGFR density results in the more aggressive clonal populations switching earlier from proliferation-dominated to a more migratory phenotype. Moreover, analyzing the dynamic molecular profile that triggers the phenotypic switch between proliferation and migration, our in silico oncogenomics data display spatial and temporal diversity in documenting the regional impact of tumorigenesis, and thus support the added value of multi-site and repeated assessments in vitro and in vivo. Potential implications from this in silico work for experimental and computational studies are discussed.
Keywords: glioma, epidermal growth factor receptor, cancer heterogeneity, agent-based model
1. INTRODUCTION
We present the extension of our previously developed three-dimensional (3D) agent-based, multi-scale brain tumor model to incorporate a simplified glioma progression pathway in an effort to study the impact of clonal heterogeneity on tumor growth dynamics. For the micro-macroscopic environment, we expanded the initial setup [1-3] by simulating the interaction between the chemoattractant concentration and the degree of cell adhesion. Like before [3], a set of chemoattractants such as glucose, oxygen tension and transforming growth factor alpha (TGFα) diffuses [4-6] along a gradient that depends both on the initial conditions as well as on the cells’ consumption and secretion (TGFα). Also, the glioma cells’ considerably high migration rate in vivo, and even more so in vitro [7] is impacted by the TGFα concentration to properly reflect available experimental data [8-11]. Specifically, we modeled the chemotactically attracted cells as follows: once the concentration of the so called homotype attractant [12], in this case TGFα, substantially exceeds that of the heterotype attractant [13] such as glucose, the homotype attractant (TGFα) plays a much more important role for directing cell attraction and vice versa. For the molecular environment, each cell is equipped with an epidermal growth factor receptor (EGFR) gene-protein interaction pathway [1-3] that is implicitly integrated with a simplified cell cycle module [14]. The pathway molecule ‘activated phospholipase Cγ’ (PLCγ) is deemed critical in determining the cell phenotype which represents experimental results reported in part by [15] for the case of breast cancer. However, other than in our previous works where heterogeneity arose only from phenotypic alterations of an otherwise mono-clonal tumor, here, we have integrated a simplified cancer progression model (based on [16]) to generate a heterogeneous brain tumor that eventually consists of five distinct clonal populations that emerged through mutational events. These clones differ in their EGFR density in addition to being able to adjust their phenotypic behavior readily to the micro-environmental conditions. Reflecting experimental data, the sub-clones with higher EGF receptor density are more aggressive [17], and operate with an inefficient metabolism [18, 19]; yet, they achieve a higher chemotactic search precision to move faster along the environment’s least resistance, most permission and highest attraction paths [20]. We will discuss the results and their potential implications, and introduce plans for future work.
2. PREVIOUS WORKS
Earlier tumor models focused primarily on either the micro-macroscopic or the molecular level to simulate tumor growth and migration. For instance, for the micro-macroscopic scale, Mansury et al. [21-23] proposed a two-dimensional (2D) agent-based model in which the spatio-temporal expansion of malignant brain tumor cells is guided by environmental heterogeneities (mechanical confinement, toxic metabolites and nutrient sources) in order to gain more insight into the systemic effect of such cellular chemotactic search precision modulations. For the molecular scale, Schoeberl et al. [24] built up a computational model to describe the dynamics of the MAPK cascade activated by EGF receptors and Araujo et al. [25] developed an EGFR signaling network model that not only shows the protein dynamics in the EGFR pathway but also predicts the therapeutic effect of inhibitors on the molecular network. In an effort to develop a cell cycle module, Alarcon et al. [14] extended the work of Tyson and Novak [26] to model the cancer cell cycle process under hypoxic conditions. Additionally, to simulate mutation among different clones, Sole and Deisboeck [16] revised the previous quasispecies model of Swetina and Schuster [27] to research the impact of genetic instability on tumor growth. While these models undoubtedly are useful at their particular scale of interest, the quest of studying the tumor as a biological system that crosses scales requires a multiscale modeling approach. Therefore, in [28] and [1, 2] our group developed a 2D multi-scale agent-based tumor model to integrate both, the molecular and micro-macroscopic environments. Specifically, in [1] we put forward an EGFR gene-protein interaction pathway in which activated PLCγ is employed to determine the cell phenotype. Subsequently, in [2] we then compared the biological behavior of glioma cell clones with varying EGFR density. Building on this work, in [3] we recently introduced a 3D multi-scale agent-based brain tumor model which explicitly includes a cell cycle description. However, this multi-scale model has a number of shortcomings that include simulating a monoclonal, and thus a genetically stable tumor, and it also suffers from a rather simplistic description of the tissue microenvironment. To model these features more realistically the subsequent section will describe the setup of a much more sophisticated 3D multi-scale brain tumor model that now includes implicitly the phenotype of cell adhesion as it relates to chemoattractant [10] and incorporates specifically the emergence of heterogeneous tumor cell clones.
3. MATHEMATICAL MODEL
As before, this multi-scale agent-based brain tumor model includes macro-microscopic and molecular environments that interact with each other. The following sections describe these environments and their relationships in detail.
3.1. Macro-microscopic environment
3.1.1. Clonal heterogeneity
Here, a slice of virtual brain tissue is modeled with a 100*100*100 3D rectangular lattice as depicted in Figure 1. A continually replenished nutrient source, representing a blood vessel, is located in Cube 4.
Figure 1.

Schematic of the 3D lattice, with Cube 4 harboring the nutrient source. We apply the Dirichlet boundary condition [41] and set the chemo-attractant concentration in the boundary to zero.
To yield tumor heterogeneity, an element of genetic instability is introduced that is based on the mutation model presented by [16]. Our ‘progression pathway’ here incorporates five glioma cell clones (A, B, C, D and E) that emerge sequentially (Figure 2), and that are distinct in their EGFR receptor density. Based on experimental data, in our setup, cell clones with higher EGFR receptor density are more aggressive [17, 29, 30] and operate with an inefficient metabolism [18, 19]; yet, they achieve a higher chemotactic search precision to move faster along the environment’s least resistance, most permission and highest attraction paths [20].
Figure 2.
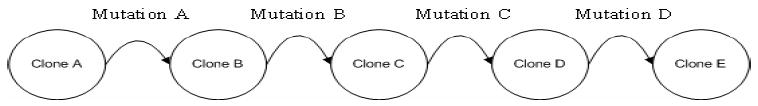
The mutational steps that constitute the genetic progression pathway from clone A to E.
In the beginning, five hundred clone A cells are initialized as close as possible to the center of the lattice as each cell occupies one lattice point. As a first iteration, the model implements a linear progression pathway in assuming that clone A can only mutate to B, clone B to C, C to D, and D to E. The respective mutation rates depend on the cell’s proliferation period and are listed in Table 1.
Table 1.
Cell cycle times and proliferation periods for clone A to E.
| Clone type | Cell cycle | Proliferation period |
|---|---|---|
| A | T | 2T |
| B | T | 1.8T |
| C | T | 1.6T |
| D | T | 1.4T |
| E | T | 1.2T |
To mimic progression from a relatively genetically stable precursor, we set the mutation rate from clone A to B as . Applying the same calculation for the remaining clones, we deduce a mutation rate from B to C of 11%, from C to D of 12% and D to E of 15%.
3.1.2. Chemoattractants
Transforming growth factor alpha (TGFα) is a protein that not only can affect the secreting tumor cell itself, hence generates an ‘autocrine’ feedback loop, but also can impact bystander cells, an effect known as ‘paracrine’. Habib et al. [12] refers to this soluble chemical effector as homotype chemoattractant. Conversely, glucose, not produced by tumor cells, is denoted as heterotype attractants [13]. Our setup places a blood vessel in the center of Cube 4 to supply glucose, TGFα and oxygen for the developing brain tumor. Initially, these chemoattractants are dispersed by normal distribution described in Eq. 1-3:
| (1) |
| (2) |
| (3) |
In Eq. 1, Tm stands for the maximum TGFα (X1) concentration in the tumor [31] and σt is the parameter that controls the dispersion of the TGFα level. In Eq. 2, Ga is the minimum blood glucose (X14) level while Gm stands for the maximum concentration of glucose in blood, with σg being the parameter controlling the dispersion of glucose [32]. Likewise, in Eq. 3, ka is the minimum oxygen tension and km represents the maximum oxygen tension (k44) [3, 14], σo is the parameter controlling the dispersion of the oxygen tension level, and dijk is the L-infinity [21] distance to the center of Cube 4. During the simulation, at each time step the cell will take up glucose to maintain its metabolism and secrete TGFα [1] triggering both paracrine and autocrine biological behavior that is described by Eq. 4-5:
| (4) |
| (5) |
In Eq. 4-5, t represents the time step, ST is the TGFα secretion rate [33] and rn is the cell’s glucose uptake coefficient [34] for each clone. Because [19] argues that the metabolism of cancer cells is approximately eight times larger than the metabolism of normal cells and since [34] discovered that for U87 human glioma cells the glucose uptake rate is 0.77 pmol/h per cell, we assign each clone (A, B, C, D and E) a different glucose uptake rate related to its EGFR density, which is listed in the Table 2.
Table 2.
| rA | 3.85×10⁻¹² | mol/step | Glucose uptake coefficient for clone A |
| rB | 4×10⁻¹² | mol/step | Glucose uptake coefficient for clone B |
| rC | 7.7 ×10⁻¹² | mol/step | Glucose uptake coefficient for clone C |
| rD | 1.54×10⁻¹¹ | mol/step | Glucose uptake coefficient for clone D |
| rE | 3.08×10⁻¹¹ | mol/step | Glucose uptake coefficient for clone E |
| D1 | 6.7 ×10⁻⁷ | cm2s−1 | Diffusion coefficient of glucose |
| D2 | 5.18×10⁻⁷ | cm2s−1 | Diffusion coefficient of TGFα |
| Do | 8×10⁻⁵ | cm2s−1 | Diffusion coefficient of oxygen tension |
| Tm | 147 ±18 | pg / ml | Maximum concentration of TGFα |
| Ga | 0.72×10⁻⁹ | mol/site | Normal concentration of glucose |
| Gm | 2.36×10⁻⁹ | mol/site | Maximum concentration of glucose |
| ST | 0.3 | molecules/min | Secretion rate of TGFα |
| ka | 0.0017 | Dimensionless Constant (DC) | Normal concentration of oxygen |
| km | 0.0025 | DC | Maximum concentration of oxygen |
Because the chemo-attractants’ initialization through Eq. 1-3 causes different gradients in the 3D lattice, the aforementioned biochemicals glucose, TGFα and oxygen will simultaneously diffuse [1-3] during the simulation according to Eq. 6-8.
| (6) |
| (7) |
| (8) |
where D1 is the diffusion coefficient of glucose [5], D2 is theTGFα diffusion coefficient [6] and Do stands for the diffusion coefficient of oxygen [4].
3.1.3. Chemotaxis approach
The general outline can be summarized in these three steps: (1) when the cell is going to move to or split its progeny into a new location, it will employ Eq. 13-14 to decide which chemoattractant, heterotype or homotype, dominates the new location search; (2) the TGFα concentration of the cell’s neighborhood determines which spatial ‘permission’ pattern (3D Moore neighborhood, 3D Diagonal neighborhood or 3D Von Neumann neighborhood) for the cell to choose, as detailed in Eq. 10-12; finally (3) Eq. 9 is employed to find the new location for the cell. In the following, we first introduce the term of ‘chemotactic search precision’, followed by the description of a cell’s spatial ‘permission’ under various chemoattractant concentrations. We then briefly illustrate how homotype and heterotype chemoattractants impact the tumor cells’ migratory and proliferative behavior.
Representing the biological mechanism of chemotaxis we have again implemented a search mechanism as put forward already in [21, 22].
| (9) |
where Tijk stands for the perceived attractiveness of location (i,j,k), Lijk represents the correct, non-erroneous evaluation of location (i,j,k) where εj ~ N(μ,σ2) is an error term that is normally distributed with mean μ and variance σ2 . The parameter ψn is positive between zero and one, 0≤ψn≤1 , and represents the extent of the ‘search precision’ (with ‘0’ exhibiting purely random walk behavior, and ‘1’ being fully biased without any error in signal processing); the subscript of ψ represents the different clones. In accordance with experimental data [29] that report an acceleration of the tumor’s spatio-temporal expansion rate with increasing EGFR density per cell, we argue that a cancer cell with high EGFR density should express a comparably high search precision (being lesser affected by the noise function). Thus, we assign a search precision value of 0.5 for clone A and B, and 0.7 for clone C, D and E, respectively.
The definitions of the Von Neumann and Moore neighborhoods [21] usually are restricted to 2D lattices. We therefore define 3D Von Neumann neighborhood, 3D Diagonal neighborhood, and 3D Moore neighborhood as detailed in Eq. 10-12 with
| (10) |
| (11) |
| (12) |
Here, (x0, y0, z0) denotes the current location of the cell and (x ,y ,z) represents the coordinates of its neighborhood. We set the grid size to 10μ m to reflect the (idealized) average diameter of a real tumor cell and each simulation step represents approximately 2.5 hours, similar to our previous study [3]. The maximum distance for a given tumor cell to migrate under a 3D Von Neumann neighborhood search is therefore 10μ m/simulation step, 14.4μ m/simulation step under a 3D Diagonal neighborhood search, and 17.3μ m/simulation step under a 3D Moore neighborhood search paradigm, hence well within the range of the tumor cell migration rate reported in vitro [7].
It has been well established that cancer cells differ from normal cells in a variety of ways which include uncontrolled proliferation, loss of contact inhibition, progressive lack of tumor cell-tumor cell adhesion and tissue invasion [35]. Also, Athale and Deisboeck [2] already demonstrated in separate simulation runs that in silico, glioma cells with higher EGFR density are more aggressive with faster migration and lower proliferation rate. Moreover, as indicated by [8-11] the concentration of chemoattractant can impact the degree of tumor cell adhesion and the cells’ migration rate. We therefore ranked the diffusive TGFα concentration at three levels in decreasing order: If the neighborhood of the tumor cell carries a high average TGFα concentration (= level 1) the cell can choose its next location from the 3D Moore neighborhood ( ) which conveys the highest spatial permission and therefore results in the fastest cell migration rate. If the cell resides at a location within the second TGFα concentration level (2), it will choose the next location from the 3D Diagonal neighborhood ( ). Otherwise, the cell will select its next location from the more restrictive 3D Von Neumann neighborhood ( ). We therefore incorporate in our expanded model here not only that the chemotactically-driven search precision of clones C, D, E is higher than that of clones A and B. Rather, in addition, we implement that a higher TGFα concentration can increase the cell’s spatial “permission”, thus reflecting its progressive loss of tumor cell-tumor cell adhesion as reported in [8-11], and as such implicitly adding an element of haptotaxis.
As discussed earlier, Lijk is the correct, non-erroneous evaluation of location, which includes homotype and heterotype chemoattractants. Eq. 13 models this biological behavior, i.e., if a cell resides in location (x0, y0, z0) and the sum of its 3D Von Neumann neighborhood TGFα ( ) is greater than glucose concentration ( ), then this cell is subjective to choose the homotype attractant, otherwise the cell is attracted by the heterotype cue.
| (13a) |
| (13b) |
3.1.4. Cell phenotype
As before, we simulate four different cellular phenotypes, i.e. migration, proliferation, quiescence and apoptosis – now, however, for each of the five different glioma cell clones. We again implement the concept of ‘dichotomy’ for glioma cells, first put forward by [36] which argues on the basis of mounting experimental data that migration and proliferation are mutually exclusive behaviors that can happen in sequence, yet hardly at the same time in the same cell. Using breast cancer cells, Dittmar et al. [15] discovered that PLCγ is activated transiently during cell migration. Building on this experimental data, Athale et al. [1, 2] and Zhang et al. [3] employ a PLCγ threshold (σPLC) to model a hypothesized biological switching behavior in that PLCγ is activated to a greater extent during migration and more gradually during proliferation. Thus, the migration potential is assessed by a cell evaluating the following function:
| (14) |
where Mn is the migration potential that equals the change in concentration of active PLCγ over time and n is the cell number. Once Mn is greater than σPLC, the cell chooses a migratory phenotype, otherwise it undergoes proliferation. We note that there are three possibilities that the cell enters the reversible quiescent state: (1) the cell is unable to find an empty location to migrate to or proliferate into; or (2) the migration potential (Mn) is less than σPLC and ppTGFα – EGFR _ s is less than σEGFR ; or, (3) the glucose concentration around the cell drops to critically low values. If the on-site glucose concentration diminishes even further, the cell enters an apoptotic state [32].
3.2. Molecular environment
The sub-cellular setup is described in detail in [3]. Here, we therefore only briefly summarize this molecular environment, focus on its modifications, and note that the model’s intracellular workflow is depicted in Figure 3.(a). Specifically, each cell is equipped with an EGFR gene-protein interaction network shown in Figure 3.(b), which is composed of 14 molecular species in addition to the five molecular species involved in our simplified cell cycle representation, as listed in Table 3. These molecular species interact with each other according to mass balance equations, denoted by the general form:
Figure 3.

(a) The cancer cell’s sub-cellular workflow that determines its phenotypic output. (b) The EGFR gene-protein interaction network (see text for details).
Table 3.
Symbols of the EGFR gene-protein interaction network, and cell cycle module, taken from the literature[3].
| Symbol | Variable |
|---|---|
| X1 | TGFα extracellular protein |
| X2 | EGFR cell surface receptor |
| X3 | Dimeric TGFα – EGFR cell surface complex |
| X4 | Phosphorylated active dimeric TGFα – EGFR cell surface complex |
| X5 | Cytoplasmic inactive dimeric TGFα – EGFR complex |
| X6 | Cytoplasmic EGFR protein |
| X7 | Cytoplasmic TGFα protein |
| X8 | EGFR RNA |
| X9 | TGFα RNA |
| X10 | PLCγ inactive , Ca-bound |
| X11 | PLCγ active, phosphorylated, Ca-bound |
| X12 | Nucleotide pool |
| X13 | Glucose cytoplasmic |
| X14 | Glucose extracellular |
| X15 | cdh1-APC complex |
| X16 | cyclin-CDK |
| X17 | Mass of the cell |
| X18 | Protein p27 |
| X19 | RBNP |
| (15) |
where Xi is the mass of ith (i=1-14) molecules comprising the EGFR network and αi, βi(i=1-14) are the rate of synthesis and degradation rate of EGFR pathway, respectively. Also, Xi(i=15-19) molecules are the components of the cell cycle and αi, βi(i=15-19) are the coefficients of the cell cycle module. The values of parameters and constants are listed in [3]. As an important extension of our previous works, a proliferation process has now been explicitly integrated into the model in that more aggressive cell clones are associated with a shorter cell doubling time.
4. RESULTS
Our code is implemented in Java (Sun Microsystems, Inc., USA), combined with in-house developed classes for representing molecules, reactions and multi-receptors as a set of hierarchical objects. Running the simulation 10 times with different random normal distribution, σg, of glucose (Eq. 2), the algorithm requires a total of 70 hrs 46 min of CPU time on a computer with an IBM Bladecenter machine (dual-processor 32-bit Xeons ranging from 2.8-3.2GHz w/2.5GB RAM) and Gigabit Ethernet. Each node runs Linux with a 2.6 kernel and Sun’s J2EE version 1.5.
Employing a multi-level growth model, our analysis spans several scales of interest in starting with the overall, macroscopic behavior followed by the multicellular population patterns before focusing on the distinct impact molecular-level dynamics have on microscopic cell phenotypes.
Volumetric tumor growth dynamics
We measure the tumor system’s [total] volume by counting the number of lattice sites occupied by a tumor cell regardless of its phenotype, hence lumping together both proliferative- and migratory-driven expansion. Figure 4 shows the tumor’s volumetric increase over time for the 10 simulation runs.
Figure 4.

The volume of the tumor system (y-axis) over time (x-axis). Shown are mean values of 10 simulation runs with random standard deviation (grey) of the glucose concentration at a range between 50 and 60 nmol/lattice site.
To achieve a higher spatial resolution of analysis, we divide the macroscopic tumor into three microscopic regions, sectioning the distance between the tumor and the nutrient source such as shown in Figure 5.(a): region 1 is closest to the nutrient source, region 3 is farthest from the nutrient source, with region 2 being located in between.
Figure 5.

(a) The schematic shows the separation of the tumor into three regions (dotted lines) with varying distance to the nutrient source (black circle in Cube 4; compare with Fig. 1). (b) Depicted is the Shannon Index (y-axis) over time (x-axis) for these three distinct regions. Shown is the result of 10 runs with standard deviation.
Tumor heterogeneity
In an attempt to quantify clonal heterogeneity we employ the so-called Shannon Index which is defined as where pi is the frequency of clone i within the tumor [37]. Figure 5.(b) displays this index for region 1, 2, and 3 at each time step. While the indices for all three regions generally increase (i.e., exhibit more clonal heterogeneity) region 1 experiences an unexpected drop around t = 100, which indicates the emergence of a more homogenous sub-section prior to a gain of clonal diversity similar to that of the other two geographic sub-regions.
Visualizing this type of emergent heterogeneity by orienting us on curve-crossing points seen in Figure 5.(b), we display in Figure 6.(a)-(c) representative 3D snapshots of the tumor at consecutive time points t = 105, 180 and 230. As one would expect from a chemotaxis-driven search, the tumor overall expands towards the location of the nutrient source (compare with Figure 1).
Figure 6.

3D snapshots of the tumor system at time step t = 100 (a), t = 180 (b), t = 230 (c). The red circle depicts the location of the nutrient source (compare with Fig. 1). Note, the light and dark green colors represent cells of clone A in their proliferation state and migration state, respectively; light and dark blue represent cells of clone B in proliferation and migration states; light and dark yellow represent cells of clone C in proliferation and migration state; light and dark purple represent cells of clone D in proliferation and migration states; light and dark red represent cells of clone E in proliferation and migration states. Finally, light and dark grey represent cells in the quiescence and apoptosis states, respectively, for clones A-E.
Expansion rate per tumor region
To support this impression quantitatively, we measure the expansion rate for each sub-region by computing the average expansion radius for each region based on its center of mass. The results show that tumor region 1, i.e., closest to the nutrient source, expands much faster than regions 2 and 3 that are farther from the nutrient source (Figure 7). The lesser expansion rate of region 2 (versus region 3) is due to the fact that cells in region 2 find fewer empty locations to choose from.
Figure 7.
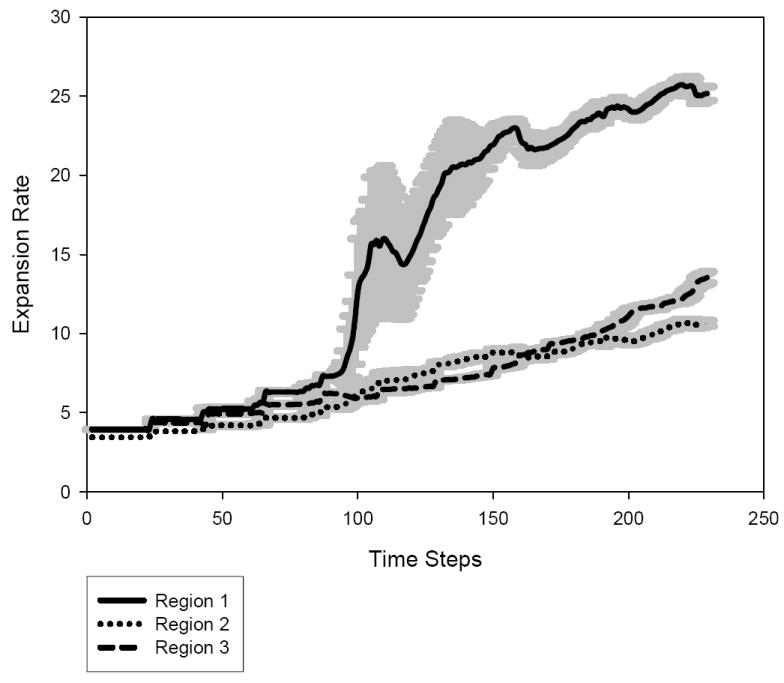
The expansion rate (y-axis) of regions 1, 2 and 3 over time (x-axis).
Expansion rate per tumor clone
The next question to address is then how much of that regional specificity is due to its prevailing clonal population and as such we measure the expansion rate for clone A, B, C, D and E at each time step by computing the average expansion radius for each clone based on the center of each clone. From Figure 8 one can see that clone E (with the highest EGFR density per cell) exhibits the highest expansion rate increase. In contrast, although clone A and B (with lower EGFR density) originate first, and thus also start to expand much earlier than clone C, D and E, these two lower malignant clones keep a much smaller expansion rate for most of the simulation.
Figure 8.

The expansion rate (y-axis) of clone A, B, C, D and E over time (x-axis).
So far, the results support the notion that a higher density of the more aggressive clone E is responsible for the higher expansion rate increase in the tumor region that is closest to the nutrient source. This therefore warrants a more detailed look into the phenotypic dynamics of the cancerous clones in general, and of clone E in particular.
Phenotypic spectrum per tumor clone
Turning then to the microscopic analysis level by monitoring the phenotypic fractions of clone A, B, C, D and E at each time step (Figure 9. (a)-(e)) it is evident that clones with higher EGFR density are eventually comprised of a larger migratory fraction, while exhibiting a smaller proliferation and quiescence cell population. Specifically, clone E has the largest and most sustained migratory cell population, and, as the curve shows, the ‘population’ crossover between a more stationary, proliferation-dominated to an expansive, migration-dominated clone happens earlier than in the other, less aggressive tumor clones. We also note that, qualitatively, the fluctuations in the curves increase from a fairly periodic pattern in the lower malignant clones A and B, to a much less regular, ‘noisy’ pattern in the higher malignant clones.
Figure 9.


The phenotypic spectrum (y-axis) for clone (a) A, (b) B, (c) C, (d) D and (e) E over time (x-axis).
Molecular phenotype-switching profiles
Moving now to the sub-cellular level, and building on our previous study [3], we use a heatmap display to visualize the percentage change of each molecular component of the implemented EGFR network (Figure 3. (b)) when the cells switch their phenotype from migration to proliferation or from proliferation to migration. We focus on time points, t =200 and 230, i.e. when the simulation begins to show sustained migration for most of the clones and again, when the run is almost completed. From Figure 10 it is evident that no phenotype switching signature is exactly alike. That is, differences exists between time points, phenotype switches, and geographic regions. However, there are also some similarities as for most cases, the signals for dimericTGFα – EGFR cell surface complex (X3), phosphorylated active dimeric TGFα – EGFR cell surface complex (X4), cytoplasmic inactive dimeric TGFα – EGFR complex (X5), cytoplasmic EGFR protein (X6) and Ca-bound inactive PLCγ (X10) experience a more profound dynamic change for each region.
Figure 10.
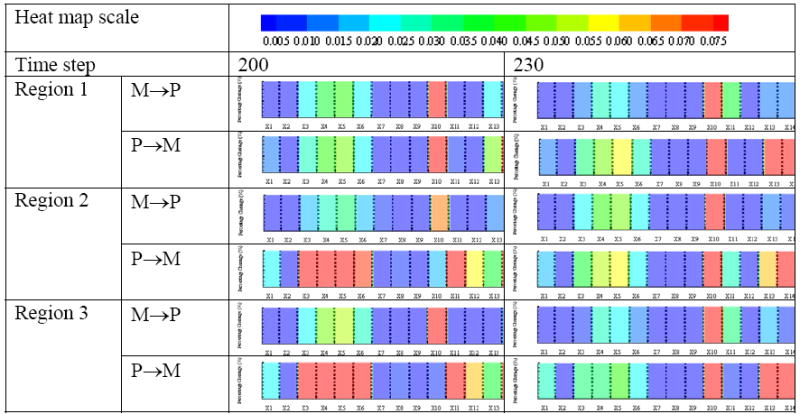
Percentage change of each EGFR network component (compare with Fig. 3(b)) combined to molecular signatures and represented as heatmaps, for the three geographic tumor regions, at time step 200 and 230, respectively. (Note: M → P = phenotypic switch from migration to proliferation; P → M = from proliferation to migration [3]; color scale represents percentage change: e.g., 0.005 equals 0.5%).
5. DISCUSSION & CONCLUSIONS
In here, we present an expansion of our 3D multi-scale agent-based brain tumor model that has now been extended to (1) also incorporate an element of genetic instability to simulate glioma progression and to analyze its impact across multiple scales. Building on our previous works [1-3], this model not only encompasses molecular, microscopic and macroscopic scales of observation, but now also integrates (2) both, cell doubling time and cell cycle into the cells’ proliferation module. (3) This model also simulates the impact of chemoattractants on cancer cell adhesion and migration rate. In the following, we discuss the results in more detail.
The tumor region adjacent to a blood vessel representing nutrient source (i.e., region 1) harbors early on the highest clonal heterogeneity (Figure 5.(b)), reflecting the spatio-temporal output of the implemented linear progression path. However, around time step t = 100 this geographic ‘tip’ region (Figure 6.(a)-(c)) becomes increasingly homogeneous due to a temporary competitive advantage of the most aggressive clone E with regards to its chemo-sensing ability and high spatial expansion rate. During a period that is marked by variability across runs (increasing fluctuations in standard deviation), clone E prevails in its quest to move fastest into the direction of “(least resistance,) most permission and highest attraction” [20], and, in the process, impacting the spatio-temporal patterns of the entire tumor system.
However, the micro-environmental conditions closer to the core of the tumor, i.e. for cells in regions 2 and 3 are less selective for clone E and thus continuous tumor progression yields a sustained increase in the Shannon Index that eventually even exceeds the peak value for region 1. One can argue that, other than region 1, regions 2 and 3 allow for an element of temporary coexistence (if not cooperation) between the clones. Since regions 2 and 3 together add up to a larger volume than region 1 alone, this finding corresponds well with another recent claim of cancer cell cooperation fostering tumorigenesis [38], and also with the results reported by [37] on esophagus cancer which indicated that clonal heterogeneity is a greater risk factor for progression to cancer than the expansion of a homogeneous clone with a low Shannon Index value. This seems confirmed with our own results as clone E’s dominance of region 1 is relatively short-lived with the heterogeneity index soon returning to values comparable to the two proximal tumor regions. The question arises then as to what precisely are the effects of such clonal heterogeneity on tumor growth dynamics? First, due to their higher density of EGF receptors per cell, clones C, D and primarily E exhibit an increased expansion rate (Figure 8) over clones A and B. Correspondingly, Figure 9 confirms that these tumor clones with higher EGFR density switch earlier to an invasive phenotype-dominated cell population that operates with a larger fraction of migratory cells, yet with lesser proliferative and quiescent cells. Our in silico model shows that higher EGFR expression leads to faster expansion of tumor areas that harbor more such aggressive cell populations, in areas of nutrient abundance. This, in turn, will result in overall growth asymmetries (see region 1, Figure 7), i.e., findings that taken together correspond well with reported experimental and clinical results [17, 29, 30].
Taking advantage of our algorithm’s multi-scale design we can analyze the molecular composition of the gene-protein interaction network at the location and time when the cell transitions from one phenotype to another. Specifically, Figure 10 demonstrates that there are both spatially and temporally distinct molecular signatures that lead to the cells’ phenotypic switch. Cautiously extrapolated to an orders of magnitude more complex experimental situation, one wonders how much more robust in vitro and in vivo expression profiles would have to be within a patient’s tumor (let alone across an entire patient population) to warrant the single site and time point assessments that are commonly used for functional genomics in clinics. In fact, applying a global genomic analysis Maher et al. [39] recently showed wide-spread differences between primary and secondary glioblastoma entities and reported that the latter group (which develops over multiple years from lower malignant astrocytomas [40]) is heterogeneous in its molecular pathogenesis. Our findings should not be misinterpreted as questioning the value of such high-throughput data, rather, our in silico results argue that assessing the molecular profile repeatedly, and at different sites of the tumor, should add predictive power. Interestingly, we found that at time step 200 the percentage changes of some molecules (i.e., X3, X4, X5, X6 and X10) in region 2 and 3 is more substantial than in region 1 regardless of the switch per se. The reason for this is that the higher EGFR density in clones C-E results in higher concentrations of other downstream molecules as well. Hence, the relative molecular fluctuations should be lesser in clones C, D and E than in clones A and B. And, since region 1 is mostly comprised of cells derived from clones C-E, its molecular composite signature appears to be more preserved between the time points than that of the other two regions. However, over time many more aggressive cells originate from clones A and B also in the more proximal tumor regions, and we see therefore eventually a somewhat more homogeneously aggressive pattern where regions 2 and 3 start to resemble the distant region 1. As such, by monitoring the molecular signature dynamics per region, one can at least in silico visualize the gradual tumorigenic evolution of sub-regions of the tumor, in an effort to better understand how they may contribute to multicellular growth behavior.
Despite these considerable extensions, our modeling platform of course has still a number of shortcomings that can and should be addressed in future works. For example, we currently rely on a fixed mutation rate between each clone and mutations only occur linearly from A to E, without any non-linear ‘shortcuts’ and without assigning a different weight to specific mutations as well as we scaled some microscopic parameters due to the insufficient computational capability. In subsequent research, we intend to implement a dynamical mutation rate that depends both on intrinsic and extrinsic, or microenvironmental factors. Other extensions on the molecular level will rely on sensitivity analysis, or may include a more explicit treatment of vascular architecture. Nonetheless, this work significantly enhances our previously introduced platform [1-3] by including the element of genetic instability and integrating both cell cycle and cell doubling time into the cells’ proliferation process. Given the fact that we begin to be able to validate some of the model’s predictions with experimental studies, we firmly believe that this type of interdisciplinary approach holds significant promise to help improve our understanding of brain cancer progression and its impact on the tumor system’s regional and global growth dynamics.
Acknowledgments
This work has been supported in part by NIH grants CA 085139 and CA 113004 (The Center for the Development of a Virtual Tumor, CViT at http://www.cvit.org) and by the Harvard-MIT (HST) Athinoula A. Martinos Center for Biomedical Imaging and the Department of Radiology at Massachusetts General Hospital.
Abbreviations
- ECM
extracellular matrix
- EGF(R)
epidermal growth factor (receptor)
- MAPK
mitogen activated protein kinase
- PLCγ
phospholipase Cγ
- TGFα
transforming growth factor α
Footnotes
Publisher's Disclaimer: This is a PDF file of an unedited manuscript that has been accepted for publication. As a service to our customers we are providing this early version of the manuscript. The manuscript will undergo copyediting, typesetting, and review of the resulting proof before it is published in its final citable form. Please note that during the production process errors may be discovered which could affect the content, and all legal disclaimers that apply to the journal pertain.
References
- 1.Athale CA, Mansury Y, Deisboeck TS. Simulating the impact of a molecular ‘decision-process’ on cellular phenotype and multicellular patterns in brain tumors. J Theor Biol. 2005;233:469–481. doi: 10.1016/j.jtbi.2004.10.019. [DOI] [PubMed] [Google Scholar]
- 2.Athale CA, Deisboeck TS. The effects of EGF-receptor density on multiscale tumor growth patterns. J Theor Biol. 2006;238:771–779. doi: 10.1016/j.jtbi.2005.06.029. [DOI] [PubMed] [Google Scholar]
- 3.Zhang L, Athale CA, Deisboeck TS. Development of a three-dimensional multiscale agent-based tumor model: simulating gene-protein interaction profiles, cell phenotypes and multicellular patterns in brain cancer. J Theor Biol. 2007;244:96–107. doi: 10.1016/j.jtbi.2006.06.034. [DOI] [PubMed] [Google Scholar]
- 4.Carmeliet P, Jain RK. Angiogenesis in cancer and other diseases. Nature. 2000;407:249–257. doi: 10.1038/35025220. [DOI] [PubMed] [Google Scholar]
- 5.Sander LM, Deisboeck TS. Growth patterns of microscopic brain tumors. Phys Rev E Stat Nonlin Soft Matter Phys. 2002;66:051901. doi: 10.1103/PhysRevE.66.051901. [DOI] [PubMed] [Google Scholar]
- 6.Thorne RG, Hrabetova S, Nicholson C. Diffusion of epidermal growth factor in rat brain extracellular space measured by integrative optical imaging. J Neurophysiol. 2004;92:3471–3481. doi: 10.1152/jn.00352.2004. [DOI] [PubMed] [Google Scholar]
- 7.Chicoine MR, Silbergeld DL. Assessment of brain tumor cell motility in vivo and in vitro. J Neurosurg. 1995;82:615–622. doi: 10.3171/jns.1995.82.4.0615. [DOI] [PubMed] [Google Scholar]
- 8.Engstrom W. Differential effects of epidermal growth factor (EGF) on cell locomotion and cell proliferation in a cloned human embryonal carcinoma-derived cell line in vitro. J Cell Sci. 1986;86:47–55. doi: 10.1242/jcs.86.1.47. [DOI] [PubMed] [Google Scholar]
- 9.Fadda GC, Lairez D, Arrio B, Carton JP, Larreta-Garde V. Enzyme-catalyzed gel proteolysis: an anomalous diffusion-controlled mechanism. Biophys J. 2003;85:2808–2817. doi: 10.1016/S0006-3495(03)74704-3. [DOI] [PMC free article] [PubMed] [Google Scholar]
- 10.Goldbrunner RH, Haugland HK, Klein CE, Kerkau S, Roosen K, Tonn JC. ECM dependent and integrin mediated tumor cell migration of human glioma and melanoma cell lines under serum-free conditions. Anticancer Res. 1996;16:3679–3687. [PubMed] [Google Scholar]
- 11.Soon L, Mouneimne G, Segall J, Wyckoff J, Condeelis J. Description and characterization of a chamber for viewing and quantifying cancer cell chemotaxis. Cell Motil Cytoskeleton. 2005;62:27–34. doi: 10.1002/cm.20082. [DOI] [PubMed] [Google Scholar]
- 12.Habib S, Molina-Paris C, Deisboeck TS. Complex dynamics of tumors: modeling an emerging brain tumor system using a set of coupled reaction-diffusion equations. Physica A. 2003;327:501–524. [Google Scholar]
- 13.Castro M, Molina-Paris C, Deisboeck TS. Tumor growth instability and the onset of invasion. Phys Rev E Stat Nonlin Soft Matter Phys. 2005;72:041907. doi: 10.1103/PhysRevE.72.041907. [DOI] [PubMed] [Google Scholar]
- 14.Alarcon T, Byrne HM, Maini PK. A mathematical model of the effects of hypoxia on the cell-cycle of normal and cancer cells. J Theor Biol. 2004;229:395–411. doi: 10.1016/j.jtbi.2004.04.016. [DOI] [PubMed] [Google Scholar]
- 15.Dittmar T, Husemann A, Schewe Y, Nofer JR, Niggemann B, Zanker KS, Brandt BH. Induction of cancer cell migration by epidermal growth factor is initiated by specific phosphorylation of tyrosine 1248 of c-erbB-2 receptor via EGFR. Faseb J. 2002;16:1823–1825. doi: 10.1096/fj.02-0096fje. [DOI] [PubMed] [Google Scholar]
- 16.Sole RV, Deisboeck TS. An error catastrophe in cancer? J Theor Biol. 2004;228:47–54. doi: 10.1016/j.jtbi.2003.08.018. [DOI] [PubMed] [Google Scholar]
- 17.Steinbach JP, Klumpp A, Wolburg H, Weller M. Inhibition of epidermal growth factor receptor signaling protects human malignant glioma cells from hypoxia-induced cell death. Cancer Res. 2004;64:1575–1578. doi: 10.1158/0008-5472.can-03-3775. [DOI] [PubMed] [Google Scholar]
- 18.Boussouar F, Benahmed M. Epidermal growth factor regulates glucose metabolism through lactate dehydrogenase A messenger ribonucleic acid expression in cultured porcine Sertoli cells. Biol Reprod. 1999;61:1139–1145. doi: 10.1095/biolreprod61.4.1139. [DOI] [PubMed] [Google Scholar]
- 19.Smith HG. Reversing cancer: a journey from cancer to cure. International center for nutritional research, Inc; Langhorne, PA, USA: 2004. [Google Scholar]
- 20.Deisboeck TS, Berens ME, Kansal AR, Torquato S, Stemmer-Rachamimov AO, Chiocca EA. Pattern of self-organization in tumour systems: complex growth dynamics in a novel brain tumour spheroid model. Cell Prolif. 2001;34:115–134. doi: 10.1046/j.1365-2184.2001.00202.x. [DOI] [PMC free article] [PubMed] [Google Scholar]
- 21.Mansury Y, Kimura M, Lobo J, Deisboeck TS. Emerging patterns in tumor systems: simulating the dynamics of multicellular clusters with an agent-based spatial agglomeration model. J Theor Biol. 2002;219:343–370. doi: 10.1006/jtbi.2002.3131. [DOI] [PubMed] [Google Scholar]
- 22.Mansury Y, Deisboeck TS. The impact of “search precision” in an agent-based tumor model. J Theor Biol. 2003;224:325–337. doi: 10.1016/s0022-5193(03)00169-3. [DOI] [PubMed] [Google Scholar]
- 23.Mansury Y, Deisboeck T. Simulating the time series of a selected gene expression profile in an agent-based tumor model. Physica D. 2004;196:193–204. [Google Scholar]
- 24.Schoeberl B, Eichler-Jonsson C, Gilles ED, Muller G. Computational modeling of the dynamics of the MAP kinase cascade activated by surface and internalized EGF receptors. Nat Biotechnol. 2002;20:370–375. doi: 10.1038/nbt0402-370. [DOI] [PubMed] [Google Scholar]
- 25.Araujo RP, Petricoin EF, Liotta LA. A mathematical model of combination therapy using the EGFR signaling network. Biosystems. 2005;80:57–69. doi: 10.1016/j.biosystems.2004.10.002. [DOI] [PubMed] [Google Scholar]
- 26.Tyson JJ, Novak B. Regulation of the eukaryotic cell cycle: molecular antagonism, hysteresis, and irreversible transitions. J Theor Biol. 2001;210:249–263. doi: 10.1006/jtbi.2001.2293. [DOI] [PubMed] [Google Scholar]
- 27.Swetina J, Schuster P. Self-replication with errors. A model for polynucleotide replication. Biophys Chem. 1982;16:329–345. doi: 10.1016/0301-4622(82)87037-3. [DOI] [PubMed] [Google Scholar]
- 28.Mansury Y, Deisboeck T. Simulating ‘structure-function’ patterns of malignant brain tumors. Physica A. 2004;331:219–232. [Google Scholar]
- 29.Lund-Johansen M, Bjerkvig R, Humphrey PA, Bigner SH, Bigner DD, Laerum OD. Effect of epidermal growth factor on glioma cell growth, migration, and invasion in vitro. Cancer Res. 1990;50:6039–6044. [PubMed] [Google Scholar]
- 30.Westermark B, Magnusson A, Heldin CH. Effect of epidermal growth factor on membrane motility and cell locomotion in cultures of human clonal glioma cells. J Neurosci Res. 1982;8:491–507. doi: 10.1002/jnr.490080236. [DOI] [PubMed] [Google Scholar]
- 31.Moskal TL, Huang S, Ellis LM, Fritsche HA, Jr, Chakrabarty S. Serum levels of transforming growth factor alpha in gastrointestinal cancer patients. Cancer Epidemiol Biomarkers Prev. 1995;4:127–131. [PubMed] [Google Scholar]
- 32.Freyer JP, Sutherland RM. Regulation of growth saturation and development of necrosis in EMT6/Ro multicellular spheroids by the glucose and oxygen supply. Cancer Res. 1986;46:3504–3512. [PubMed] [Google Scholar]
- 33.Forsten KE, Lauffenburger DA. Autocrine ligand binding to cell receptors. Mathematical analysis of competition by solution “decoys”. Biophys J. 1992;61:518–529. doi: 10.1016/S0006-3495(92)81856-8. [DOI] [PMC free article] [PubMed] [Google Scholar]
- 34.Shrivastava V, Mishra AK, Dwarakanath BS, Ravindranath T. Enhancement of radionuclide induced cytotoxicity by 2-deoxy-D-glucose in human tumor cell lines. JCRT. 2006;2:57–64. doi: 10.4103/0973-1482.25851. [DOI] [PubMed] [Google Scholar]
- 35.Hanahan D, Weinberg RA. The hallmarks of cancer. Cell. 2000;100:57–70. doi: 10.1016/s0092-8674(00)81683-9. [DOI] [PubMed] [Google Scholar]
- 36.Giese A, Loo MA, Tran N, Haskett D, Coons SW, Berens ME. Dichotomy of astrocytoma migration and proliferation. Int J Cancer. 1996;67:275–282. doi: 10.1002/(SICI)1097-0215(19960717)67:2<275::AID-IJC20>3.0.CO;2-9. [DOI] [PubMed] [Google Scholar]
- 37.Maley CC, Galipeau PC, Finley JC, Wongsurawat VJ, Li X, Sanchez CA, Paulson TG, Blount PL, Risques RA, Rabinovitch PS, Reid BJ. Genetic clonal diversity predicts progression to esophageal adenocarcinoma. Nat Genet. 2006;38:468–473. doi: 10.1038/ng1768. [DOI] [PubMed] [Google Scholar]
- 38.Axelrod R, Axelrod DE, Pienta KJ. Evolution of cooperation among tumor cells. Proc Natl Acad Sci USA. 2006;103:13474–13479. doi: 10.1073/pnas.0606053103. [DOI] [PMC free article] [PubMed] [Google Scholar]
- 39.Maher EA, Brennan C, Wen PY, Durso L, Ligon KL, Richardson A, Khatry D, Feng B, Sinha R, Louis DN, Quackenbush J, Black PM, Chin L, DePinho RA. Marked genomic differences characterize primary and secondary glioblastoma subtypes and identify two distinct molecular and clinical secondary glioblastoma entities. Cancer Res. 2006;66:11502–11513. doi: 10.1158/0008-5472.CAN-06-2072. [DOI] [PubMed] [Google Scholar]
- 40.Ohgaki H, Kleihues P. Genetic pathways to primary and secondary glioblastoma. Am J Pathol. 2007;170:1445–1453. doi: 10.2353/ajpath.2007.070011. [DOI] [PMC free article] [PubMed] [Google Scholar]
- 41.Burden RL, Faires JD. Numerical Analysis. Thomson Higher Education; Belmont, CA: 2005. [Google Scholar]