

Abstract
OBJECTIVES
To determine whether low levels of testosterone, sex hormone binding globulin (SHBG), insulin-like growth factor-1 (IGF-1), and dehydroepiandrosterone sulfate (DHEAS) and high levels of cortisol and leptin would be associated with metabolic syndrome (MS).
DESIGN
Cross-sectional.
SETTING
Population-based sample of older Italian men.
PARTICIPANTS
Four hundred fifty-two men aged 65 and older enrolled in the Invecchiare in Chianti (InCHIANTI) study.
MEASUREMENTS
Complete data on testosterone, cortisol, DHEAS, SHBG, fasting insulin, IGF-1 and leptin. MS was defined according to Adult Treatment Panel III criteria.
RESULTS
MS was present in 73 men (15.8% of the sample). After adjusting for confounders, total testosterone (P<.05) and log (SHBG) (P<.001) were inversely associated, whereas log (leptin) was positively associated with MS (P<.001). Independent of age, log (SHBG) was positively associated with high-density lipoprotein cholesterol (P<.05) and negatively associated with abdominal obesity (P<.001) and triglycerides (P<.001). Log (leptin) was significantly associated with each component of MS. Cortisol, DHEAS, free and bioavailable testosterone, and IGF-1 were not associated with MS. Having three or more hormones in the lower (for hormones lower in MS) or the upper (for hormones higher in MS) quartile was associated with three times the risk of being affected by MS (odds ratio =2.8, 95% confidence interval =1.3–6.9) (P=.005), compared with not having this condition.
CONCLUSION
Total testosterone and SHBG are negatively and leptin is positively associated with MS in older men. Whether specific patterns of hormonal dysregulation predict the development of MS should be tested in longitudinal studies.
Keywords: SHBG, testosterone, hormonal dysregulation, older men, metabolic syndrome
Metabolic syndrome (MS) is the complex clustering of several interrelated physiological and metabolic alterations, including insulin resistance, dyslipidemia, abdominal fat, and a proinflammatory, prothrombotic state. The National Cholesterol Education Program’s Adult Treatment Panel III (ATP III) report has proposed a set of measures to assess the presence of MS as the clustering of three or more established cardiovascular risk factors, including low high-density lipoprotein cholesterol (HDL-C) and high fasting glucose, waist circumference, triglyceride levels, and blood pressure.1,2 MS is a strong risk factor for cardiovascular disease and type II diabetes mellitus.3,4 Recent reports estimate that MS affects 22% to 24% of the U.S. population, with a prevalence that increases with age and is higher in men than women.2,4
There is increasing evidence that age-related hormonal changes might play a relevant role in the development of MS in men. Low androgen levels (testosterone and dehydroepiandrosterone sulfate (DHEAS)) have been linked with MS or its components.5–8 Moreover, induction of hypogonadism in men with gonadotropin-releasing hormone analogs is associated with central obesity and insulin resistance.9 Recent studies also suggest that sex hormone binding globulin (SHBG) may contribute to the pathophysiology of MS, although the mechanism has not been fully elucidated.5–7,10 In addition, recent evidence suggests that hyperactivation of stress hormones (such as cortisol), a decrease in insulin-like growth factor-1 (IGF-1), and excessive production of leptin may be important.11–13
Most studies examining the relationship between hormonal levels and MS have not focused on older populations and have investigated one specific hormone, ignoring possible multiple hormonal interactions and potential synergistic effects in the genesis of MS. Thus, whether age-associated hormonal changes increase susceptibility to MS in older individuals has not been fully elucidated. Using data from a population-based sample of older adults, the current study tested the hypothesis that low levels of testosterone, IGF-1, and DHEAS and high levels of cortisol and leptin are associated with MS in a population-based sample of older men. Furthermore, the hypothesis that multiple hormonal dysregulation is associated with a particularly high susceptibility to MS was tested.
METHODS
Study Population
The InCHIANTI is an epidemiological study conducted on a representative sample of the population living in the Tuscany region of Italy.
Overall, 1,260 persons (543 men, 726 women) aged 65 and older were randomly selected from the population registry and were eligible for the study. Of these, 1,154 consented to participate in the InCHIANTI Study, and 1,055 donated a blood sample.
Information on estradiol was not available for women, and the effect of testosterone on MS is completely different in women. Hence, all of the women (n =596) were excluded and the analysis was limited to men. Of the remaining 459 men, 452 (83.2% of the 534 eligible) (age range 65–96) had complete data on testosterone, cortisol, DHEAS, total IGF-1, SHBG, fasting insulin, leptin, interleukin-6 (IL-6), and albumin.
The Italian National Institute of Research and Care of Aging institutional review board ratified the study protocol.14
Definition of MS
In accordance with ATP-III criteria, the diagnosis of MS was established as the presence of three or more of the following: fasting blood glucose levels of 126 mg/dL or higher, fasting serum triglycerides of 150 mg/dL or higher, serum HDL-C less than 40 mg/dL, blood pressure of 130/85 mmHg or higher (or the use of antihypertensive medications), and waist circumference greater than 102 cm.15
Waist circumference was measured at the midpoint between the lower rib margin and the iliac crest (normally umbilical level). Weight and height were measured using standard techniques. Body mass index was calculated as weight (kg) divided by height squared (m2). Baseline blood pressure was recorded using a standard mercury sphygmomanometer. All blood pressure measurements were performed with the participant in a supine position on three occasions separated by intervals of 2 minutes; the average of the last two measures was used in the analysis.
Hormone Assays
Fasting blood samples were drawn between 7:00 a.m. and 8:00 a.m. and were stored at −80°C until analysis. Cortisol, DHEAS, total testosterone, and total IGF-1 were assayed using commercial kits (Diagnostic Systems Laboratories, Webster, TX). For DHEAS, the minimum detection limit was 1.7 μg/dL; intraassay coefficients of variation (CVs) for three different concentrations (low, medium, high) ranged between 4.1% and 5.3%, and interassay CVs ranged between and 4.6% and 7.0%. For total testosterone, the minimum detection limit was 0.03 nmol/L; intraassay and interassay CVs for three different concentrations were less than 9.6% and less than 9.1%, respectively.16 Total IGF-1 was measured using immunoradiometric assay. Interassay and intraassay CVs for three concentrations were all less than 10%. SHBG was measured using radioimmunoassay (Diagnostic Products Corporation, Los Angeles, CA) with a minimum detected concentration of 0.04 nmol/L and inter-assay and intraassay coefficients of variation for three concentrations less than 6.9% and less than 3.6%, respectively.
Concentrations of free and bioavailable testosterone were calculated using the Vermeulen formula.17 Plasma insulin level was determined using a double-antibody, solid-phase radioimmunoassay (intraassay coefficient of variation 3.1 ± 0.3%; Sorin Biomedica, Milan, Italy). Cross-reactivity with human proinsulin was 0.3%.18 Serum leptin was determined in duplicate using an enzyme-linked immunosorbent assay kit (ELISA; Human Endocrine LINCOplex Kit, LINCO Research, Inc., St. Charles, MO).19 The intra- and interassay coefficients of variation ranged from 2.6% to 6.2%.
Serum glucose level was determined using an enzymatic colorimetric assay (Roche Diagnostics, Mannheim, Germany) and a Roche-Hitachi 917 analyzer. Serum IL-6 was measured using high-sensitivity ELISA (BIOSOURCE, Camarillo, CA).
A commercial enzymatic test was used for determining serum HLD-C and triglyceride concentrations (Roche Diagnostics). The interassay CV was less than 3.8% for HDL-C and less than 2.5% for triglycerides.18
Assessment of Covariates
Physical activity during the year before the interview was coded as sedentary (completely inactive or light-intensity activity <1 h/wk), light physical activity (light-intensity activity 2–4 h/wk), or moderate–high physical activity (light activity ≥5 h/wk or moderate activity ≥1–2 h/wk). Daily alcohol (g) intake was estimated using the European Prospective Investigation into Cancer and Nutrition Food Frequency Questionnaire.20 Smoking was assessed by self-report and expressed as pack-years ((packs smoked per day)×(years of smoking)). Social demographic variables included educational level.
Statistical Analysis
Because of skewed distributions, log-transformed values for SHBG, IL-6, DHEAS, bioavailable and free testosterone, and insulin were used in the analyses and subsequently back-transformed for reporting. Differences in hormonal levels between participants with and without MS were tested using age-adjusted analysis of covariance. SHBG and testosterone levels were divided in quartiles to better describe their relationship with MS. Differences in the prevalence of MS according to specific hormone quartiles were formally tested using Pearson chi-square tests. Generalized linear models were used to test the relationship between hormones and each component of MS after adjustment for age, smoking, alcohol consumption, and physical activity in the year before the visit; log (IL-6); and log (insulin). Hormonal dysregulation was defined as serum level in the lower quartile for hormones that were negatively associated with MS (total testosterone, SHBG, cortisol) or serum level in the upper quartile for hormones that were positively associated with MS (leptin, IGF-1, DHEAS). A hormonal dysregulation score ranging from 0 to 6 was expressed as the number of hormones that were dysregulated in a specific participant. Logistic regression models were used to assess the risk of MS in participants with different hormonal dysregulation scores. The SAS 8.2 statistical package (SAS Institute, Inc., Cary, NC) was used for all analyses.
RESULTS
The mean age of the sample was 75 (range 65–96). Table 1 shows the general characteristics of the study population, according to the presence or absence of MS criteria. Single components of MS, as well as covariates, were included in the multivariate analysis.
Table 1.
Characteristics of the General Population According to Presence of Metabolic Syndrome (MS) in Older Men
| Criteria for MS |
|||
|---|---|---|---|
| Characteristic | <3 (n =389) | ≥3 (n =73) | P-value* |
| Age, mean ± SD | 75 ±7 | 74 ±6 | .74 |
| Body mass index, kg/m2, mean ±SD | 26 ±3 | 30 ±3 | <.001 |
| High-density lipoprotein cholesterol, mg/dL, mean ±SD | 53 ±13 | 39 ±8 | <.001 |
| Triglycerides, mg/dL, mean ±SD | 115 ±57 | 208 ±101 | <.01 |
| Blood glucose, mg/dL, mean ±SD | 94 ±25 | 115 ±34 | .04 |
| Waist circumference, cm, mean ±SD | 93 ±8.3 | 103.4 ±8.2 | <.001 |
| Waist circumference >102 cm, n (%) | 41 (11) | 45 (63) | .45 |
| Blood pressure >130/85 mmHg, n (%) | 195 (51) | 64 (87) | .13 |
| Interleukin-6, pg/mL, median (IQR) | 1.6 (1.7) | 1.3 (1.1) | .3 |
| Insulin, mIU/L, median (IQR) | 9.4 (7.1) | 11.1 (9.5) | <.001 |
| Physical activity in previous year, h/wk, mean ±SD | 1.9 ±0.5 | 1.89 ±0.4 | .55 |
| Smoking, packs/y, mean ±SD | 24 ±24 | 30 ±28 | .06 |
| Alcohol intake, g/d, mean ±SD | 24 ±19 | 22 ±20 | .32 |
| Formal education, years, mean ±SD | 6 ±4 | 6 ±3 | .32 |
Differences in parameters between patients with and without MS were tested using age-adjusted analysis of covariance.
SD =standard deviation; IQR =interquartile range.
Overall, 73 male participants (15.8%) had three or more recognized features of MS. Participants with MS had higher insulin levels and lower alcohol intake. Low HDL-C and high triglycerides, glucose values, and waist circumference were the main features indicating MS, whereas no difference was observed in blood pressure (Table 1). Participants with MS had lower levels of total testosterone and SHBG but higher levels of plasma leptin (Table 2). After adjusting for multiple confounders, including age, smoking, alcohol intake, and physical activity in the year before the visit, log (IL-6), log (insulin), total testosterone (P<.05), and log (SHBG) (P<.001) were negatively associated with MS, and log (leptin) was positively associated with MS (P=.006). No significant association was found between MS and cortisol, DHEAS, free and bioavailable testosterone, or total IGF-1 (Table 3).
Table 2.
Hormonal Parameters According to Presence of Metabolic Syndrome (MS) in Older Men
| Criteria for MS |
|||
|---|---|---|---|
| Parameter | <3 (n =389) | ≥(n =73) | P-value* |
| Total testosterone, ng/dL, mean ±standard deviation | 433 ±129 | 399 ±139 | .03 |
| Bioavailable testosterone, ng/dL, median (IQR) | 86.6 (50.7) | 98.3 (46.1) | .17 |
| Free testosterone, ng/dL, median (IQR) | 3.8 (2.2) | 4.2 (1.9) | .22 |
| Sex hormone binding globulin, nmoL/L, median (IQR) | 104.0 (62.2) | 83.6 (41.6) | <.001 |
| Dehydroepiandrosterone sulphate, μg/dL, median (IQR) | 66.4 (66.5) | 71.1 (78.4) | .98 |
| Cortisol, nmol/L, median (IQR) | 356.4 (183.2) | 349.9 (184.6) | .16 |
| Insulin-like growth factor-1, ng/mL, median (IQR) | 124.8 (68.3) | 132.0 (69.4) | .13 |
| Leptin, ng/mL, median (IQR) | 4.2 (5.1) | 8.6 (6.6) | <.001 |
Differences in parameters between patients with and without MS were tested using age adjusted analysis of covariance.
IQR =interquartile range.
Table 3.
Multiple Linear Regression Models Evaluating the Relationship Between Metabolic Syndrome and Circulating Levels of Hormones in Older Men
| Variable | Estimate ±Standard Error | P-value |
|---|---|---|
| Total testosterone | −0.029 ±0.013 | <.05 |
| Log (bioavailable testosterone) | 0.019 ±0.029 | .50 |
| Log (free testosterone) | 0.016 ±0.029 | .57 |
| Log (sex hormone binding globulin) | −0.124 ±0.037 | <.001 |
| Log (cortisol) | −0.071 ±0.037 | .05 |
| Log (dehydroepiandrosterone sulphate) | −0.006 ±0.020 | .74 |
| Log (total insulin-like growth factor-1) | 0.029 ±0.370 | .40 |
| Log (leptin) | 0.007 ±0.002 | .006 |
Note: Each line refers to the result of a separate, fully adjusted (adjusted for age, smoking, alcohol, physical activity in the year before the visit, log (interleukin-6) and log (insulin) model.
Figures 1 and 2 show the number and percentage of participants with and without MS according to quartiles of SHBG and total testosterone. The percentage of participants with MS was significantly lower in participants in the higher quartiles of SHBG and total testosterone (P-trend<.001 and<.05, respectively).
Figure 1.
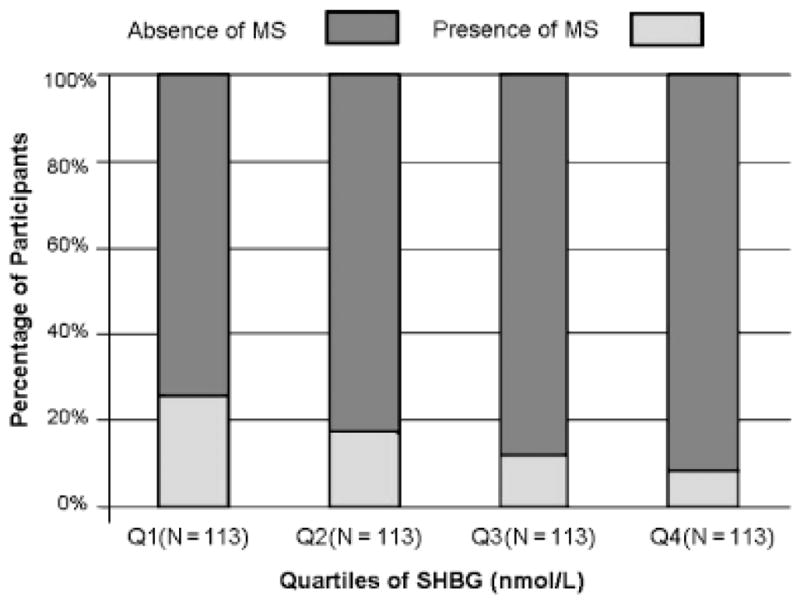
Sex hormone binding globulin (SHBG) and metabolic syndrome (MS). Percentage distribution of the participants (vertical axis) with (dark bars) and without (shaded bars) MS according to quartiles of SHBG (horizontal axis). Numbers of participants according to quartiles of SHBG are indicated within parentheses in the horizontal axis.
Figure 2.

Total testosterone and metabolic syndrome (MS). Percentage distribution of the participants (vertical axis) with (dark bars) and without (shaded bars) MS according to quartiles of total testosterone (horizontal axis). Numbers of participants according to quartiles of total testosterone are indicated within parentheses in the horizontal axis.
In age-adjusted analyses, total testosterone was positively associated with HDL-C (P=.04) but not with other components of MS. Log (SHBG) was positively associated with HDL-C (P<.001), negatively associated with triglycerides (P<.001) and waist circumference (P<.001), and not associated either way with blood pressure or glucose levels. Log (bioavailable testosterone) and log (free testosterone) were negatively associated with triglycerides (P<.001) and waist circumference (P<.001) but not with other components of MS.
Log (leptin) was negatively associated with HDL-C (P=.007) and positively associated with triglycerides (P<.001), waist circumference (P<.001), blood pressure (P=.03), and glucose levels (P=.02).
In the fully adjusted analysis (age, smoking, alcohol use, and physical activity in the year before the visit, log (IL-6), log (insulin)), log SHBG were positively associated with HDL-C (P<.05) and negatively associated with abdominal obesity (P<.001) and triglycerides (P<.001). No significant association was found between SHBG and glucose or blood pressure levels. Total testosterone levels were positively associated with HLD-C (P<.05) but not with other components of MS (data not shown). No significant independent association was found between cortisol, DHEAS, free and bioavailable testosterone, total IGF-1, and the individual components of MS.
Hormonal Dysregulation Score
A significant correlation was found (P-trend<.001) between the number of dysregulated hormones and the number of MS components. Adjusting for multiple confounders, participants with a hormonal score of three or more were three times as likely to be affected by MS as those with a hormonal score of 1 (one hormone in the worst quartile) (odds ratio =2.8, 95% confidence interval =1.3–6.9; P=.005).
DISCUSSION
In a representative sample of older Italian men, a negative relationship was found between total testosterone and SHBG and MS and a positive relationship between leptin and MS after adjusting for a number of potential confounders. Participants with dysregulation of three or more hormones were three times as likely to have MS. Some studies have suggested that age-associated decline in testosterone levels is associated with lower lean body mass and insulin resistance in older men.21
It is not completely understood whether changes in body composition are the cause or the effect of testosterone changes or both, although studies have found that severe obesity (but not mild obesity) is associated with low free and bioavailable testosterone levels.22 It was found that total testosterone, but not free and bioavailable testosterone, was associated with MS. These findings partially agree with some previous reports.5–7 One possible explanation for this discrepancy is that SHBG is mediating the relationship between testosterone and MS.23
Perhaps the most interesting finding of the current study was that SHBG was strongly and inversely related with MS and its components, namely HDL-C, triglycerides, and waist circumference.
This is the first evidence in an older male population of a possible independent effect of SHBG on MS, because previous studies were restricted to younger age groups.5–7 The fact that SHBG was more strongly correlated with MS than testosterone was somewhat unexpected, but it is not completely surprising. It cannot be excluded that differences between these two parameters could be related to the stability of each parameter in time.
It has been demonstrated that insulin levels influence SHBG concentration; in vitro studies in human hepatoma cell lines (HepG2) and in vivo observations, for example, during hyperinsulinemic euglycemic clamp studies, have documented the ability of insulin to negatively regulate the hepatic production of SHBG.23,24 However, even when insulin was considered as a confounder in the current analysis, the relationship between SHBG and MS remained statistically significant. These findings confirm previous reports that suggest that SHBG is an important marker of MS and type II diabetes mellitus independent of fasting insulin levels.25
Although the current study does not provide clues to the mechanisms by which SHBG may affect MS, SHBG may not be a mere transport protein. Despite failures to clone specific SHBG membrane receptors, signaling for SHBG has been detected in different tissues, including prostate, testis, breast, and liver and possibly in muscles.26,27 In the current study, SHBG levels were positively and independently associated with HDL-C (P<.001) and negatively associated with abdominal obesity (P<.001) and triglycerides (P<.001), suggesting that SHBG interferes with the synthesis of HDL-C through a mechanism that is not understood.28
The adipocyte-derived peptide leptin has been linked to adiposity and insulin resistance. It has been suggested that leptin contributes to the age-related risk of MS.29 There is evidence that aging is associated with increasing leptin levels in men, independent of changes in body composition.30 A strong and positive relationship was found between leptin and MS, as well as between leptin and each component of MS. The relationship between leptin and MS was maintained after adjustment for total testosterone, a potential modulator of leptin levels in older men. This is consistent with the data reported previously in elderly women.13
Stress and hyperactivation of the hypothalamic-pituitary-adrenal axis have been observed in patients with MS.11 Glucocorticoids regulate adipose tissue differentiation, function, and distribution and, when in excess, cause central obesity, which is one of the main features of MS.31 No evidence was found in the current study for differences in cortisol levels between subjects with and without MS, although serum cortisol levels do not necessarily reflect local adipose tissue cortisol.32
Low levels of DHEAS have been associated with insulin resistance and MS,6 and in some studies, dehydroepian-drosterone treatment has been shown to improve insulin sensitivity in older subjects.33,34 However, no significant relationship was found between DHEAS levels and MS, confirming the findings of a previous study performed in a younger male population.35
Excess and deficient production of IGF-1 have been associated with some aspects of MS.12,36 In acromegaly, a condition characterized by high IGF-1 levels, surgical removal or irradiation of the pituitary gland (which is followed by reduction in IGF-1 levels) leads to significant improvement in glucose tolerance.36 MS has also been associated with IGF-1 deficiency, presumably because sarcopenia is associated with low glucose uptake and upregulation of IGF-1 receptor, resulting in increased formation of hybrid insulin/IGF-1 receptors.12 However, in the multivariate analysis, IGF-1 was not associated with MS, although studies that have reported an inverse association between IGF-1 and MS used different criteria for MS (World Health Organization) and were performed in a younger population.12
Hormonal Dysregulation Score and MS
It has been proposed that age-associated changes in hormonal levels result from global dysregulation of the biological homeostasis.37 Therefore, it is possible that the interaction between various hormones and MS is a marker of unstable biological homeostasis that makes an individual more susceptible to develop MS.
It was hypothesized that the number of dysregulated hormones would be strongly associated with MS. Indeed, it was found that, independent of potential confounders, participants with a dysregulation score of 3 were almost three times as likely to have MS. This is the first evidence of a relationship between global hormonal dysregulation and MS.
The main limitation of this study was its cross-sectional design. Given the nature of the study, it could not be established whether hormonal changes (or hormonal dysregulation) are causes or consequences of MS. Second, calculated measures of bioavailable and free testosterone were used rather than direct measures.17 Third, information on IGF-1-binding proteins, which might have provided more details on free IGF-1, the fraction that is biologically active, was not available. Finally, in this study, only serum cortisol levels measured at 8 a.m., which probably do not reflect 24-hour or tissue levels, were used. However, important strengths offset these limitations. This was a large, representative sample of older participants with complete information on ATP III criteria for MS; they were screened for multiple potential confounders, such as inflammatory markers, smoking, physical activity, and alcohol intake. Furthermore, multiple hormones were evaluated, and an index of hormonal dysregulation was used to better determine the association between these hormones and MS.
In conclusion, these data suggest that total testosterone and SHBG are negatively and leptin is positively associated with MS in older men. Whether changes in single hormonal patterns and plurihormonal dysregulation play a role in the development of MS should be further tested in longitudinal studies.
Acknowledgments
Sponsors’ Role: None.
Footnotes
Author Contributions: Marcello Maggio: concept and design, analysis and interpretation of data, preparation of manuscript. Fulvio Lauretani and Stefania Bandinelli: acquisition of subjects and data, analysis and interpretation of data. Gian Paolo Ceda and Shehzad Basaria: concept and design, interpretation of data, preparation of manuscript. Josephine Egan and Samer Najjar: analysis and interpretation of data. Giuseppe Paolisso and E. J. Metter: analysis and interpretation of data, preparation of manuscript. Giorgio Valenti: concept and design, interpretation of data. Jack Guralnik and Luigi Ferrucci: concept and design, acquisition of subjects and data, analysis and interpretation of data, preparation of manuscript.
Financial Disclosure: The authors received no financial support in relation to this manuscript and declare that they have no conflict of interest to disclose concerning this manuscript.
The InCHIANTI study is supported in part by the Intramural Research Program of the National Institutes of Health, National Institute on Aging, and as a targeted project (ICS 110.1/RS97.71) by the Italian Ministry of Health.
References
- 1.Grundy SM, Brewer HB, Jr, Cleeman JI, et al. Definition of metabolic syndrome: Report of the National Heart, Lung, and Blood Institute/American Heart Association conference on scientific issues related to definition. Circulation. 2004;109:433–438. doi: 10.1161/01.CIR.0000111245.75752.C6. [DOI] [PubMed] [Google Scholar]
- 2.Ford ES, Giles WH, Dietz WH. Prevalence of the metabolic syndrome among US adults: Findings from the third national health and nutrition examination survey. JAMA. 2002;287:356–359. doi: 10.1001/jama.287.3.356. [DOI] [PubMed] [Google Scholar]
- 3.Sattar N, Gaw A, Scherbakova O, et al. Metabolic syndrome with and without C-reactive protein as a predictor of coronary heart disease and diabetes in the West of Scotland Coronary Prevention Study. Circulation. 2003;108:414–419. doi: 10.1161/01.CIR.0000080897.52664.94. [DOI] [PubMed] [Google Scholar]
- 4.Scuteri A, Najjar SS, Morrell CH, et al. The metabolic syndrome in older individuals: Prevalence and prediction of cardiovascular events. The Cardiovascular Health Study. Diabetes Care. 2005;28:882–887. doi: 10.2337/diacare.28.4.882. [DOI] [PubMed] [Google Scholar]
- 5.Laaksonen DE, Niskanen L, Punnonen K, et al. Testosterone and sex hormone-binding globulin predict the metabolic syndrome and diabetes in middle-aged men. Diabetes Care. 2004;27:1036–1041. doi: 10.2337/diacare.27.5.1036. [DOI] [PubMed] [Google Scholar]
- 6.Muller M, Grobbee DE, den Tonkelaar I, et al. Endogenous sex hormones and metabolic syndrome in aging men. J Clin Endocrinol Metab. 2005;90:2618–2623. doi: 10.1210/jc.2004-1158. [DOI] [PubMed] [Google Scholar]
- 7.Kupelian V, Page ST, Araujo AB, et al. Low SHBG, total testosterone, and symptomatic androgen deficiency are associated with development of the metabolic syndrome in non-obese men. J Clin Endocrinol Metab. 2006 January 4; doi: 10.1210/jc.2005-1326. Epub ahead of print. [DOI] [PubMed] [Google Scholar]
- 8.Shabsigh R, Katz M, Yan G, et al. Cardiovascular issues in hypogonadism and testosterone therapy. Am J Cardiol. 2005;96:67M–72M. doi: 10.1016/j.amjcard.2005.10.009. [DOI] [PubMed] [Google Scholar]
- 9.Basaria S, Muller DC, Carducci MA, et al. Hyperglycemia and insulin resistance in men with prostate carcinoma who receive androgen-deprivation therapy. Cancer. 2006;106:581–588. doi: 10.1002/cncr.21642. [DOI] [PubMed] [Google Scholar]
- 10.Hajamor S, Despres JP, Couillard C, et al. Relationship between sex hormone-binding globulin levels and features of the metabolic syndrome. Metabolism. 2003;52:724–730. doi: 10.1016/s0026-0495(03)00066-0. [DOI] [PubMed] [Google Scholar]
- 11.Bjorntorp P, Rosmond R. The metabolic syndrome—a neuroendocrine disorder? Br J Nutr. 2000;83:S49–S57. doi: 10.1017/s0007114500000957. [DOI] [PubMed] [Google Scholar]
- 12.Sesti G, Sciacqua A, Cardellini M, et al. Plasma concentration of IGF-I is independently associated with insulin sensitivity in subjects with different degrees of glucose tolerance. Diabetes Care. 2005;28:120–125. doi: 10.2337/diacare.28.1.120. [DOI] [PubMed] [Google Scholar]
- 13.Zamboni M, Zoico E, Fantin F, et al. Relation between leptin and the metabolic syndrome in elderly women. J Gerontol A Biol Sci Med Sci. 2004;59A:M396–M400. doi: 10.1093/gerona/59.4.m396. [DOI] [PubMed] [Google Scholar]
- 14.Ferrucci L, Bandinelli S, Benvenuti E, et al. Subsystems contributing to the decline in ability to walk: Bridging the gap between epidemiology and geriatric practice in the InCHIANTI study. J Am Geriatr Soc. 2000;48:1618–1625. doi: 10.1111/j.1532-5415.2000.tb03873.x. [DOI] [PubMed] [Google Scholar]
- 15.2001 Executive Summary of the Third Report of The National Cholesterol Education Program (NCEP) Expert Panel on Detection, Evaluation, and Treatment of High Blood Cholesterol In Adults (Adult Treatment Panel III) JAMA. 2001;285:2486–2497. doi: 10.1001/jama.285.19.2486. [DOI] [PubMed] [Google Scholar]
- 16.Valenti G, Denti L, Maggio M, et al. Effect of DHEAS on skeletal muscle over the life span: The InCHIANTI study. J Gerontol A Biol Sci Med Sci. 2004;59A:M466–M472. doi: 10.1093/gerona/59.5.m466. [DOI] [PubMed] [Google Scholar]
- 17.Vermeulen A, Verdonck L, Kaufman JM. A critical evaluation of simple methods for the estimation of free testosterone in serum. J Clin Endocrinol Metab. 1999;84:3666–3672. doi: 10.1210/jcem.84.10.6079. [DOI] [PubMed] [Google Scholar]
- 18.Abbatecola AM, Ferrucci L, Ceda GP, et al. Insulin resistance and muscle strength in older persons. J Gerontol A Biol Sci Med Sci. 2005;60A:M1278–M1282. doi: 10.1093/gerona/60.10.1278. [DOI] [PubMed] [Google Scholar]
- 19.Imagawa K, Matsumoto Y, Numata Y, et al. Development of a sensitive ELISA for human leptin, using monoclonal antibodies. Clin Chem. 1998;44:2165–2171. [PubMed] [Google Scholar]
- 20.Pisani P, Faggiano F, Krogh V, et al. Relative validity and reproducibility of a food frequency dietary questionnaire for use in the Italian EPIC centres. Int J Epidemiol. 1997;26(Suppl 1):S152–S160. doi: 10.1093/ije/26.suppl_1.s152. [DOI] [PubMed] [Google Scholar]
- 21.Haffner SM, Valdez RA, Mykkanen L, et al. Decreased testosterone and dehydroepiandrosterone sulfate concentrations are associated with increased insulin and glucose concentrations in nondiabetic men. Metabolism. 1994;43:599–603. doi: 10.1016/0026-0495(94)90202-x. [DOI] [PubMed] [Google Scholar]
- 22.Glass AR, Swerdloff RS, Bray GA, et al. Low serum testosterone and sex-hormone-binding-globulin in massively obese men. J Clin Endocrinol Metab. 1977;45:1211–1219. doi: 10.1210/jcem-45-6-1211. [DOI] [PubMed] [Google Scholar]
- 23.Plymate SR, Matey LA, Jones RE, et al. Inhibition of sex hormone-binding globulin in the human hepatoma (Hep G2) cell line by insulin and prolactin. J Clin Endocrinol Metab. 1988;67:460–464. doi: 10.1210/jcem-67-3-460. [DOI] [PubMed] [Google Scholar]
- 24.Katsuki A, Sumida Y, Murashima S, et al. Acute and chronic regulation of serum sex hormone binding globulin levels by plasma insulin concentrations in male non insulin-dependent diabetes mellitus patients. J Clin Endocrinol Metab. 1996;81:2515–2519. doi: 10.1210/jcem.81.7.8675570. [DOI] [PubMed] [Google Scholar]
- 25.Ding EL, Song Y, Malik VS, et al. Sex differences of endogenous sex hormones and risk of type diabetes: A systematic review and meta-analysis. JAMA. 2006;295:1288–1299. doi: 10.1001/jama.295.11.1288. Review. [DOI] [PubMed] [Google Scholar]
- 26.Heinlein CA, Chang C. The role of androgen receptors and androgen-binding proteins in nongenomic androgen actions. Mol Endocrinol. 2002;16:2181–2187. doi: 10.1210/me.2002-0070. [DOI] [PubMed] [Google Scholar]
- 27.Kahn SM, Hryb DJ, Nakhla AM, et al. Sex hormone-binding globulin is synthesized in target cells. J Endocrinol. 2002;175:113–120. doi: 10.1677/joe.0.1750113. [DOI] [PubMed] [Google Scholar]
- 28.Pugeat M, Moulin P, Cousin P, et al. Interrelations between sex hormone-binding globulin (SHBG), plasma lipoproteins and cardiovascular risk. J Steroid Biochem Mol Biol. 1995;53:567–572. doi: 10.1016/0960-0760(95)00102-6. [DOI] [PubMed] [Google Scholar]
- 29.Margetic S, Gazzola C, Pegg GG, et al. Leptin: A review of its peripheral actions and interactions. Int J Obes Relat Metab Disord. 2002;26:1407–1433. doi: 10.1038/sj.ijo.0802142. [DOI] [PubMed] [Google Scholar]
- 30.Baumgartner RN, Waters DL, Morley JE, et al. Age-related changes in sex hormones affect the sex difference in serum leptin independently of changes in body fat. Metabolism. 1999;48:378–384. doi: 10.1016/s0026-0495(99)90089-6. [DOI] [PubMed] [Google Scholar]
- 31.Bujalska IJ, Kumar S, Stewart PM. Does central obesity reflect Cushing’s disease of the omentum? Lancet. 1997;349:1210–1213. doi: 10.1016/S0140-6736(96)11222-8. [DOI] [PubMed] [Google Scholar]
- 32.Douyon L, Schteingart DE. Effect of obesity and starvation on thyroid hormone, growth hormone, and cortisol secretion. Endocrinol Metab Clin North Am. 2002;31:173–189. doi: 10.1016/s0889-8529(01)00023-8. [DOI] [PubMed] [Google Scholar]
- 33.Kawano H, Yasue H, Kitagawa A, et al. Dehydroepiandrosterone supplementation improves endothelial function and insulin sensitivity in men. J Clin Endocrinol Metab. 2003;88:3190–3195. doi: 10.1210/jc.2002-021603. [DOI] [PubMed] [Google Scholar]
- 34.Villareal DT, Holloszy JO. Effect of DHEA on abdominal fat and insulin action in elderly women and men: A randomized controlled trial. JAMA. 2004;292:2243–2248. doi: 10.1001/jama.292.18.2243. [DOI] [PubMed] [Google Scholar]
- 35.Blouin K, Despres JP, Couillard C, et al. Contribution of age and declining androgen levels to features of the metabolic syndrome in men. Metabolism. 2005;54:1034–1040. doi: 10.1016/j.metabol.2005.03.006. [DOI] [PubMed] [Google Scholar]
- 36.Barrande G, Pittino-Lungo M, Coste J, et al. Hormonal and metabolic effects of radiotherapy in acromegaly: Long-term results in 128 patients followed in a single center. J Clin Endocrinol Metab. 2000;85:3779–3785. doi: 10.1210/jcem.85.10.6870. [DOI] [PubMed] [Google Scholar]
- 37.Maggio M, Cappola AR, Ceda GP, et al. The hormonal pathway to frailty in older men. J Endocrinol Invest. 2005;28(11 Suppl):15–19. [PubMed] [Google Scholar]