

Abstract
Background
Traditional atherosclerotic risk factors predict long-term cardiovascular disease events but are poor predictors of near-term events.
Objective
To determine whether elevated levels of d-dimer and biomarkers of inflammation were more closely associated with near-term than long-term mortality in patients with lower-extremity peripheral arterial disease (PAD) and whether greater increases in biomarker levels were associated with higher mortality rates during the first year after the increase than during later years.
Design
Prospective cohort study with a mean follow-up of 3.4 years.
Setting
Academic medical center.
Patients
377 men and women with PAD.
Measurements
Mortality within 1 year after biomarker measurement, 1 to 2 years after biomarker measurement, and 2 to 3 years after biomarker measurement. Cox regression analyses were used to evaluate associations of biomarkers levels and changes in biomarkers with cardiovascular and all-cause mortality. Hazard ratios were calculated for each 1-unit increase in log1.5(biomarker level). Analyses were adjusted for age, sex, race, comorbid conditions, ankle–brachial index, and other confounders.
Results
Seventy-six patients (20%) died during follow-up. Higher levels of d-dimer, C-reactive protein, and serum amyloid A were associated with higher all-cause mortality among patients who died within 1 year after biomarker measurement (hazard ratio, 1.20 [95% CI, 1.08 to 1.33], 1.13 [CI, 1.05 to 1.21], and 1.12 [CI, 1.04 to 1.20], respectively; P < 0.001, P < 0.001, and P = 0.003) and among patients who died 1 to 2 years after biomarker measurement (hazard ratio, 1.14 [CI, 1.02 to 1.27], 1.15 [CI, 1.06 to 1.24], and 1.13 [CI, 1.04 to 1.24]; P = 0.022, P = 0.001, and P = 0.005]). However, higher levels of each biomarker were not associated with all-cause mortality for deaths occurring 2 to 3 years after biomarker measurement. Similar results were observed for cardiovascular mortality. Greater increases in each biomarker were associated with higher all-cause and cardiovascular mortality during the following year.
Limitation
The small number of deaths limited the statistical power of the analyses.
Conclusion
Among persons with PAD, circulating levels of d-dimer and inflammatory markers are higher in the 1 to 2 years before death than in periods more remote from death. Increasing levels of d-dimer and inflammatory biomarkers are independently associated with higher mortality in persons with PAD.
Atherosclerotic cardiovascular disease causes more than 19 million deaths per year worldwide and is a major cause of morbidity (1). Traditional atherosclerotic risk factors predict later-term cardiovascular events and mortality but are relatively poor predictors of near-term events (1, 2). Identifying biomarkers whose levels are elevated before an imminent clinical event could provide important prognostic information and elucidate mechanisms of acute events.
Thrombogenic and inflammatory factors have been implicated in the pathogenesis of acute cardiovascular events. Elevated levels of inflammatory factors may encourage plaque instability and rupture (3, 4). Elevated d-dimer levels may reflect the degree of ongoing fibrin formation and degradation associated with unstable atherosclerotic plaque (5–7). The liver rapidly synthesizes the inflammatory markers serum amyloid A and C-reactive protein (CRP) in response to inflammatory stimuli (8). Elevated or increasing levels of these biomarkers may signal increased risk for acute arterial thrombosis or unstable plaque rupture.
We studied associations between elevated levels of d-dimer, CRP, and serum amyloid A and near-term mortality versus long-term mortality in patients with lower-extremity peripheral arterial disease (PAD). We also studied associations of increases in these markers with death during the year after measurement. Persons with PAD have increased mortality and elevated levels of these biomarkers compared with persons without PAD (9–11). Therefore, persons with PAD are an important cohort in which to evaluate temporal associations between death and changes in levels of these biomarkers. We hypothesized that elevated biomarker levels would be more predictive of deaths occurring in the near term after biomarker measurement than of deaths occurring later after biomarker measurement. We also hypothesized that increases in biomarker levels would be associated with a higher risk for death during the first year after the biomarker increase.
Context
Traditional cardiovascular disease risk factors predict distant but not near-term outcomes. Change in thrombogenic and inflammatory biomarkers might predict near-term events.
Contribution
The authors measured d-dimer, amyloid A protein, and C-reactive protein annually for 3.4 years in 377 patients with peripheral arterial disease. Elevated levels—and increases in levels—were associated with all-cause and cardiovascular disease–related deaths occurring 1 to 2 years after their measurement but not with deaths after 2 years.
Caution
The small number of deaths limits the power to detect patterns.
Implication
Increases in thrombogenic and inflammatory biomarker levels may signal near-term—but not distant—events. This observation requires confirmation in a larger sample.
—The Editors
Methods
Overview
We designed an observational, prospective study of persons with PAD (12). Participants attended 1 baseline visit and 3 annual follow-up visits. We collected blood at each visit and followed participants for total and cardiovascular disease mortality. We studied the association between biomarker levels at each visit and death occurring during 3 intervals: the year immediately after biomarker measurement, 1 to 2 years after biomarker measurement, and 2 to 3 years after biomarker measurement. Yearly follow-up was defined according to the annual visit dates. We tested the hypothesis that associations of elevated biomarker levels with mortality were strongest for the shortest follow-up interval and weakest for the longest follow-up interval. We used time-dependent analyses for the biomarkers so that participants with blood levels obtained at multiple visits contributed data for each biomarker measurement. We also studied whether death during the first year after changes in biomarker levels was associated with the change in biomarker level between baseline and the 1-year follow-up visit, baseline and the 2-year follow-up visit, and baseline and the 3-year follow-up visit.
Participants
Participants were consecutive patients undergoing lower-extremity arterial testing in 3 Chicago-area noninvasive vascular laboratories (12). Some participants were identified among consecutive patients in a large, general internal medicine practice because they had a low ankle–brachial index. The study protocol was approved by the institutional review boards of Northwestern University's Feinberg School of Medicine and Catholic Health Partners Hospitals (Chicago, Illinois). Participants gave written informed consent.
Exclusion Criteria
We defined PAD as an ankle–brachial index less than 0.90 (13). Exclusion criteria are reported elsewhere (12). We excluded patients with dementia (because they could not answer questions accurately), nursing home residents, wheelchair-bound persons, persons with foot or leg amputations, and patients who had recently had major surgery. We also excluded non–English-speaking patients because investigators were not fluent in non-English languages.
Ankle–Brachial Index Measurement
After participants rested supine for 5 minutes, we used a hand-held Doppler probe (Pocket-Dop II, Nicolet Vascular, Golden, Colorado) to measure systolic pressures in the right brachial artery, right dorsalis pedis and posterior tibial arteries, left dorsalis pedis and posterior tibial arteries, and left brachial artery. Each pressure was measured twice (12). We calculated the ankle– brachial index in each leg by dividing average pressures in each leg by the average of the 4 brachial pressures (14). We used average brachial pressures in the arm with highest pressure instead of the average of all 4 brachial pressures when 1 brachial pressure was higher than the other in both measurement sets, and the 2 brachial pressures differed by 10 mm Hg or more in at least 1 measurement set. These participants may have had subclavian stenosis (14 –16). The lowest leg ankle– brachial index was used in analyses.
Comorbid Conditions
We used algorithms developed for the Women's Health and Aging Study to document comorbid conditions at baseline (17). These algorithms combine data from patient report, physical examination, medical record review, medications, laboratory values, and a primary care physician questionnaire.
Blood Collection
At each visit, we asked all participants to undergo blood sample collection and storage and to verify their assent by initialing the consent form. Phlebotomy was attempted for all consenting participants. The principal investigator certified health interviewers to do phlebotomy before beginning blood collection and again every 6 months to ensure continued adherence to protocol. A 10% randomly selected sample of participants underwent split sample testing for additional quality-control monitoring.
Blood was collected into Vacutainer (Becton Dickenson, Franklin Lakes, New Jersey) tubes containing EDTA and sodium citrate and was put on ice immediately. Tubes were spun at 3000 rpm for 20 minutes at 4 °C in a refrigerated centrifuge. Blood was stored at −70 °C until analyses were completed, which was up to 3 years after blood collection.
Serum Amyloid A and CRP Levels
We measured serum amyloid A and CRP by using an immunotechnique on the Behring BN II analyzer (Dade Behring, Wilmington, Delaware). This method detects CRP concentrations as low as 0.15 mg/L (18). Coefficients of variability were 7.94% for serum amyloid A and 4.26% for CRP.
d-Dimer Levels
We used an Asserachrom D-Di kit (Diagnostica Stago, Asnières-sur-Seine, France) to measure d-dimer with an enzyme-linked immunosorbent assay procedure. The coefficient of variability was 9.4%.
Total and High-Density Lipoprotein Cholesterol Levels
Total cholesterol levels were measured by using enzymatic reaction with peroxidase–phenol-4-aminophenazone indicator reaction (19). High-density lipoprotein cholesterol levels were measured by using direct enzymatic colorimetric assay (20).
Cigarette Smoking
We determined cigarette smoking history by patient report using a structured interview. Pack-years of smoking were calculated on the basis of the number of years smoked and the average number of packs smoked per day.
Death
We ascertained deaths from the Social Security Death Index. Survival status was available for all participants. We obtained death certificates from the state of Illinois or medical records. Cause of death was determined by a certified nosologist who had completed advanced training in identifying causes of death from death certificates. Cardiovascular deaths were those with International Statistical Classification of Diseases and Related Health Problems, 10th Revision, codes in the range I01.0 through I99.9, which includes deaths due to coronary heart disease, stroke, peripheral vascular disease, and other cardiovascular diseases.
Statistical Analysis
We compared baseline characteristics between decedents and survivors with PAD by using general linear models for continuous variables and chi-square tests for categorical variables. We used proportional hazards regression analyses to relate baseline biomarker levels to all-cause and cardiovascular mortality at 4-year follow-up, adjusting for age, sex, race, diabetes, number of cardiovascular diseases, smoking, and ankle–brachial index.
Analytic Approaches Used to Address Primary Study Aims
We used 2 analytic approaches to model associations of biomarker levels with mortality. To assess the marginal associations of a given biomarker level with near-term versus later-term mortality, we used a 3-model approach in which we performed 3 proportional hazard analyses, each corresponding to 1 of 3 intervals: the first, second, and third years after the biomarker measurement. To assess longitudinal associations of changes in biomarker levels with mortality, we combined the data into 1 model (combined model approach). The Appendix (available at www.annals.org) presents detailed descriptions of these 2 analytic approaches. The 3-model approach provides more statistical power than the combined model approach but assumes homogenous associations across the 3 follow-up periods. For example, the 3-model approach assumes that the association between the baseline biomarker level and mortality during the first year of follow-up is the same as the association between the biomarker level at the first annual follow-up visit and mortality between the first and second years of follow-up. The combined approach does not require us to make these assumptions. The combined model focuses on more complicated longitudinal associations and may provide richer information on the associations of the biomarker levels with mortality than the 3-model approach. However, the combined model has less statistical power than the 3-model approach, because few deaths occurred during some follow-up periods in the combined model.
The 3-Model Approach
Figure 1 shows the results of the 3-model analyses. We chose a limited number of covariates to include in the regression analyses a priori, because models become unreliable when researchers specify a large number of covariates and few outcome events occur (as in our data set). Biomarker levels were the only time-dependent variables in the regression models. We adjusted associations with all-cause mortality for age, sex, race, diabetes mellitus, number of cardiovascular diseases, cancer, smoking, and ankle–brachial index. We adjusted associations with cardiovascular mortality for fewer covariates (age, sex, race, diabetes, number of cardiovascular diseases, and ankle– brachial index) because there were fewer cardiovascular deaths than all-cause deaths. Analyses were repeated with fewer and greater numbers of covariates, selecting covariates for these models a priori, to see whether the number of covariates influenced the results. We tested the proportional hazards assumption by using cumulative score processes (21) and found no evidence of violation of the assumption in the analyses for all-cause mortality.
Figure 1. Adjusted associations between biomarker levels and death, by interval between measurement and death.

Analyses for all-cause mortality were adjusted for age, sex, race, diabetes mellitus, smoking, ankle–brachial index, number of other cardiovascular diseases, and cancer. Analyses for cardiovascular mortality were adjusted for age, sex, race, diabetes mellitus, ankle–brachial index, and number of other cardiovascular diseases. Solid squares represent the log (hazard ratio) corresponding to a 1-unit increase in the biomarker level. Error bars represent 95% CIs.
Combined Model Approach
Figure 2 shows the results of the combined model. The combined model evaluated associations of changes in biomarker levels between the baseline visit and the first, second, and third annual follow-up visits, respectively, with mortality during the first year after the change. We adjusted analyses for cardiovascular mortality for age, sex, race, diabetes mellitus, number of cardiovascular diseases, cancer, baseline biomarker levels, and ankle– brachial index. In addition to the covariates used in analyses for cardiovascular mortality, analyses for all-cause mortality were also adjusted for smoking. We obtained SEs for all of the multivariable analyses by using 500 nonparametric bootstrap samples.
Figure 2. Adjusted associations between changes in biomarker levels from baseline to each follow-up visit and death during the year after the biomarker level change.

Analyses for all-cause mortality were adjusted for age, sex, race, diabetes mellitus, smoking, ankle–brachial index, number of other cardiovascular diseases, and cancer. Analyses for cardiovascular mortality were adjusted for age, sex, race, diabetes mellitus, ankle–brachial index, and number of other cardiovascular diseases. Solid squares represent the log (hazard ratio) corresponding to a 1-unit increase in the biomarker level. Error bars represent 95% CIs. FV0 = baseline visit; FV1 = 1-year follow-up visit; FV2 = 2-year follow-up visit; FV3 = 3-year follow-up visit.
To account for missing biomarker levels for visits between baseline and final follow-up (Figure 3), we used the multiple imputation method in proportional hazards regression with time-dependent biomarker levels. The cause of 9 of the 76 deaths was unknown. In analyses for cardiovascular disease mortality, we imputed the cause of death when death certificates were unobtainable, using multiple imputation methods proposed by Lu and Tsiatis (22). To determine whether results were sensitive to the imputation method, we performed analyses for 2 extreme possibilities: All missing death certificates were considered cardiovascular deaths, or none of the missing death certificates were considered cardiovascular deaths.
Figure 3. Rates of follow-up and death among study participants.

Participants were grouped according to whether and when they died during the study. Average levels of each biomarker were calculated at each study visit for each group to determine whether biomarker levels were higher at the visit immediately preceding death. We repeated analyses for cardiovascular mortality. Consecutive mean blood values before death were compared by using paired Wilcoxon rank tests.
Role of the Funding Source
The National Heart, Lung, and Blood Institute and the National Center for Research Resources, National Institutes of Health, provided funding for the study, but they played no role in data analyses.
Results
Of 460 participants with PAD in the sample, 377 (82%) had blood drawn at baseline and constituted the cohort for analyses. During 4 years of follow-up, 76 participants (20%) died. Death certificates were located for 67 decedents (88%). Thirty-one deaths (41%) were from cardiovascular disease. Figure 3 shows follow-up rates.
Compared with survivors, decedents were older (mean age, 74.1 years [SD, 8.8] vs. 71.1 years [SD, 8.4]; P = 0.001) and included more men (68.4% vs. 60.1%; P = 0.004). After adjustment for age and sex, decedents had a higher prevalence of heart failure, a lower high-density lipoprotein cholesterol level, and higher baseline levels of each biomarker compared with survivors (Table 1). At 4-year follow-up, higher baseline levels of each biomarker were statistically significantly associated with increased all-cause mortality, and higher levels of serum amyloid A and CRP were associated with increased cardiovascular mortality (Table 2). Figure 1 shows hazard ratios between biomarker levels and all-cause mortality during each follow-up interval. Hazard ratios indicate the relative risk for death corresponding to a 1-unit increase in log1.5(biomarker level) (that is, a 50% relative difference in biomarker level), after adjustment for age, sex, race, cardiovascular diseases, cancer, diabetes, smoking, and ankle–brachial index. Higher levels of d-dimer, CRP, and serum amyloid A were associated with higher all-cause mortality among patients who died within 1 year after biomarker measurement (hazard ratio, 1.20 [CI, 1.08 to 1.33], 1.13 [CI, 1.05 to 1.21], and 1.12 [CI, 1.04 to 1.20], respectively; P < 0.001, P < 0.001, and P = 0.003) and among patients who died 1 to 2 years after biomarker measurement (hazard ratio, 1.14 [CI, 1.02 to 1.27], 1.15 [CI, 1.06 to 1.24], and 1.13 [CI, 1.04 to 1.24]; P = 0.022, P = 0.001, and P = 0.005]). Higher biomarker levels were not associated with greater all-cause mortality 2 to 3 years after measurement (Figure 1). Table 3 shows average levels of each biomarker at baseline and each follow-up visit, according to when participants died. Among decedents, d-dimer levels were highest at the visit immediately preceding death (Table 3). Findings were similar, but less consistent, for CRP and serum amyloid A. Figure 1 shows hazard ratios between biomarker levels and cardiovascular disease mortality during each follow-up interval. Higher d-dimer levels were statistically significantly associated with higher cardiovascular mortality during each follow-up interval. Higher levels of CRP and serum amyloid A were each significantly associated with higher cardiovascular mortality during the year immediately after each biomarker measurement and 1 to 2 years after biomarker measurement. Higher levels of CRP and serum amyloid A were not associated with greater cardiovascular mortality 2 to 3 years after measurement (Figure 1). Results did not substantially differ when analyses were repeated with adjustment for only 3 and as many as 17 covariates. The results in Figure 1 did not substantially differ when analyses were repeated assuming that all missing deaths were due to cardiovascular disease and that no missing deaths were due to cardiovascular disease (data not shown). For participants with cardiovascular death, CRP and serum amyloid A levels were highest at the visit immediately preceding cardiovascular death. However, differences between biomarker levels immediately preceding death and those from the previous year were not statistically significant, probably because of small sample sizes (Appendix Table, available at www.annals.org). Greater increases in serum amyloid A and d-dimer levels between baseline and 1-year follow-up were associated with significantly increased risk for all-cause mortality and cardiovascular mortality during the 1 year after the first annual follow-up visit (Figure 2). Greater increases in serum amyloid A, CRP, and d-dimer levels between baseline and 2-year follow-up were associated with higher all-cause mortality (CRP and d-dimer) and cardiovascular mortality (serum amyloid A and CRP) during the year after the biomarker increase. Greater increases in CRP between baseline and the third annual follow-up visit were associated with higher cardiovascular mortality during the year after the increase (Figure 2). Figure 4 and Appendix Figures 1 and 2 (available at www.annals.org) demonstrate the distribution of biomarker values at each study visit and show trajectories of biomarker levels in a randomly selected subset of decedents and survivors. Average biomarker values before death are higher than those for survivors evaluated at the corresponding visit, consistent with results presented here.
Table 1. Age- and Sex-Adjusted Characteristics of Participants with Peripheral Arterial Disease, by Survival Status*.
| Characteristic | Survivors (n = 301) | Decedents (n = 76) | P Value† |
|---|---|---|---|
| African American, % | 13.8 | 13.8 | 1.00 |
| Mean ankle-brachial index (±SE) | 0.649 ± 0.008 | 0.645 ± 0.017 | 0.83 |
| Mean body mass index (±SE), kg/m2 | 27.5 ± 0.28 | 26.4 ± 0.56 | 0.078 |
| Cigarette smoking, pack-years | 38.8 ± 1.93 | 40.1 ± 3.88 | 0.78 |
| Myocardial infarction, % | 26.4 | 35.4 | 0.125 |
| Heart failure, % | 25.7 | 41.0 | 0.010 |
| Angina, % | 36.6 | 42.2 | 0.38 |
| Stroke, % | 10.6 | 13.4 | 0.51 |
| History of hypertension, % | 80.4 | 86.7 | 0.201 |
| Cancer, % | 14.3 | 23.1 | 0.067 |
| Diabetes, % | 29.8 | 38.2 | 0.181 |
| Mean total cholesterol level (±SE) | 0.89 | ||
| mmol/L | 4.67 ± 0.06 | 4.65 ± 0.11 | |
| mg/dL | 180.2 ± 2.17 | 179.6 ± 4.35 | |
| Mean high-density lipoprotein cholesterol level (±SE) | 0.029 | ||
| mmol/L | 1.06 ± 0.02 | 0.96 ± 0.04 | |
| mg/dL | 40.9 ± 0.79 | 37.0 ± 1.59 | |
| Statin use, % | 46.3 | 38.6 | 0.23 |
| Mean blocks walked during the past week (±SE), n | 34.7 ± 3.25 | 31.6 ± 6.52 | 0.59 |
| Baseline mean CRP level (±SE), mg/L | 4.96 ± 0.49 | 7.65 ± 0.98 | 0.015 |
| Baseline mean serum amyloid A level (±SE), mg/L | 7.83 ± 1.46 | 14.44 ± 2.93 | 0.045 |
| Baseline mean d-dimer level (±SE), mg/L | 0.95 ± 0.08 | 1.39 ± 0.17 | 0.021 |
Cardiac or cerebrovascular disease was defined as ≥1 of the following: history of myocardial infarction, heart failure, angina, and stroke. CRP = C-reactive protein.
Derived from comparisons between survivors and decedents, with additional adjustment for age and sex.
Table 2. Adjusted Associations between Baseline Biomarker Levels and Mortality at 4-Year Follow-up in Patients with Peripheral Arterial Disease*.
| Biomarker | Hazard Ratio (95% CI) |
P Value |
|---|---|---|
| All-cause mortality† | ||
| Serum amyloid A level | 1.13 (1.03–1.23) | 0.010 |
| C-reactive protein level | 1.14 (1.05–1.24) | 0.003 |
| d-Dimer level | 1.17 (1.04–1.32) | 0.007 |
| Cardiovascular disease mortality†‡ | ||
| Serum amyloid A level | 1.12 (1.00–1.25) | 0.041 |
| C-reactive protein level | 1.17 (1.05–1.30) | 0.003 |
| d-Dimer level | 1.14 (0.99–1.32) | 0.071 |
Hazard ratios represent risk for death at 4-year follow-up per each 50% increase from baseline biomarker level.
Adjusted for age, sex, race, diabetes mellitus, cigarette smoking, ankle–brachial index, and number of cardiovascular diseases. Analyses for all-cause mortality are additionally adjusted for cancer.
For participants without death certificates, the hazard ratio for cardiovascular disease mortality was derived by using the multiple imputation method.
Table 3. Average Biomarker Levels, by Timing of Death from Any Cause*.
| Timing of Death | Participants, n | d-Dimer Level (P Value), μg/L | C-Reactive Protein Level (P Value), mg/L | Serum Amyloid A Level (P Value), mg/L | |||||||||
|---|---|---|---|---|---|---|---|---|---|---|---|---|---|
| Baseline | First Follow-up Visit | Second Follow-up Visit | Third Follow-up Visit | Baseline | First Follow-up Visit | Second Follow-up Visit | Third Follow-up Visit | Baseline | First Follow-up Visit | Second Follow-up Visit | Third Follow-up Visit | ||
| Before first follow-up visit | 12 | 1.57 ± 1.10 | – | – | – | 7.82 ± 6.66 | – | – | – | 9.19 ± 7.1 | – | – | – |
| Between first and second follow-up visits | 19 | 1.13 ± 1.13 | 1.79 ± 1.84 (0.048) | – | – | 8.07 ± 6.62 | 10.86 ± 15.15 (0.02) | – | – | 8.80 ± 6.4 | 19.59 ± 29.3 (0.01) | – | – |
| Between second and third follow-up visits | 22 | 0.98 ± 0.87 | 0.92 ± 0.60 (0.001) | 1.95 ± 3.16 (0.014) | – | 4.45 ± 3.55 | 3.99 ± 3.45 (>0.05) | 7.21 ± 10.89 (0.098) | – | 8.05 ± 4.8 | 8.74 ± 5.5 (>0.05) | 45.8 ± 133.3 (>0.05) | – |
| Between third and fourth follow-up visits | 23 | 2.19 ± 2.69 | 2.14 ± 3.36 (0.001) | 2.14 ± 2.49 (>0.05) | 3.57 ± 2.21 (0.05) | 9.51 ± 20.67 | 4.00 ± 4.85 (0.008) | 14.03 ± 31.30 (>0.05) | 6.75 ± 10.29 (>0.05) | 29.13 ± 92.5 | 6.52 ± 4.5 (0.043) | 31.24 ± 85.6 (>0.05) | 22.04 ± 52.3 (0.007) |
| Alive at fourth follow-up visit | 301 | 0.93 ± 1.39 | 1.05 ± 2.48 (0.001) | 0.91 ± 1.21 (0.001) | 1.24 ± 3.01 (0.001) | 5.02 ± 7.17 | 4.12 ± 7.84 (0.001) | 4.94 ± 8.05 (>0.05) | 5.18 ± 8.19 (0.003) | 7.74 ± 11.9 | 9.26 ± 25.9 (0.001) | 9.96 ± 32.2 (>0.05) | 12.55 ± 44.8 (0.001) |
Values are reported as mean (±SD), unless otherwise noted. P values are based on the 1-sample Wilcoxon test for testing whether the average between the current biomarker value and that of the previous year differs from zero. All tests are constructed on the differences and thus take into account within-person correlations. A P value <0.05 was considered significant.
Appendix Table. Average Biomarker Levels, according to Cardiovascular Death*.
| Timing of Cardiovascular Death | Participants, n | d-Dimer Level (P Value), mg/L | C-Reactive Protein Level (P Value), mg/L | Serum Amyloid A Level (P Value), mg/L | |||||||||
|---|---|---|---|---|---|---|---|---|---|---|---|---|---|
| Baseline | First Follow-up Visit | Second Follow-up Visit | Third Follow-up Visit | Baseline | First Follow-up Visit | Second Follow-up Visit | Third Follow-up Visit | Baseline | First Follow-up Visit | Second Follow-up Visit | Third Follow-up Visit | ||
| Before first follow-up visit | 6 | 1.40 ± 1.20 | – | – | – | 8.82 ± 4.53 | – | – | – | 11.4 ± 9.0 | – | – | – |
| Between first and second follow-up visits | 7 | 1.01 ± 0.87 | 2.12 ± 2.56 (>0.05) | – | – | 12.37 ± 7.49 | 21.08 ± 19.97 (>0.05) | – | – | 11.9 ± 6.7 | 33.5 ± 44.4 (>0.05) | – | – |
| Between second and third follow-up visits | 8 | 1.09 ± 0.95 | 0.98 ± 0.31 (0.004) | 1.13 ± 0.67 (>0.05) | 4.73 ± 3.59 | 4.46 ± 2.94 (>0.05) | 14.17 ± 17.54 (>0.05) | – | 72.5 ± 49.5 | 59.3 ± 19.8 (>0.05) | 121.6 ± 231.6 (>0.05) | – | |
| Between third and fourth follow-up visits | 10 | 2.67 ± 2.48 | 3.63 ± 4.57 (0.008) | 2.63 ± 2.76 (>0.05) | 3.02 ± 1.95 (>0.05) | 5.91 ± 8.69 | 2.90 ± 2.25 (>0.05) | 4.29 ± 2.14 (>0.05) | 9.77 ± 15.86 (>0.05) | 11.1 ± 16.0 | 5.6 ± 3.8 (>0.05) | 10.0 ± 14.3 (>0.05) | 43.7 ± 79.0 (>0.05) |
| Not dead from CVD at fourth follow-up visit | 346 | 0.99 ± 1.45 | 1.04 ± 2.37 (0.001) | 0.99 ± 1.44 (0.001) | 1.30 ± 3.13 (0.001) | 5.32 ± 8.58 | 4.22 ± 7.74 (0.001) | 5.51 ± 11.2 (>0.039) | 5.16 ± 8.10 (0.001) | 9.06 ± 26.3 | 9.27 ± 24.7 (0.001) | 11.3 ± 37.9 (>0.05) | 12.4 ± 44.3 (0.001) |
| Not dead from any cause at fourth follow-up visit | 301 | 0.93 ± 1.39 | 1.05 ± 2.48 (0.001) | 0.91 ± 1.21 (0.001) | 1.24 ± 3.01 (0.001) | 5.02 ± 7.17 | 4.12 ± 7.84 (0.001) | 4.94 ± 8.05 (>0.05) | 5.18 ± 8.19 (0.003) | 7.74 ± 11.9 | 9.26 ± 25.9 (0.001) | 9.96 ± 32.2 (>0.05) | 12.6 ± 44.8 (0.001) |
Values are reported as mean (±SD), unless otherwise noted. P values are based on the 1-sample Wilcoxon test for testing whether the average between the current biomarker value and that of the previous year differs from zero. All tests are constructed on the differences and thus take into account within-person correlations. A P value <0.05 was considered significant. CVD = cardiovascular disease.
Figure 4. Trajectories of C-reactive protein (CRP) levels over time in persons with peripheral arterial disease.
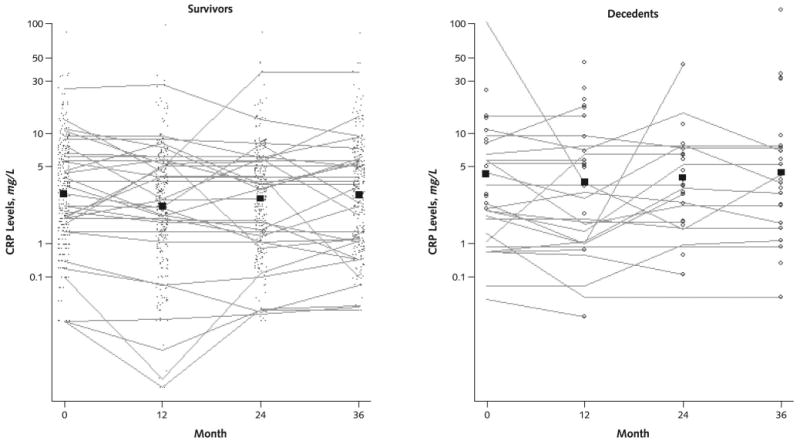
The points in the survivor figure represent CRP levels in participants who survived during the following year. These individual CRP values are connected to show the trajectory of CRP levels over time in a randomly selected subset of participants who survived the 4-year follow-up. The open circles in the decedent figure represent CRP levels in participants who died during the year after CRP measurement. Individual CRP values are connected to show the trajectory of CRP levels at each visit in a randomly selected subset of participants who died during the 4-year follow-up. The boxes in each figure (survivors and decedents) represent mean CRP values for those who survived and died during the year after the measurement, respectively.
Appendix Figure 1. Trajectories of d-dimer levels over time in persons with peripheral arterial disease.
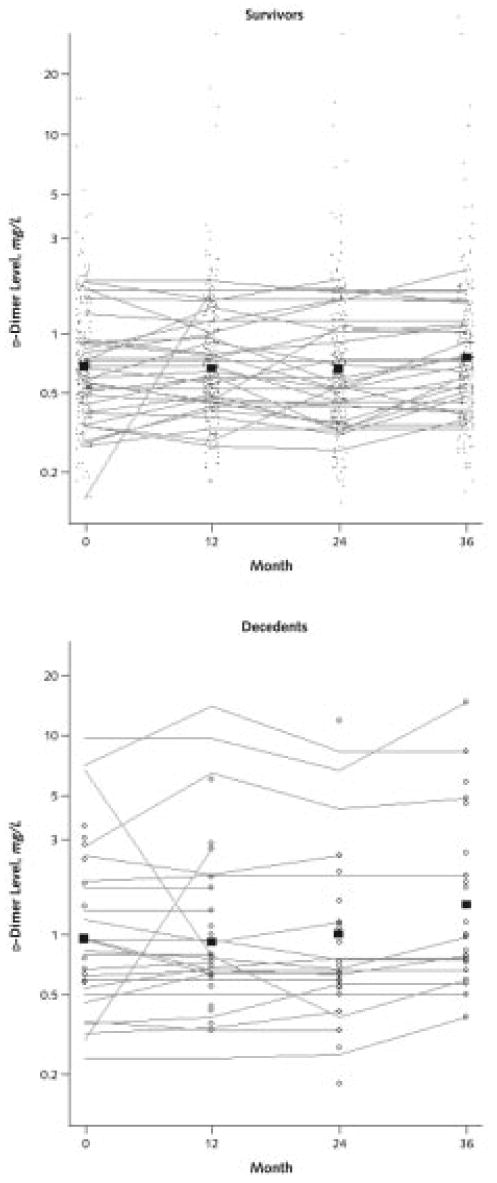
The points in the survivor figure represent d-dimer levels in participants who survived during the following year. These individual d-dimer values are connected to show the trajectory of d-dimer levels over time in a randomly selected subset of participants who survived the 4-year follow-up. The open circles in the decedent figure represent d-dimer levels in participants who died during the year after d-dimer measurement. Individual d-dimer values are connected to show the trajectory of d-dimer levels at each visit in a randomly selected subset of participants who died during the 4-year follow-up. The boxes in each figure (survivors and decedents) represent mean d-dimer values for those who survived and died during the year after the measurement, respectively.
Appendix Figure 2. Trajectories of serum amyloid A levels over time in persons with peripheral arterial disease.
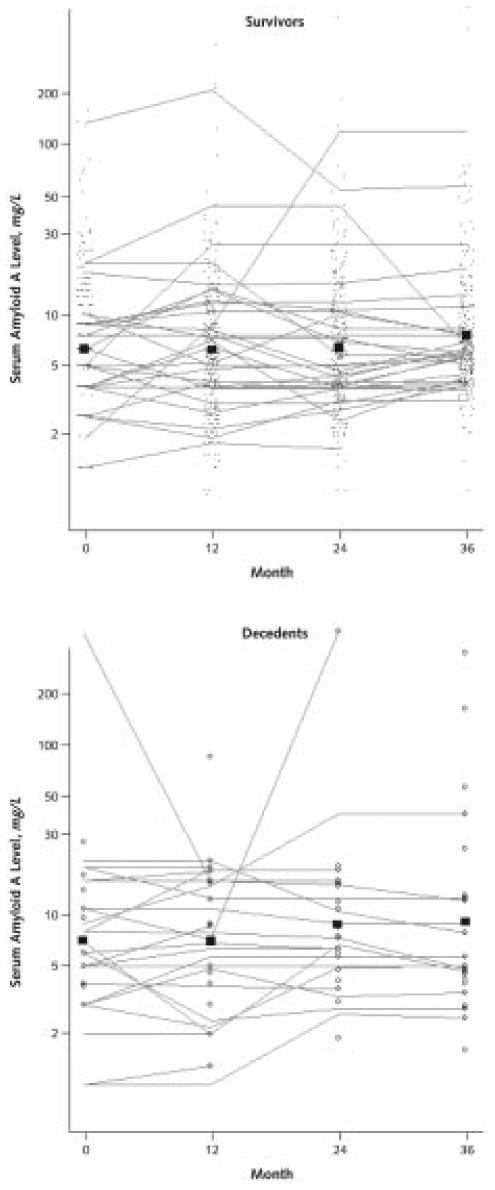
The points in the survivor figure represent serum amyloid A levels in participants who survived during the following year. These individual serum amyloid A values are connected to show the trajectory of serum amyloid A levels over time in a randomly selected subset of participants who survived the 4-year follow-up. The open circles in the decedent figure represent serum amyloid A levels in participants who died during the year after serum amyloid A measurement. Individual serum amyloid A values are connected to show the trajectory of serum amyloid A levels at each visit in a randomly selected subset of participants who died during the 4-year follow-up. The boxes in each figure (survivors and decedents) represent mean serum amyloid A values for those who survived and died during the year after the measurement, respectively.
Discussion
Among persons with PAD, higher levels of d-dimer, CRP, and serum amyloid A at a given time point were statistically significantly associated with higher all-cause mortality during each of the first 2 years after measurement. Higher levels of each biomarker were not associated with greater all-cause mortality occurring more than 2 years after biomarker measurement. For CRP and serum amyloid A, findings for cardiovascular disease mortality were similar to those for all-cause mortality. In contrast, higher d-dimer levels were associated with higher cardiovascular disease mortality during each follow-up interval. Together, findings suggest that elevated levels of CRP and serum amyloid A measured at a given time point are more closely associated with near-term than later-term risk for all-cause and cardiovascular disease mortality in persons with PAD. Elevated levels of d-dimer measured at a given time point are more closely associated with near-term than later-term all-cause mortality in persons with PAD.
We also observed that greater increases in levels of the 3 biomarkers were associated with significantly higher all-cause and cardiovascular disease mortality during the year immediately after these increases. Together, these findings suggest that both higher biomarker levels and greater increases in biomarker levels are associated with increased mortality during short-term follow-up.
Atherosclerotic risk factors predict long-term risk for cardiovascular events and can be targeted for long-term prevention. Identifying biomarkers associated with increased risk for near-term death provides potentially important prognostic information for clinicians that may guide decisions regarding clinical work-up or therapy intensity. Findings reported here may also help elucidate mechanisms of mortality in persons with PAD. However, no one has tested the hypothesis that early interventions in persons with increasing biomarker levels can prevent acute coronary syndromes. Accordingly, our findings should not alter current medical practice until they are confirmed and clinical trials demonstrate that early interventions prevent acute coronary syndromes when biomarker levels are increasing.
d-Dimer is the primary degradation product of cross-linked fibrin and marks ongoing fibrinolysis associated with thrombosis. Atherosclerosis-related endothelial damage provides a surface for thrombus formation, fibrinolysis, plaque remodeling, and atherosclerotic progression (7). Short-term increases in d-dimer levels may mirror temporary increases in atherosclerotic plaque remodeling. d-Dimer may predict both near-term and long-term cardiovascular mortality if the association of d-dimer with short-term atherosclerotic disease progression is also important for long-term cardiovascular disease outcomes.
Hypothesized mechanisms for associations between elevated inflammatory markers and death differ from those proposed for d-dimer. Studies have shown that CRP adversely affects endothelial function (23), promotes thrombosis (24), and increases influx of inflammatory cells (25). High levels of CRP or serum amyloid A may signify greater arterial wall inflammation, which leads to invasion of inflammatory cells, protease elaboration, fibrous cap breakdown, and plaque rupture.
Our study has limitations. First, among 377 patients with PAD, sample sizes in some subgroups were small for predicting death during the defined follow-up intervals. This was particularly true for cardiovascular deaths. Despite the relatively large number of covariates in the models for cardiovascular death, all statistical models converged. Resulting point estimates and corresponding CIs were within reasonable ranges. Results were similar when our models were repeated with varying numbers of comorbid conditions. Second, we imputed the cause of death for the 6 participants with missing death certificates. However, sensitivity analyses, performed with extreme assumptions about missing causes of death, suggested that the imputation was not likely to have affected our results. Third, analyses for associations of biomarkers with mortality at different intervals after the marker measurement were based on different sample sizes. Thus, levels of statistical significance are not directly comparable across different intervals. Nonetheless, the magnitude of the point estimators and corresponding 95% CIs, whose widths reflected varying sample sizes, provide descriptive comparisons of associations between each biomarker and mortality across different time intervals after marker measurement. Finally, we do not know whether our findings are generalizable to persons without PAD.
Our results differed from other studies of PAD in that cardiovascular disease accounted for fewer than 50% of deaths and the baseline ankle–brachial index level was similar between decedents and survivors. It is possible that improved treatment of atherosclerotic risk factors in PAD has reduced cardiovascular deaths and altered associations between ankle–brachial index and mortality.
In conclusion, elevated levels of CRP, serum amyloid A, and d-dimer were associated with increased risk for near-term, but not later-term, cardiovascular disease and all-cause mortality in persons with PAD. Increases in each biomarker level were independent predictors of mortality during the year after the increase. We hope that these findings will lead to further study, first to confirm our results and then to determine whether targeted interventions to reduce these biomarker levels reduce mortality in persons with PAD.
Acknowledgments
Grant Support: By grants R01-HL58099, R01-HL64739, and R01-HL076298 from the National Heart, Lung, and Blood Institute and grant RR-00048 from the National Center for Research Resources, National Institutes of Health.
Appendix
Three-Model Approach
In the 3-model approach, 3 separate proportional hazard analyses were performed for each biomarker to examine associations between the biomarker level and all-cause mortality during the first, second, and third subsequent year after blood marker measurement. In the following equations, FV0, FV1, FV2, and FV3 denotes blood marker levels (d-dimer, serum amyloid A, or CRP) at the baseline visit and the first, second, and third annual follow-up visits, respectively. We used I(·) to denote the indicator function. In the statistical analysis, we assume a proportional hazards model:
where h(t) is the hazard function and the time-dependent covariate,
in evaluating the association between the biomarker level and the mortality at the subsequent year (model I),
in evaluating the association between the biomarker level and death at 1 year after the measurement (model II), and
in evaluating the association between the biomarker level and death 2 years after the measurement (model III). In model I, exp{β} represents the hazard ratio at the subsequent year corresponding to a 1-unit increase in the log1.5(biomarker level) or, equivalently, a 50% increase in the biomarker level. Similarly, exp{β} represents the hazard ratio at 1 year and 2 years after the measurement corresponding to a 1-unit increase in the log1.5(biomarker level) in models II and III, respectively.
Combined Model Approach
In the combined model approach, we studied longitudinal associations of changes in each biomarker level with all-cause and cardiovascular disease mortality during the subsequent year after each change by using multivariate proportional hazards analyses. We evaluated change intervals between the baseline visit and the first, second, and third annual follow-up visits. Specifically, we assumed the proportional hazards model:
The interpretations of the regression coefficients in different follow-up periods are
1. for 1 ≤ t < 2,
and exp{β1} represents the hazard ratio corresponding to 1 unit higher in the change of log1.5(biomarker level) during the prior 1 year;
2. for 2 ≤ t < 3,
and exp{β2} represents the hazard ratio corresponding to a 1-unit increase in the change of log1.5(biomarker level) during the previous 2 years, and
3. for 3 ≤ t < 4,
where exp{β3} represents the hazard ratio corresponding to a 1-unit increase in the change of log1.5(biomarker level) during the previous 3 years.
Footnotes
Potential Financial Conflicts of Interest: Grants received: P.M. Ridker (National Heart, Lung, and Blood Institute, National Cancer Institute, Reynolds Foundation, Doris Duke Foundation, Leducq Foundation); M.M. McDermott (National Heart, Lung, and Blood Institute). Patents received: P.M. Ridker (Brigham and Women's Hospital). Royalties: P.M. Ridker (Brigham and Women's Hospital).
Author Contributions: Conception and design: H. Vidula, K. Liu, M.H. Criqui, P. Greenland, D. Green, J. Guralnik, M.M. McDermott.
Analysis and interpretation of the data: H. Vidula, L. Tian, K. Liu, M.H. Criqui, L. Ferrucci, N. Rifai, P. Greenland, D. Green, J. Tan, J. Guralnik, P.M. Ridker.
Drafting of the article: H. Vidula, D. Green, M.M. McDermott.
Critical revision of the article for important intellectual content: H. Vidula, L. Tian, M.H. Criqui, L. Ferrucci, N. Rifai, P. Greenland, D. Green, J. Guralnik, P.M. Ridker, M.M. McDermott.
Final approval of the article: L. Tian, K. Liu, M.H. Criqui, L. Ferrucci, W.H. Pearce, N. Rifai, P. Greenland, D. Green, J. Guralnik, P.M. Ridker, M.M. McDermott.
Provision of study materials or patients: W.H. Pearce, P.M. Ridker.
Statistical expertise: L. Tian, K. Liu, J. Guralnik.
Obtaining of funding: M.H. Criqui, M.M. McDermott.
Administrative, technical, or logistic support: M.H. Criqui, D. Green, D.B. Garside.
Collection and assembly of data: D. Green, D.B. Garside, P.M. Ridker, M.M. McDermott.
References
- 1.Naghavi M, Libby P, Falk E, Casscells SW, Litovsky S, Rumberger J, et al. From vulnerable plaque to vulnerable patient: a call for new definitions and risk assessment strategies: Part I. Circulation. 2003;108:1664–72. doi: 10.1161/01.CIR.0000087480.94275.97. PMID: 14530185. [DOI] [PubMed] [Google Scholar]
- 2.Stamler J, Stamler R, Neaton JD, Wentworth D, Daviglus ML, Garside D, et al. Low risk-factor profile and long-term cardiovascular and noncardiovascular mortality and life expectancy: findings for 5 large cohorts of young adult and middle-aged men and women. JAMA. 1999;282:2012–8. doi: 10.1001/jama.282.21.2012. PMID: 10591383. [DOI] [PubMed] [Google Scholar]
- 3.Libby P, Ridker PM, Maseri A. Inflammation and atherosclerosis. Circulation. 2002;105:1135–43. doi: 10.1161/hc0902.104353. PMID: 11877368. [DOI] [PubMed] [Google Scholar]
- 4.Libby P. Current concepts of the pathogenesis of the acute coronary syndromes. Circulation. 2001;104:365–72. doi: 10.1161/01.cir.104.3.365. PMID: 11457759. [DOI] [PubMed] [Google Scholar]
- 5.Davies MJ. A macro and micro view of coronary vascular insult in ischemic heart disease. Circulation. 1990;82:II38–46. PMID: 2203563. [PubMed] [Google Scholar]
- 6.Stary HC, Chandler AB, Dinsmore RE, Fuster V, Glagov S, Insull W, Jr, et al. A definition of advanced types of atherosclerotic lesions and a histological classification of atherosclerosis. A report from the Committee on Vascular Lesions of the Council on Arteriosclerosis, American Heart Association. Circulation. 1995;92:1355–74. doi: 10.1161/01.cir.92.5.1355. PMID: 7648691. [DOI] [PubMed] [Google Scholar]
- 7.Fuster V, Lewis A. Conner Memorial Lecture. Mechanisms leading to myocardial infarction: insights from studies of vascular biology. Circulation. 1994;90:2126–46. doi: 10.1161/01.cir.90.4.2126. PMID: 7718033. [DOI] [PubMed] [Google Scholar]
- 8.Wilson AM, Ryan MC, Boyle AJ. The novel role of C-reactive protein in cardiovascular disease: risk marker or pathogen. Int J Cardiol. 2006;106:291–7. doi: 10.1016/j.ijcard.2005.01.068. PMID: 16337036. [DOI] [PubMed] [Google Scholar]
- 9.Criqui MH, Langer RD, Fronek A, Feigelson HS, Klauber MR, McCann TJ, et al. Mortality over a period of 10 years in patients with peripheral arterial disease. N Engl J Med. 1992;326:381–6. doi: 10.1056/NEJM199202063260605. PMID: 1729621. [DOI] [PubMed] [Google Scholar]
- 10.McDermott MM, Guralnik JM, Corsi A, Albay M, Macchi C, Bandinelli S, et al. Patterns of inflammation associated with peripheral arterial disease: the InCHIANTI study. Am Heart J. 2005;150:276–81. doi: 10.1016/j.ahj.2004.09.032. PMID: 16086930. [DOI] [PubMed] [Google Scholar]
- 11.McDermott MM, Green D, Greenland P, Liu K, Criqui MH, Chan C, et al. Relation of levels of hemostatic factors and inflammatory markers to the ankle brachial index. Am J Cardiol. 2003;92:194–9. doi: 10.1016/s0002-9149(03)00537-x. PMID: 12860223. [DOI] [PubMed] [Google Scholar]
- 12.McDermott MM, Liu K, Greenland P, Guralnik JM, Criqui MH, Chan C, et al. Functional decline in peripheral arterial disease: associations with the ankle brachial index and leg symptoms. JAMA. 2004;292:453–61. doi: 10.1001/jama.292.4.453. PMID: 15280343. [DOI] [PubMed] [Google Scholar]
- 13.Newman AB, Siscovick DS, Manolio TA, Polak J, Fried LP, Borhani NO, et al. Ankle-arm index as a marker of atherosclerosis in the Cardiovascular Health Study. Cardiovascular Heart Study (CHS) Collaborative Research Group. Circulation. 1993;88:837–45. doi: 10.1161/01.cir.88.3.837. PMID: 8353913. [DOI] [PubMed] [Google Scholar]
- 14.McDermott MM, Criqui MH, Liu K, Guralnik JM, Greenland P, Martin GJ, et al. Lower ankle/brachial index, as calculated by averaging the dorsalis pedis and posterior tibial arterial pressures, and association with leg functioning in peripheral arterial disease. J Vasc Surg. 2000;32:1164–71. doi: 10.1067/mva.2000.108640. PMID: 11107089. [DOI] [PubMed] [Google Scholar]
- 15.Hiatt WR, Hoag S, Hamman RF. Effect of diagnostic criteria on the prevalence of peripheral arterial disease. The San Luis Valley Diabetes Study. Circulation. 1995;91:1472–9. doi: 10.1161/01.cir.91.5.1472. PMID: 7867189. [DOI] [PubMed] [Google Scholar]
- 16.Shadman R, Criqui MH, Bundens WP, Fronek A, Denenberg JO, Gamst AC, et al. Subclavian artery stenosis: prevalence, risk factors, and association with cardiovascular diseases. J Am Coll Cardiol. 2004;44:618–23. doi: 10.1016/j.jacc.2004.04.044. PMID: 15358030. [DOI] [PubMed] [Google Scholar]
- 17.Guralnik JM, Fried LP, Simonsick EM, Kasper JD, Lafferty ME. The Women's Health and Aging Study: health and social characteristics of older women with disability. Bethesda, MD: National Institute on Aging; 1995. NIH publication no. 95-4009, Appendix E. [Google Scholar]
- 18.Ledue TB, Weiner DL, Sipe JD, Poulin SE, Collins MF, Rifai N. Analytical evaluation of particle-enhanced immunonephelometric assays for C-reactive protein, serum amyloid A and mannose-binding protein in human serum. Ann Clin Biochem. 1998;35:745–53. doi: 10.1177/000456329803500607. PMID: 9838988. [DOI] [PubMed] [Google Scholar]
- 19.Allain CC, Poon LS, Chan CS, Richmond W, Fu PC. Enzymatic determination of total serum cholesterol. Clin Chem. 1974;20:470–5. PMID: 4818200. [PubMed] [Google Scholar]
- 20.Sugiuchi H, Uji Y, Okabe H, Irie T, Uekama K, Kayahara N, et al. Direct measurement of high-density lipoprotein cholesterol in serum with polyethylene glycol-modified enzymes and sulfated alpha-cyclodextrin. Clin Chem. 1995;41:717–23. PMID: 7729051. [PubMed] [Google Scholar]
- 21.Lin D, Wei LJ, Ying Z. Checking the Cox model with cumulative sums of martingale-based residuals. Biometrika. 1993;80:557–72. [Google Scholar]
- 22.Lu K, Tsiatis AA. Multiple imputation methods for estimating regression coefficients in the competing risks model with missing cause of failure. Biometrics. 2001;57:1191–7. doi: 10.1111/j.0006-341x.2001.01191.x. PMID: 11764260. [DOI] [PubMed] [Google Scholar]
- 23.Li L, Roumeliotis N, Sawamura T, Renier G. C-reactive protein enhances LOX-1 expression in human aortic endothelial cells: relevance of LOX-1 to C-reactive protein-induced endothelial dysfunction. Circ Res. 2004;95:877–83. doi: 10.1161/01.RES.0000147309.54227.42. PMID: 15472120. [DOI] [PubMed] [Google Scholar]
- 24.Devaraj S, Kumaresan PR, Jialal I. Effect of C-reactive protein on chemokine expression in human aortic endothelial cells. J Mol Cell Cardiol. 2004;36:405–10. doi: 10.1016/j.yjmcc.2003.12.005. PMID: 15010279. [DOI] [PubMed] [Google Scholar]
- 25.Torzewski J, Torzewski M, Bowyer DE, Fröhlich M, Koenig W, Waltenberger J, et al. C-reactive protein frequently colocalizes with the terminal complement complex in the intima of early atherosclerotic lesions of human coronary arteries. Arterioscler Thromb Vasc Biol. 1998;18:1386–92. doi: 10.1161/01.atv.18.9.1386. PMID: 9743226. [DOI] [PubMed] [Google Scholar]