

Abstract
We report the fabrication and characterization of carbon microelectrode arrays (MEAs) and their application to spatially and temporally resolve neurotransmitter release from single pheochromocytoma (PC12) cells. The carbon MEAs are composed of individually addressable 2.5-μm-radius microdisks embedded in glass. The fabrication involves pulling a multibarrel glass capillary containing a single carbon fiber in each barrel into a sharp tip, followed by beveling the electrode tip to form an array (10−20 μm) of carbon microdisks. This simple fabrication procedure eliminates the need for complicated wiring of the independent electrodes, thus allowing preparation of high-density individually addressable microelectrodes. The carbon MEAs have been characterized using scanning electron microscopy, steady-state and fast-scan voltammetry, and numerical simulations. Amperometric results show that subcellular heterogeneity in single-cell exocytosis can be electrochemically detected with MEAs. These ultrasmall electrochemical probes are suitable for detecting fast chemical events in tight spaces, as well as for developing multifunctional electrochemical microsensors.
Neuronal communication is facilitated by the release of chemical messengers, often via a process called exocytosis. In exocytosis, intracellular vesicles containing neurotransmitters fuse with the cell membrane to release their contents into the extracellular space.1 Such vesicle-fusion processes are known to be triggered by calcium ions and regulated by various membrane proteins (e.g., the soluble N-ethylmaleimide-sensitive factor attachment protein receptor (SNARE) proteins).2
Electrochemical methods utilizing carbon-fiber microelectrodes have been extremely useful in the detection of easily oxidizable neurochemicals (e.g., dopamine, epinephrine, 5-hydroxytryptamine, and histamine) from single cells.3,4 In a typical experiment, a carbon-fiber microdisk electrode is placed flush with the cell surface. The electrode potential is held constant (in amperometry) or scanned (in cyclic voltammetry) with respect to a reference electrode placed in the extracellular media. Quantitative and qualitative information about neurotransmission can be obtained from i—t and i—V responses.5 Experiments using a single carbon-fiber microelectrode provide valuable information such as chemical identity, amount of the neurotransmitter released, event frequency, and kinetic information relating to fusion pore opening.6 However, information concerning spatial heterogeneity of exocytotic events is difficult to obtain. Such information can be useful in understanding the molecular mechanisms and the chemical basis for regulation of neural secretion. By comparing the number of exocytotic events recorded simultaneously at two 1-μm carbon microelectrodes placed on the same chromaffin cell, Wightman and co-workers discovered the presence of “hot spots” (where exocytosis was more frequent) and “cold spots” (where exocytosis was less frequent) on the same cell.7 Due to the difficulties in micromanipulation, it is extremely challenging to record from more than one microelectrode concurrently at a single cell. Simultaneously monitoring exocytotic events from multiple sub-cellular sites of a single cell would be greatly facilitated by microelectrode arrays (MEAs).
MEAs have been intensively studied in the past two decades, not only by the chemical community8 but also by scientists probing neuronal communication in brain tissue slices9,10 and in cultured networks of neuronal cells.11-13 MEAs have also been used in a variety of studies, including drug discovery,14,15 diffusion of chemical species in solid electrolyte and electrolyte solutions,16 and chemical and biochemical sensing.17-22 Microfabrication technologies have been widely applied in the fabrication of MEAs.23-32 Alternative techniques have also been developed. Examples include chemical or electrochemical deposition of metals in nanoporous or microporous materials (polymers33,34 or glass35,36), chemical etching37 or micropatterning38 on metal-supported self-assembled monolayers (SAMs), and chemically attaching metal nanoparticles onto SAMs at the electrode surface.39
Individually addressable MEAs offer many advantages compared to their counter parts, such as high spatial resolution, the possibility of sensing multiple analytes using different microelectrodes in the array, and probing signal transmission in a network of biological cells. The Michael group reported a method of constructing two or four individually addressable carbon ultramicroelectrodes (radii ∼1 μm) separated by a distance of ∼15 μm.40 Each carbon fiber was etched into a sharp tip and then electrically isolated by coating the tip with poly(allylphenol). These electrochemical arrays were used to simultaneously probe dopamine release in the brain at multiple sites. In a recent report, Lindau and co-workers microfabricated an array of four gold disk electrodes on a chip and recorded exocytotic events simultaneously from these MEAs positioned under a single chromaffin cell.41 However, due to the patterning of the microelectrodes and relative size of the array compared to the cell, a large fraction of the cell membrane was not directly exposed to the electrode surfaces.
In this paper, we present the fabrication and characterization of micrometer-sized electrochemical probes containing closely packed arrays of carbon microdisk electrodes. The MEAs have compatible sizes to individual neuronal cells (10−20 μm). The fabrication method eliminates the need for complicated wiring, allowing several microelectrodes to fit in a small area. Steady-state voltammetry and numerical simulations have been compared to study the overlap of steady-state diffusive flux between adjacent microelectrodes and its effect on the independence of each microelectrode. We also describe differential electrochemical detection of exocytosis on single PC12 cells using an array of seven tightly packed carbon microelectrodes.
EXPERIMENTAL SECTION
Chemicals
KCl (99.9% Aldrich) and ferrocenemethanol (FcCH2-OH, 100%, Aldrich) were used as received. All solutions were made using 18 MΩ·cm water from a Millipore purification system.
Fabrication of Carbon MEAs
A single 5-μm-diameter carbon fiber (Amoco, Greenville, SC) was initially inserted into each barrel of a multibarrel glass capillary (2B150F-4, 3B120F-4, 7B100F-4, World Precision Instruments), as illustrated in Figure SI1 (Supporting Information) to create electrodes of two, three, and seven barrels (Figure 1). Multiple 12-cm-long pieces of carbon fiber were isolated from a bundle and immobilized using tape. A home-pulled thin glass capillary (∼0.4-mm o.d., ∼30-cm long) connected to an in-house vacuum was used to pull a single carbon fiber into each barrel. The thin vacuum glass was preinserted into one barrel of the multibarrel glass capillary. A single carbon fiber was then aspirated into the thin glass capillary. The vacuum capillary was then pulled out from the multibarrel glass leaving the fiber in the large capillary. The above step was repeated until each barrel was filled with a single carbon fiber. The multibarrel glass capillary was then pulled using a regular glass capillary puller (P-97, Sutter Instruments) to form two microtips. The pulled electrode tip was visually inspected under an optical microscope to ensure the fibers were uniform inside the pulled glass tip. To produce a good seal between the glass and the fiber, the pulled electrode tip was dipped into a freshly prepared epoxy (Epo-Tek, Epoxy Technology) for ∼5 min and cured in an oven (100 °C) for >24 h. The electrode tip was cut and polished at an angle of ∼60° on a microelectrode beveller (BV-10, Sutter Instruments). Each barrel was then back-filled with silver paint (Dupont). Electrical connection was made using a tungsten rod placed in each barrel. Epoxy was applied to secure the tungsten rods.
Figure 1.
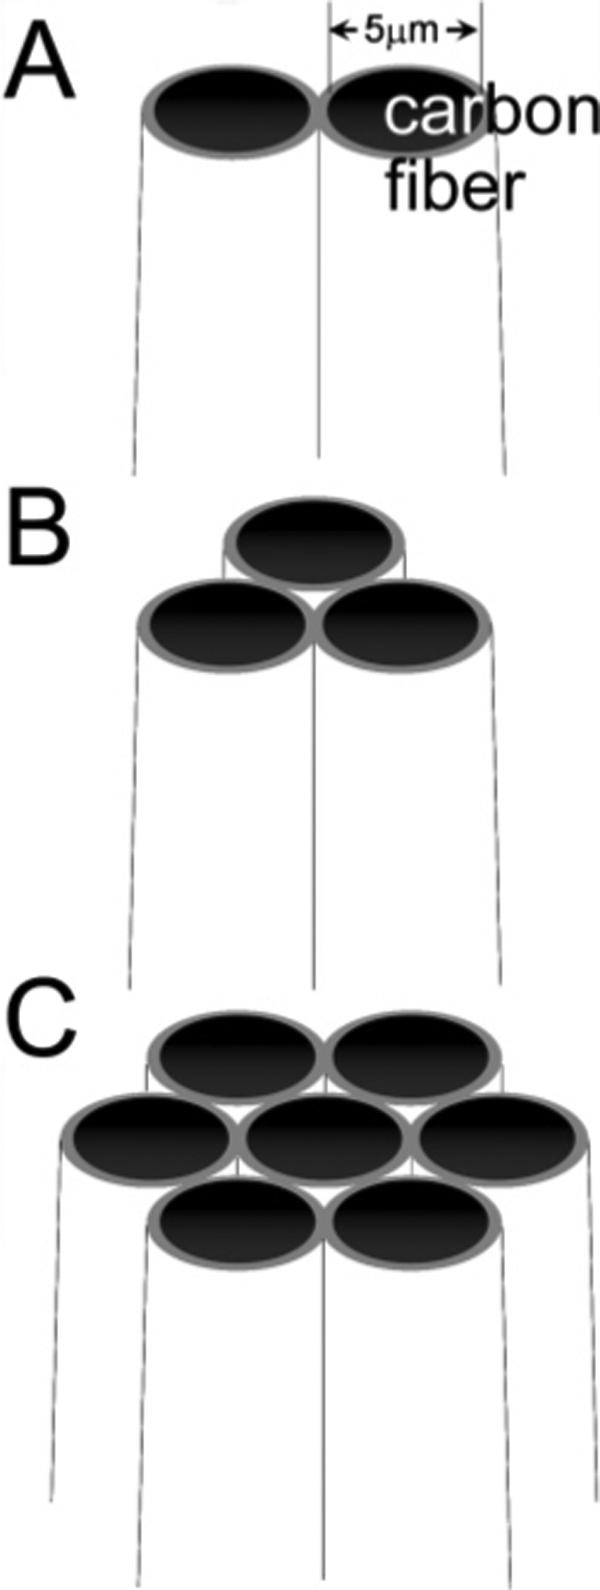
Schematic drawing of carbon fiber MEAs containing two (A), three (B), and seven (C) microdisks.
The number and the arrangement of the microelectrodes included in the array are preselected by using different multibarrel glass capillaries. We used two, three, and seven-barrel glass capillaries. The MEAs fabricated in the present research contain exclusively 5-μm-diameter carbon fibers. The distance between different electrodes is an important parameter in the response of MEAs.42-44 Due to the conical shape and tapered tip of the pulled electrode, this geometric parameter can be controlled in the polishing of the electrode. The more electrode material removed by polishing, the larger the interelectrode distance will be. We have been able to obtain MEAs having interelectrode distances (center to center) from as small as ∼6 μm to as large as 100 μm. Insulation is still maintained even when adjacent fibers are separated by submicrometer-thick glass due to the high resistivity of glass (>1014 Ω·m for borosilicate glass45).
Electrochemical Apparatus
A one-compartment, two-electrode cell was employed with the cell and preamplifier in a home-built Faraday cage. A Ag/AgCl electrode was used as the reference/auxiliary electrode. Four bipotentiostats (EI-400, Ensman) were used to perform the multichannel voltammetric measurements. The triangle waveform was generated from one potentiostat and was output to the other three bipotentiostats. The bipotentiostats were interfaced to a PC computer through a multichannel data acquisition system (Digidata 1440A, Molecular Devices). Voltammetric responses were plotted using Origin 7.5 (OriginLab). Electrochemical recordings on single PC12 cells were made on an inverted microscope (CK30, Olympus) placed in a Faraday cage. A glass micropipet containing high K+ (100 mM) solution was positioned ∼100 μm away to stimulate cell secretion. Each stimulus was applied for 5 s every 45 s at 30 psi using a Femtojet (Eppendorf). A constant potential (800 mV) was applied to each carbon microdisk with respect to a single Ag/AgCl reference electrode placed in the cell bathing solution. Other experimental details were performed as previously described.46
Scanning Electron Microscopy (SEM)
SEM images of the carbon-fiber MEAs were obtained using a FEI Quanta 3D 200 FIB/SEM at the Penn State nanofabrication facilities.
Finite-Element Simulations
The steady-state voltammetric response of a double-fiber-array microelectrode was simulated using Comsol Multiphysics 3.2 software (Comsol, Inc.) on a Dell PC (3GHz CPU, 2GB Memory).
RESULTS AND DISCUSSION
Surface and Size Characterization by SEM
Carbon MEAs have been characterized using SEM. Figure 2 shows typical SEM images of MEAs containing two, three, and seven microdisks, respectively. The electrodes are structurally well defined, and the overall diameters of the three-fiber and seven-fiber MEAs are between 15 and 20 μm, respectively. The 2.5-μm-radius carbon disks are tightly packed together and surrounded by a thin layer of glass ( ∼1−2 μm).
Figure 2.
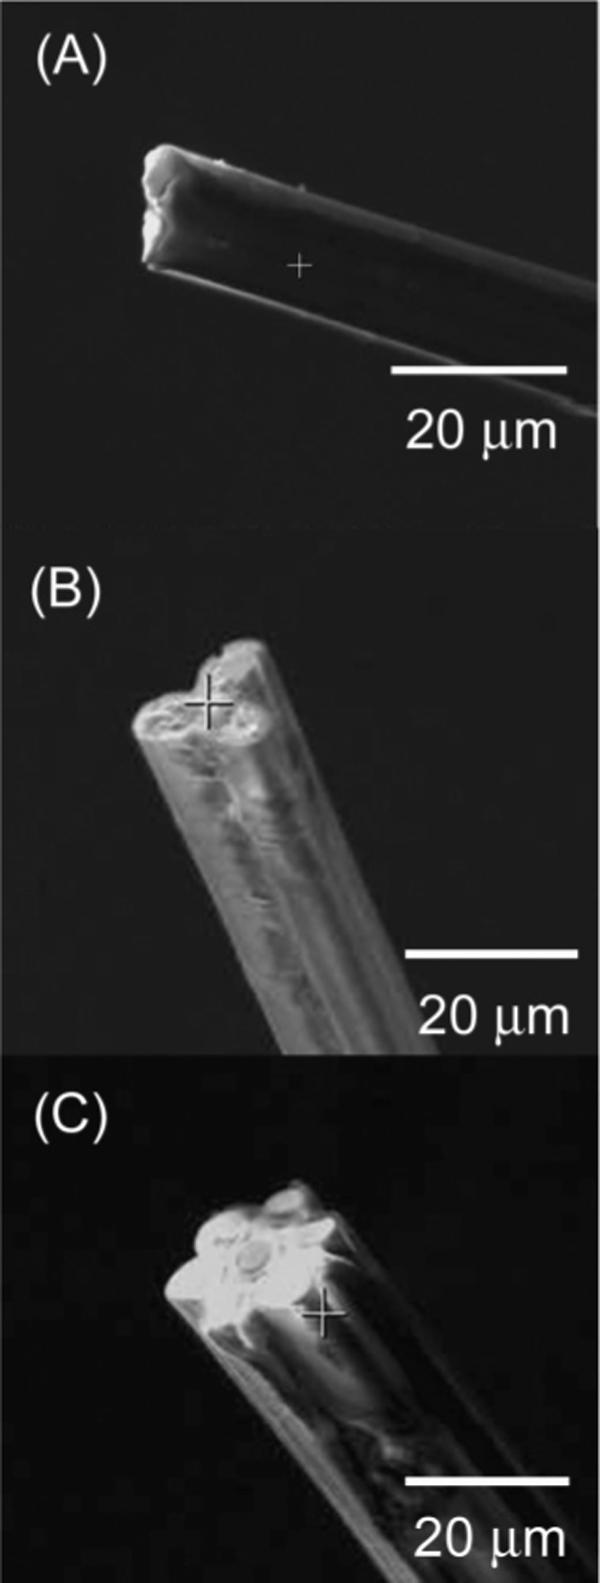
Scanning electron microscopy of carbon fiber MEAs having two (A), three (B), and seven (C) microdisks.
Steady-State Voltammetric Response of the Two-Fiber MEAs
Figure 3 shows the steady-state voltammetric response of a two-fiber MEA at 10 mV/s in an aqueous solution containing 1 mM FcCH2OH and 0.2 M KCl. The interelectrode distance, d, is ∼6.5 μm in this case. Traces a and b in Figure 3 display the voltammetric response of Ea and Eb when the other is open circuited, respectively. Figure 3c shows the steady-state voltam-metric response when Ea and Eb are connected and voltammetry measured at both electrodes collectively.
Figure 3.
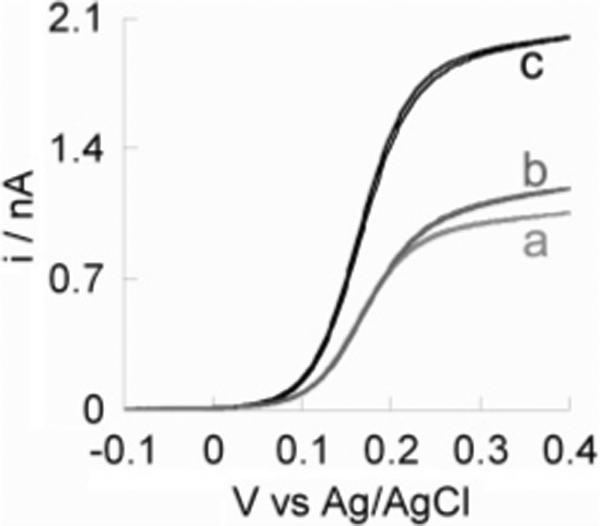
Steady-state voltammetric response of a two-fiber MEA in 1 mM FcCH2OH containing 0.2 M KCl at a scan rate of 10 mV/s; (a) the response of microelectrode a alone, (b) the response of microelectrode b alone, and (c) the response of both microelectrodes operated and connected together.
For a disk-shape microelectrode embedded in an infinitely thick insulating material, the steady-state limiting current, id, is described using the following equation,47
| (1) |
where n is the number of electrons transferred per molecule, F is Faraday's constant, D is the diffusion coefficient, and C* and a are the bulk concentration of the redox molecule and the radius of the microelectrode, respectively. In the case of carbon MEAs, the thickness of the insulating glass is small compared to the radii of the carbon microdisks. Thus, the measured steady-state limiting current is in fact larger than what is predicted using eq 1. The predicted limiting current, id, using eq 1, is 753 pA on a 2.5-μm-radius disk microelectrode in 1 mM FcCH2OH (D = 7.8 × 10⁻⁶ cm2/s).48 The actual measured limiting currents are 1100 and 1020 pA for Ea and Eb, respectively, which are ∼46 and ∼35% larger than the predicted value. The difference in limiting current is apparently due to the underestimated diffusive flux of redox molecule from the bulk to the electrode. This concept has been simulated for small electrodes of varied insulation thickness.49 In this perspective, the steady-state voltammetric response of a carbon microelectrode is better described by using the equation for a hemispherical microelectrode50
| (2) |
where the only difference is a larger constant, 2π, as compared to 4 in eq 1. The computed limiting current, id, is 1180 pA using eq 2, in fair agreement with what is measured at each carbon microelectrode.
Figure 3c shows the overall steady-state voltammetric response of the two carbon fibers measured when they are connected. The limiting current in Figure 3c is in fact ∼15% smaller than the sum of the limiting currents individually measured at the two micro-electrodes. Experiments and numerical simulations have shown that the voltammetric response of a 2D microdisk electrode array is largely affected by its interelectrode distances: when microdisks are well separated, they behave like individual electrodes; when they are close to each other, they behave like a macroelectrode.42-44 In our case, there is clearly overlap of the depletion layers at the two electrodes.
The effects of d on the steady-state voltammetric response of a two-fiber MEA have been studied by Baur and Motsegood by the use of both steady-state electrochemical measurements and numerical simulations.51 In the following section, we present a finite-element simulation of the distribution of diffusive flux at the electrodes to visualize the overlap of the diffusion layers.
Finite-Element Simulation of the Steady-State Diffusive Flux at a Two-Fiber MEA
The numerical simulation of diffusive flux was accomplished in 3D space using a steady-state diffusion model (using Comsol software Ver. 3.2, Comsol Inc.).52 In the simulation, the radii (a = 2.5 μm) and the length (100 μm, 40× larger than a) of the microdisk electrodes were held constant and the interelectrode distance was varied. A 500-μm (200× lager than a) cubic box was used as the electrochemical cell, in which the concentration of redox species at the surface of cubic box (1 mM) and at the electrode surface (0 mM) were held constant. For simplicity, the thickness of the insulation material surrounding and between the two microdisks was not considered; thus, the calculated current is likely to be slightly larger than what is obtained experimentally. However, this should not affect the analysis of the “cross talk” between the two microelectrodes significantly. A schematic drawing of the electrochemical cell and the electrodes is given in the Supporting Information, Figure SI2. The normalized steady-state current from the simulation is in good agreement with the experimental data (Figure SI3). Both the simulation and the experiment show that when (d/a) is ∼5, they behave independently.
The interelectrode distance required for isolation of responses can be qualitatively understood by use of a computer-simulated spatial distribution of steady-state flux of redox species. Figure 4 displays the simulated cross-sectional distribution of the steady-state flux of the redox molecules (1 mM FcCH2OH, Vapp = 0.5 V vs Ag/AgCl) near the electrode surface. The overlap of the flux of redox molecules from bulk solution to the two microdisks can be easily visualized when d is small compared to the radius of the electrode (e.g., d/a = 2.4), as shown in Figure 4A. It is smaller (but still noticeable) when d/a is 4, as shown in Figure 4B. However, when d becomes even larger, as displayed in Figure 4C (d/a = 10) and D (d/a = 20), no significant overlap is observed in the simulated data. This is in agreement with the steady-state electrochemical responses of the two microelectrodes.
Figure 4.
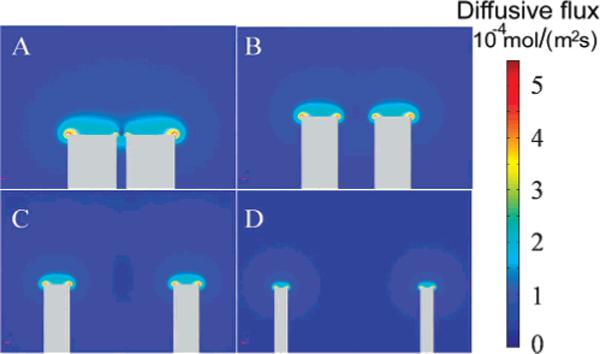
Simulated distribution of steady-state diffusive flux at the cross section of a 5-μm two-fiber MEA as a function of the interelectrode distance. The d/a are (A) 2.4, (B) 4, (C) 10, and (D) 20, respectively.
Voltammetric Response of a Seven-Fiber MEA
Steady-state and fast-scan voltammetry has been used to characterize a seven-carbon-fiber MEA. An optical microscopy image shows that the electrode has a total tip dimension of ∼20 μm, which indicates that the interelectrode distance in the array is ∼7 μm. As the diameter of each microdisk is 5 μm, the thickness of the glass between adjacent fibers is ∼2 μm. Figure 5A—G shows the steady-state voltammetric response of each microelectrode (Figure 5 shows the relative position of each microelectrode in the array) measured simultaneously at 20 mV/s in 1 mM FcCH2OH and 0.2 M KCl. The voltammetric response is well defined and has a sigmoidal shape at this scan rate. The steady-state limiting current at each microelectrode is approximately the same, except for Eg (Figure 5G). Close inspection of the voltammogram in Figure 5G indicates that the diffusion-limited steady-state current for the center electrode is ∼40% smaller than that observed for the edge electrodes (A—F). The limiting current for the surrounding electrodes is ∼610 pA, which is 48% smaller than what is predicted using eq 2. This difference is apparently due to geometrically hindered diffusion combined with depletion of the analyte by the surrounding electrodes. This is more evident for the center electrode as the limiting current at this electrode is somewhat shielded by the collection of microelectrodes surrounding it.
Figure 5.
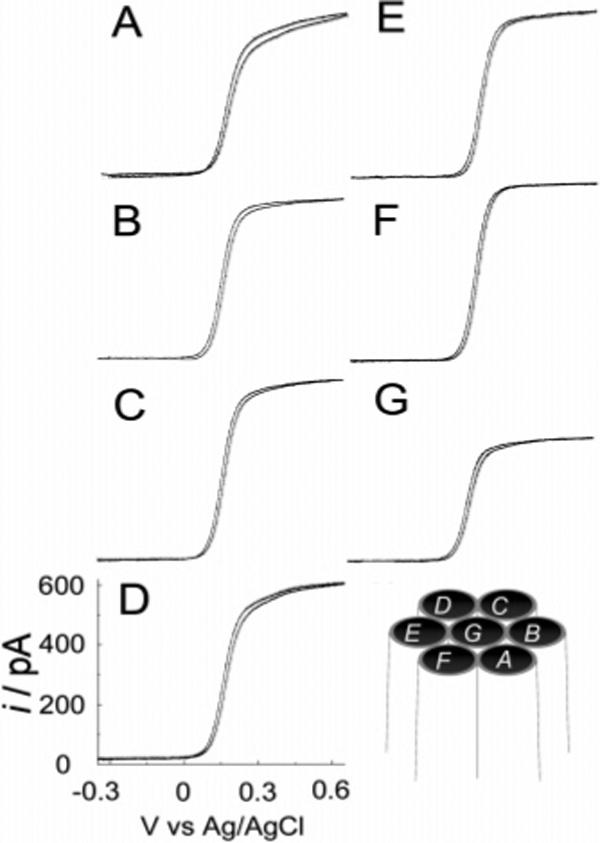
Steady-state voltammetric response at 20 mV/s of a seven-fiber MEA in 1 mM FcCH2OH and 0.2 M KCl. (A)—(G) are the voltammetric response of individual microelectrodes A—G as shown in the schematic of the microelectrode assemble shows in the bottom right.
Figure 6A—G shows the raw fast-scan voltammetric responses of each electrode in the same seven-fiber MEA at 300 V/s in the same solution. On top of the capacitive charging current are two voltammetric peaks corresponding to oxidation and reduction of FcCH2OH and FcCH2OH+, respectively. The average double-layer charging current is ∼3 nA, which corresponds to a double-layer capacitance of ∼10 pF at each electrode (∼51 μF/cm2). The peak currents at electrodes Ea-Eg are approximately the same, ∼3 nA. No significant difference is found in the fast-scan voltammetric response of Eg (e.g., Figure 6G), indicating that the depletion layer is small as the voltammetric response is due mainly to molecules adjacent to the electrode at this scan rate.53 These results demonstrate that the microelectrodes are individually addressable and behave ideally in voltammetric measurements.
Figure 6.

Fast-scan voltammetric response (300 V/s) of the same seven-fiber MEA in 1 mM FcCH2OH and 0.2 M KCl. (A)—(G) are the voltammetric response of individual microelectrodes A—G (as seen in Figure 5).
Here we have used the MEA to carry our measurements of exocytosis at single cells. To measure exocytosis in single-cell experiments, a microdisk electrode is typically placed close to the cell membrane to detect released transmitter. Released transmitters are oxidized locally and free diffusion is minimized by the small electrode/cell separation.
Amperometric Detection of Neurotransmitter Release from Single PC12 Cells: An Electrochemical Array Image
Electrochemical recordings using carbon MEAs are expected to provide excellent temporal resolution and allow simultaneous examination of different membrane areas with subcellular resolution. We have used this ability to compare biofunctionality in terms of exocytosis. Figure 7A shows an optical micrograph of a carbon MEA placed on a single PC12 cell. A glass micropipette containing high K+ solution (100 mM) was positioned ∼100 μm away to stimulate secretion. Figure 7B displays a 16-min amperometric recording of exocytotic events at a single PC12 cell. Each current transient corresponds to the electrochemical oxidation of dopamine molecules secreted from a single intracellular vesicle.
Figure 7.
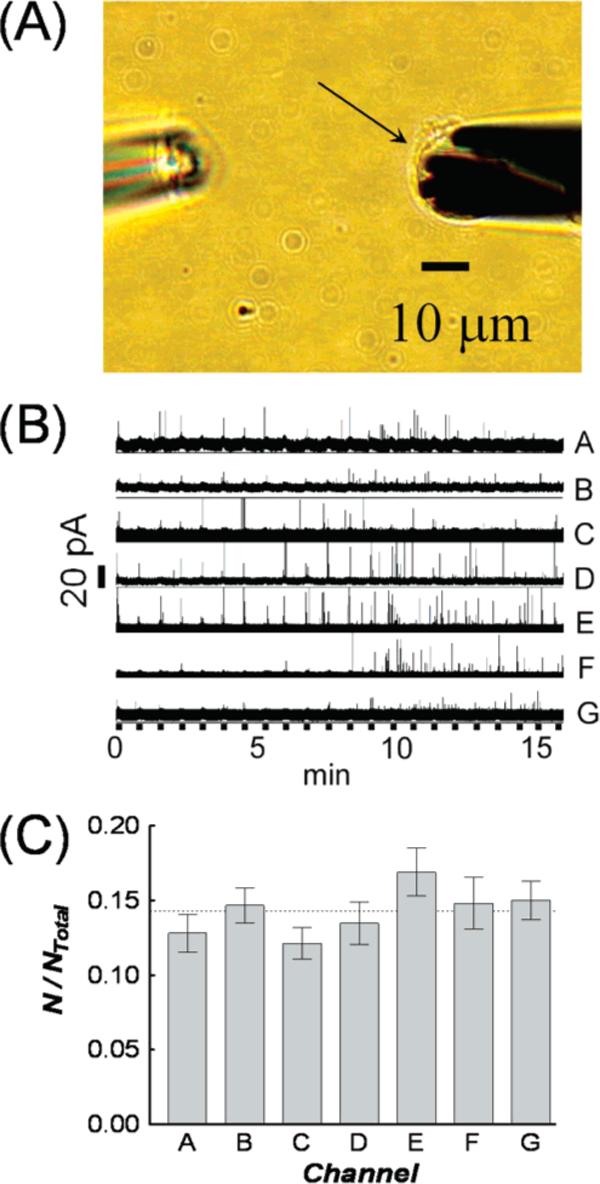
(A) Optical image showing a microelectrode array positioned over a single PC12 cell (right) and a stimulation pipet (left). The cell is denoted with an arrow. (B) Amperometric traces of exocytotic release from a PC12 cell recorded using a microelectrode array. Thick black lines along the time axis indicate exposure to high potassium stimuli (100 mM, 5-s pulse every 45 s). (C) The average value of normalized number of exocytotic events recorded with each electrode in the array. Eight different microelectrode arrays were use to examine 16 PC12 cells. Error bars are (S.E.M.
Noticeable in Figure 7B is subcellular heterogeneity observed in single-cell exocytosis. For example, the area of cell membrane under Ef shows fewer events than the others during the first 8 min and appears to be a “cold spot”. More interestingly, spots may be “hot” during a specific period, but then change to be “cold” (or vice versa) after another stimulus. Close inspection of the response from Ea shows there are fewer events detected after the second and the fifth stimuli than after the third and fourth. In addition, Ef and Eg clearly detected more events in the last 8 min than in the first. Thus, it appears that the array electrode format allows detection of localized membrane function in terms of exocytosis at a single cell.
The detection probability on each channel was compared from 16 different PC12 cells (n = 8 electrode arrays) to ensure the differences detected with each channel do not arise from systematic errors, such as electrode placement or response. The number of events at each channel was normalized to the total number of events at a cell before averaging. Figure 7C displays a comparison of the averaged value of normalized number of events for each channel recorded from 16 PC12 cells. From the averaged data, there are no significant differences among the channels (P value = 0.35, one-way ANOVA), indicating that differences seen in the number of detected exocytotic events at a given cell reflect the subcellular spatial heterogeneity in the exocytosis process.
Resolving Concurrent Exocytotic Events in Single-Cell Amperometric Detection Using Multifiber MEAs
Another issue that can be examined with array electrodes is the incidence of concurrent events on the same cell. When more than one event occurs simultaneously, it is challenging to resolve them using a single microelectrode. In the absence of spatial resolution, these events will overlap and result in a large, broad current spike. Simultaneous, parallel recordings using multiple microelectrodes allow these events to be resolved based on spatial identification. Figure 8 shows a 1-s amperometric recording on a single PC12 cell using a seven-fiber MEA. The red arrows indicate three different exocytotic events detected from Eb, Ec, and Eg, respectively. The events are extremely similar temporally that with one electrode they would form a single large, broader current spike. Although rare, these overlapping events can be spatially resolved by our seven-fiber MEA. The multiple detection sites present allow the temporally synchronous release events present at different electrodes to be resolved.
Figure 8.
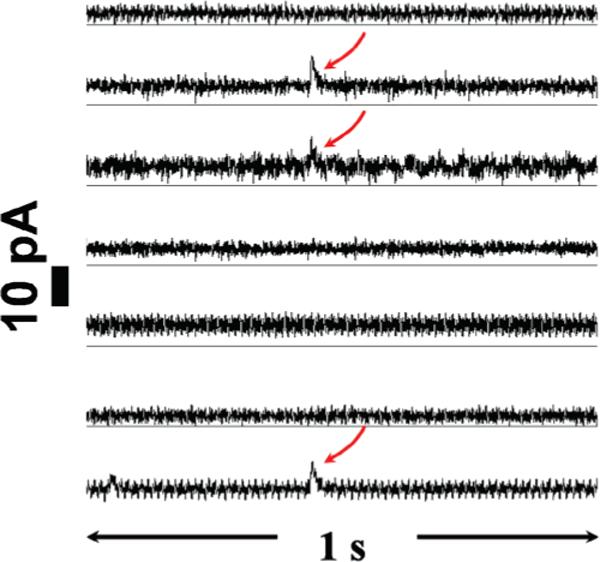
A 1-s time period of an exocytotic response of a PC12 cell after potassium stimulation showing simultaneous detection of concurrent events at different locations on the same cell. Red arrows indicate these events.
CONCLUSIONS
We have fabricated carbon-fiber MEAs that are applicable for spatially probing chemical changes in tight spaces, such as studying exocytosis from different regions of single-cell surfaces. Electron microscopic characterization showed that these microsensor arrays were on the order of 20 μm and were geometrically well defined. Finite-element simulation was applied to qualitatively study the “cross talk” in a two-fiber MEA. Steady-state and fast-scan voltammetric responses demonstrated that the MEAs have well-defined electrochemical behavior and each microelectrode can be individually addressed. A seven-fiber MEA was used for simultaneous electrochemical monitoring of exocytotic events from different surface regions of single PC12 cells. Subcellular heterogeneity in exocytosis was shown with 5-μm resolution. Concurrent exocytotic events under different micro-electrodes were also resolved using MEAs. These results show that carbon-fiber-based microelectrode arrays are suitable for electrochemical imaging of fast exocytotic events at single cells.
Supplementary Material
ACKNOWLEDGMENT
We thank Michael F. Santillo for his help in numerical simulations. This publication was supported by The Pennsylvania State University MRI Nano Fabrication Network and the NSF Cooperative Agreement 0335765, National Nanotechnology Infrastructure Network, with Cornell University. This work was supported by funding from the NIH. A.G.E. is supported by a Marie Curie Chair from the European Union 6th Framework.
Footnotes
SUPPORTING INFORMATION AVAILABLE
Illustration showing the insertion of single 5-μm carbon fibers in a multibarrel glass capillary, schematic of the electrochemical cell and the electrode used in numerical simulations, comparison of the experimental and the simulated data of the normalized steady-state limiting current at a two-fiber MEA, and steady-state voltammetric response of a three-fiber MEA. This material is available free of charge via the Internet at http://pubs.acs.org.
References
- 1.Kandel ER, Schwartz JH, Jessell TM. Principles of Neural Science. 4th ed. McGraw Hill; New York: 2000. [Google Scholar]
- 2.Weber T, Zemelman BV, McNew JA, Westermann B, Gmachl M, Parlati F, Sollner TH, Rothman JF. Cell. 1998;92:759. doi: 10.1016/s0092-8674(00)81404-x. [DOI] [PubMed] [Google Scholar]
- 3.Wightman RM, Jankowski JA, Kennedy RT, Kawagoe KT, Schroeder TJ, Leszczyszyn DJ, Near JA, Diliberto EJ, Jr., Viveros OH. Proc. Natl. Acad. Sci. U.S.A. 1991;88:10754. doi: 10.1073/pnas.88.23.10754. [DOI] [PMC free article] [PubMed] [Google Scholar]
- 4.Chen TK, Luo G, Ewing AG. Anal. Chem. 1994;66:3031. doi: 10.1021/ac00091a007. [DOI] [PubMed] [Google Scholar]
- 5.Wightman RM. Science. 2006;311:1570. doi: 10.1126/science.1120027. [DOI] [PubMed] [Google Scholar]
- 6.Mosharov E, Sulzer D. Nat. Methods. 2005;2:651. doi: 10.1038/nmeth782. [DOI] [PubMed] [Google Scholar]
- 7.Schroeder TJ, Jankowski JA, Senyshyn J, Holz RW, Wightman RM. J. Biol. Chem. 1994;269:17215. [PubMed] [Google Scholar]
- 8.Stefan RI, Staden JFV, Aboul-Ensin HY. Crit. Rev. Anal. Chem. 1999;29:133. doi: 10.1080/10408349891199293. [DOI] [PubMed] [Google Scholar]
- 9.Droge MH, Gross GW, Hightower MG, Czisny LE. J. Neurosci. 1986;6:1583. doi: 10.1523/JNEUROSCI.06-06-01583.1986. [DOI] [PMC free article] [PubMed] [Google Scholar]
- 10.Wilson M. Multiple-Electrode Recordings of Neuronal Ensemble Activity. In: Buzsaki G, editor. Visualizing Large-Scale Patterns of Activity in the Brain: Optical and Electrical Signals. Society for Neuroscience; Atlanta, GA: 2006. pp. 9–16. [Google Scholar]
- 11.Maher MP, Pine J, Wright J, Tai YC. J. Neurosci. Methods. 1999;87:45. doi: 10.1016/s0165-0270(98)00156-3. [DOI] [PubMed] [Google Scholar]
- 12.Suzuki I, Sugio Y, Jimbo Y, Yasuda K. Lab Chip. 2005;5:241. doi: 10.1039/b406885h. [DOI] [PubMed] [Google Scholar]
- 13.Arcibal I, Santillo MJ, Ewing AG. Unpublished results.
- 14.Yeung CK, Sommerhage F, Wrobel G, Offenhausser A, Chan M, Ingebrandt S. Anal. Bioanal. Chem. 2007;387:2673. doi: 10.1007/s00216-007-1172-8. [DOI] [PubMed] [Google Scholar]
- 15.Stett A, Egert U, Guenther E, Hofmann F, Meyer T, Nisch W, Haemmerle H. Anal. Bioanal. Chem. 2003;377:486. doi: 10.1007/s00216-003-2149-x. [DOI] [PubMed] [Google Scholar]
- 16.a Licht S, Cammarata V, Wrighton MS. Science. 1989;243:1176. doi: 10.1126/science.243.4895.1176. [DOI] [PubMed] [Google Scholar]; b Cammarata V, Talham DR, Crooks RM, Wrighton MS. J. Phys. Chem. 1990;94:2680. [Google Scholar]
- 17.a Gavin PF, Ewing AG. J. Am. Chem. Soc. 1996;118:8932. [Google Scholar]; b Gavin PF, Ewing AG. Anal. Chem. 1997;69:3838. [Google Scholar]
- 18.Belmont-Hebert C, Tercier ML, Buffle J, Fiaccabrino CC, De Rooij NF, Koudelka-Hep M. Anal. Chem. 1998;70:2949. [Google Scholar]
- 19.Feeney R, Kounaves SP. Anal. Chem. 2000;72:2222. doi: 10.1021/ac991185z. [DOI] [PubMed] [Google Scholar]
- 20.Wang J, Chen Q. Anal. Chem. 1994;66:1007. [Google Scholar]
- 21.Niwa O, Xu Y, Halsall HB, Heineman WR. Anal. Chem. 1993;65:1559. doi: 10.1021/ac00059a013. [DOI] [PubMed] [Google Scholar]
- 22.Fan Y, Chen X, Trigg AD, Tung CH, Kong J, Gao Z. J. Am. Chem. Soc. 2007;129:5437. doi: 10.1021/ja067477g. [DOI] [PubMed] [Google Scholar]
- 23.Lanyon YH, Arrigan DWM. Sens. Actuators, B. 2007;121:341. [Google Scholar]
- 24.Sandison ME, Cooper JM. Lab Chip. 2006;6:1020. doi: 10.1039/b516598a. [DOI] [PubMed] [Google Scholar]
- 25.a Nolan MA, Kounaves SP. Anal. Chem. 1999;71:3567. [Google Scholar]; b Feeney R, Kounaves SP. Electroanalysis. 2000;12:677. [Google Scholar]
- 26.a Nagale MP, Fritsch I. Anal. Chem. 1998;70:2902. [Google Scholar]; b Nagale MP, Fritsch I. Anal. Chem. 1998;70:2908. [Google Scholar]
- 27.Sandison ME, Anicet N, Glidle A, Cooper JM. Anal. Chem. 2002;74:5717. doi: 10.1021/ac025649w. [DOI] [PubMed] [Google Scholar]
- 28.Li J, Ng HT, Cassell A, Fan W, Chen H, Ye Q, Koehne J, Han J, Meyyappan M. Nano Lett. 2003;3:597. doi: 10.1088/0957-4484/14/12/001. [DOI] [PubMed] [Google Scholar]
- 29.Sreenivas G, Ang SS, Fritsch I, Brown WD, Greg AG, Woodward DJ. Anal. Chem. 1996;68:1858. doi: 10.1021/ac9508816. [DOI] [PubMed] [Google Scholar]
- 30.Wang K, Fishman HA, Dai HJ, Harris JS. Nano Lett. 2006;6:2043. doi: 10.1021/nl061241t. [DOI] [PubMed] [Google Scholar]
- 31.Li X, Zhou Y, Sutherland TC, Baker B, Lee JS, Kraatz HB. Anal. Chem. 2005;77:5766. doi: 10.1021/ac050741o. [DOI] [PubMed] [Google Scholar]
- 32.Zoski CG, Yang N, He P, Berdondini L, Koudelka-Hep M. Anal. Chem. 2007;79:1474. doi: 10.1021/ac0619534. [DOI] [PubMed] [Google Scholar]; b Zoski CG, Simjee N, Guenat O, Koudelka-Hep M. Anal. Chem. 2004;76:62. [Google Scholar]
- 33.a Menon VP, Martin CR. Anal. Chem. 1995;67:1920. [Google Scholar]; b Ugo P, Moretto LM, Bellomi S, Menon VP, Martin CR. Anal. Chem. 1996;68:4160. doi: 10.1021/ac960580b. [DOI] [PubMed] [Google Scholar]; c Martin CR. Science. 1994;266:1961. doi: 10.1126/science.266.5193.1961. [DOI] [PubMed] [Google Scholar]; d Cepak VM, Hulteen JC, Che G, Jirage KB, Lakshmi BB, Fisher ER, Martin CR, Yoneyhama H. Chem. Mater. 1997;9:1065. [Google Scholar]
- 34.Krishnamoorthy K, Zoski CG. Anal. Chem. 2005;77:5068. doi: 10.1021/ac050604r. [DOI] [PubMed] [Google Scholar]
- 35.Merritt CD, Justus BL. Chem. Mater. 2003;15:2520. [Google Scholar]
- 36.Szunerits S, Walt DR. Anal. Chem. 2002;74:1718. doi: 10.1021/ac010933t. [DOI] [PubMed] [Google Scholar]
- 37.a Baker WS, Crooks RM. J. Phys. Chem. B. 1998;102:10041. [Google Scholar]; b Crooks RM, Ricco AJ. Acc. Chem. Res. 1998;31:219. [Google Scholar]
- 38.He HX, Li QG, Zhou ZY, Zhang H, Li SFY, Liu ZF. Langmuir. 2000;16:9683. [Google Scholar]
- 39.Cheng W, Dong S, Wang E. Anal. Chem. 2002;74:3599. doi: 10.1021/ac025661o. [DOI] [PubMed] [Google Scholar]
- 40.Dressman SF, Peters JL, Michael AC. J. Neuronsci. Methods. 2002;119:75. doi: 10.1016/s0165-0270(02)00180-2. [DOI] [PubMed] [Google Scholar]
- 41.Hafez I, Kisler K, Berberian K, Dernick G, Valero V, Yong MG, Craighead HG, Lindau M. Proc. Natl. Acad. Sci. U.S.A. 2005;102:13879. doi: 10.1073/pnas.0504098102. [DOI] [PMC free article] [PubMed] [Google Scholar]
- 42.Sandison ME, Anicet N, Glidle A, Cooper JM. Anal. Chem. 2002;74:5717. doi: 10.1021/ac025649w. [DOI] [PubMed] [Google Scholar]
- 43.a Lee HJ, Beriet C, Ferrigno R, Girault HH. J. Electroanal. Chem. 2001;502:138. [Google Scholar]; b Beriet C, Ferrigno R, Girault HH. J. Electroanal. Chem. 2000;486:56. [Google Scholar]
- 44.a Morf WE. Anal. Chim. Acta. 1996;330:139. [Google Scholar]; b Morf WE. Anal. Chim. Acta. 1997;341:121. [Google Scholar]; c Morf WE, Rooij NF. Sensors Actuators, B. 1997;44:538. [Google Scholar]
- 45.Harper CA, editor. Handbook of Ceramics Glasses, and Diamonds. McGraw-Hill; New York: 2001. [Google Scholar]
- 46.Sombers LA, Hanchar HJ, Colliver TL, Wittenberg N, Cans A-S, Arbault S, Amatore C, Ewing AG. J. Neurosci. 2004;24:303. doi: 10.1523/JNEUROSCI.1119-03.2004. [DOI] [PMC free article] [PubMed] [Google Scholar]
- 47.Saito Y. Rev. Polarogr. (Jpn.) 1968;15:177. [Google Scholar]
- 48.Miao W, Ding Z, Bard AJ. J. Phys. Chem. B. 2002;106:1392. [Google Scholar]
- 49.Shoup D, Szabo A. J. Electroanal. Chem. 1984;160:27. [Google Scholar]
- 50.Bard AJ, Faulkner LR. Electrochemical Methods. 2nd ed. John Wiley & Sons; New York: 2001. [Google Scholar]
- 51.Baur JE, Motsegood PN. J. Electroanal. Chem. 2004;572:29. [Google Scholar]
- 52.Zhang B, Zhang Y, White HS. Anal. Chem. 2004;76:6229. doi: 10.1021/ac049288r. [DOI] [PubMed] [Google Scholar]
- 53.The distance that the redox molecule diffuses, δ = (2Dtexpt)0.5, at the time of the voltammetric experiment (texpt = RT/νF), is ∼0.36 μm.
Associated Data
This section collects any data citations, data availability statements, or supplementary materials included in this article.