Abstract
Background
Members of the calcium-activated chloride channel (CLCA) gene family have been suggested to possess a variety of functions including cell adhesion and tumor suppression. Expression of CLCA family members has mostly been analyzed in non-neural tissues. Here we describe the expression of mouse and human CLCA genes in the nervous system.
Results
We show that from the six mouse CLCA family members only Clca1, Clca2 and Clca4 mRNAs are expressed in the adult brain, predominantly in olfactory ensheathing cells. During mouse nervous system development Clca1/2 is more widely expressed, particularly in cranial nerves, the diencephalon and in the cerebral cortex. While human CLCA2 and CLCA4 genes are widely expressed in brain, and at particularly high levels in the optic nerve, human CLCA3, the closest homologue of mouse Clca1, Clca2 and Clca4, is not expressed in the brain. Furthermore, we characterize the expression pattern of mouse Clca1/2 genes during embryonic development by in situ hybridization.
Conclusion
The data published in this article indicate that within the nervous system mouse Clca1/2 genes are highly expressed in the cells ensheathing cranial nerves. Human CLCA2 and CLCA4 mRNAs are expressed at high level in optic nerve. High level expression of CLCA family members in mouse and human glial cells ensheathing nerves suggests a specific role for CLCA proteins in the development and homeostasis of these cells.
Background
Calcium activated chloride currents have been characterized in a number of cell types including smooth muscle, skeletal muscle and epithelium. Physiologically, it has been shown that activation of calcium-activated chloride current plays a prominent role in among others the maintenance of smooth muscle tone, epithelial secretion and vertebrate olfactory transduction. The precise molecular identities of the currents are still hotly debated. Proteins belonging to CLC, CLCA, bestrophin and tweety gene families have been proposed to function as calcium activated chloride channels [reviewed in [1]].
The CLCA gene family includes 4 genes in humans, 5 genes in rat and 6 genes in mouse. The nomenclature of the CLCA genes in different organisms is somewhat confusing since the numbering of different genes does not reflect the actual homologies between the genes in different organisms but rather the time of characterization [reviewed in [2]].
Although a lot of evidence shows the involvement of CLCA proteins in mediating chloride conductance, it is still unclear whether CLCA proteins are channels themselves. It has been shown that there are differences in endogenous chloride current characteristics in normal versus CLCA over-expressed cells [3]. Also, at least some of the CLCA family members appear to be secreted proteins [4,5]. Recently, using protein structure prediction, it has been proposed that CLCA proteins are membrane anchored or secreted metal-dependent hydrolases [6].
In addition to their functions as chloride channels or channel modulators, some CLCA family members function as cell adhesion molecules [7,8] and tumor suppressor proteins [9]. It has also been proposed that CLCA family members are involved in respiratory diseases like asthma [10,11] and cystic fibrosis [12].
Expression analysis by RT-PCR of mouse Clca family members, has revealed that mClca1 is expressed at high levels in spleen and bone marrow and mClca2 in mammary gland. Moderate or low expression levels of both genes were found in most tissues with only mClca1 expressed in brain tissue [13]. Expression analysis of mClca3, a secreted member of the CLCA family, has been performed by immunohistochemistry. The mClca3 protein was found only in the mucine granule membranes of the gastrointestinal and respiratory tract, uterine goblet cells and other mucin producing cells [14]. RT-PCR analysis revealed that mClca4 mRNA is also expressed in the gastrointestinal tract, as well as uterus, skeletal muscle, heart and lung [15]. RT-PCR analysis of mClca5 and 6 showed high expression of mClca5 in mouse eye and spleen, whereas mClca6 is expressed highly in the gastrointestinal tract [16].
To date, expression analysis has shown that only mClca1 is expressed in the mouse brain. However, in case of mClca3 and 4, brain tissue was not included in the expression analysis. In this study we describe the spatio-temporal expression of mClca1, 2 and 4 genes in the nervous system. We show that these genes are expressed in the olfactory ensheathing cells. In addition we also describe the expression pattern of human CLCA2 and 4 genes in the nervous system. Finally, we describe the expression pattern of mClca1/2 during embryonic development by in situ hybridization.
Methods
RT-PCR analysis
Total RNA from NMRI mouse tissues and total RNA from postmortem adult human brain regions was extracted using RNAWiz (Ambion) according to the manufacturers instructions. Total RNA from human non-neural tissues was obtained from Clontech. First-strand cDNAs were synthesized with Superscript III (Invitrogen) reverse transcriptase using 5 μg RNA as recommended by the manufacturer.
PCR reactions were performed in a volume of 25 μl, using 1/50 of the first-strand cDNA reaction. Annealing temperature for different sets of primers ranged from 55–60°C. The number of cycles used varied from 25–35 for different primer sets. Number of cycles for different primer sets was determined empirically and we always analysed the PCR product in the exponential phase of amplification. PCR with primers specific for housekeeping gene HPRT and GAPDH were used as a control to determine the variation of the amount of cDNA in different PCR reactions.
Real-time quantitative (Q) RT-PCR analysis of CLCA mRNA levels in adult mouse and human brain regions and during mouse brain development was performed in triplicates using qPCR Core Kit for SYBR Green I (Eurogentec) with Lightcycler 2.0 (Roche) according to manufacturers instructions. Data was normalized with housekeeping gene HPRT and analyzed with Lightcycler 4.05 software (Roche). Data was not normalized with HPRT in case of mClca1, mClca2 and mClca4 PCRs using equal amounts of cDNAs from different mouse brain developmental stages, since the level of HPRT mRNA is increased during development (Piirsoo and Timmusk, unpublished data).
Primers used in the experiments are the following:
hclca1 sense ACGAACAAGGACACCAGCAAA
hclca1 antisense AAGAGATCAGGTATGGGAGCAT
hclca2 sense TGCATGTCAATCACTCTCCCA
hclca2 antisense GAGTTCCTATCCATTGCTCGT
hclca3 sense GAAGGAGCTCAAACAGACGAC
hclca3 antisense ACTTTCTACTGAACCAGGCTC
hclca4 sense GCCACAGTTCATGAGGATAAG
hclca4 antisense CACAGACAATACCAGCGTAG
mclca1sense CACCAGGATCACTGGCACCAAT
mclca1 antisense GCATCGATAAGGCTGTTTAGGTC
mclca2 sense CGCCAGCATCACAGGCAAGAAG
mclca2 antisense GCGTCGATAAGGCTGCTTACATG
mclca4 sense TTCAGCAGGACAGCATCTGG
mclca4 antisense TGCCACTTGTGCGATGTTG
gapdh sense TTCCTACCCCCAATGTGTCCGTC
gapdh antisense ACCCTGTTGCTGTAGCCGTATTCA
hprt sense GATGATGAACCAGGTTATGAC
hprt antisense GTCCTTTTCACCAGCAAGCTTG
hclca2real sense AGCACCTGGAGAAGACTTTGA
hclca2real asense CTTGCTGAGGATTTCGCTTTGA
hclca4real sense AGACCTTGATGCCACAGTTCAT
hclca4real asense TGGTGACAGATCAGTAGTATTTA
mclca1 realS CACTGATAACTTGCGTATCTAC
mclca1 realAS CACAGTTGTGAACCACATTGG
mclca2 realS TCACTGATAACTTGCGTATCTAT
mclca2 realAS ACACTCGTGGACCACCTTCT
mclca4 realS AATGACAGCTCCTACCTAGC
mclca4 realAS GGCTCCACTGTGTTTGACCT
In situ hybridization
DNA fragments for riboprobe generation were subcloned into pCRII-TOPO vector (Invitrogen), sense and antisense cRNA probes were synthesized with the MAXIScript In Vitro Transcription Kit (Ambion) T7 or SP6 RNA polymerase, using [α-35S]UTP (Amersham Biosciences, UK) for labeling. The hybridization specificity was confirmed using [α-35S]-labeled sense riboprobes synthesized from the same templates. All sense probes resulted in the hybridization signal equivalent to the background. This shows that cRNA labeling of different CLCAs was specific. Primers used to generate probes were the following:
CLCA12 sense ATAGTATCTCTGCACTGGTG
CLCA12 antisense GAATGGATATCTAATTTCCATAG
CLCA4 sense CCTCCTGGTCTGGGTACCAA
CLCA4 antisense ATAGACGCAAATAGGAAATTTAC
Serial saggital and coronal sections (14 μm) from fresh-frozen NMRI mouse brain were analyzed by in situ hybridization analysis following the previously described protocol [17]. Emulsion-dipped sections were developed after 3 weeks using D-19 developer (Eastman Kodak, USA), fixed (sodium fixer; Kodak), and counterstained with hematoxylin (Shandon, USA).
Results
Expression pattern of mouse Clca 1, 2 and 4 in the central nervous system
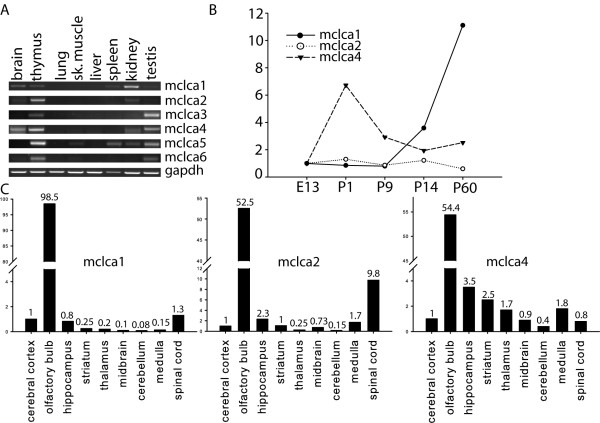
Previous analyses have shown that out of six mouse Clca genes only mClca 1 is expressed in the brain and is expressed at relatively low levels compared to other tissues where the gene is expressed [1]. Our RT-PCR analysis with cDNAs from adult mouse brain showed that in addition to mClca1, mClca2 and 4 are expressed at low levels in mouse brain. In accordance with previously published data we could not detect mClca3, 5 and 6 expression in adult mouse brain (Fig 1A). All six mouse Clca genes were expressed in thymus. In addition to brain and thymus we detected mClca1 expression in spleen, kidney and testis. mClca2 was expressed in brain, thymus and kidney, mClca3 in thymus and kidney, mClca4 in brain, thymus kidney and testis. mClca5 was most widely expressed in mouse tissues, with the highest expression in thymus and lower level of expression in skeletal muscle, spleen, kidney and testis. mClca6 was expressed in thymus, skeletal muscle and testis (Fig 1A).
Figure 1.
A) Semiquantitative RT-PCR analysis of mClca1-mClca6 and control mRNA gapdh expression in mouse tissues. B) Real-time PCR analysis of mClca1, mClca2 and mClca4 expression in the brain at indicated developmental timepoints. Expression level is shown relative to the expression level of the respective mRNA at embryonic day 13. C) Real-time PCR analysis of mClca1, mClca2 and mClca4 expression in mouse brain regions. Expression levels are shown relative to the expression level in the cerebral cortex.
Quantitative real-time PCR analysis of mClca1, 2 and 4 expression during mouse brain development showed that expression of mClca1 was increasing during postnatal brain development and reached maximum levels in the adult mouse brain. mClca2 expression did not change during mouse brain development and mClca4 expression was low during embryonic development, highest around birth of the animal and the level of respective mRNA was gradually decreasing during postnatal development (Fig 1B).
In order to analyze the spatial distribution of mClca1, 2 and 4 mRNA expression in the adult brain we performed real-time PCR anaysis using cDNAs from various regions of mouse brain. Strikingly, all the mClca genes expressed in the nervous system, were highly enriched in olfactory bulb (Fig 1C). Expression levels were quantified relative to the expression in cerebral cortex. mClca1 was expressed at 98 times higher level in olfactory bulb than in cerebral cortex. mClca2 and mClca4 were expressed at 52 and 54 times higher level in olfactory bulb than in cerebral cortex. mClca2 was expressed at 10 times higher level in spinal cord than in cerebral cortex (Fig 1C).
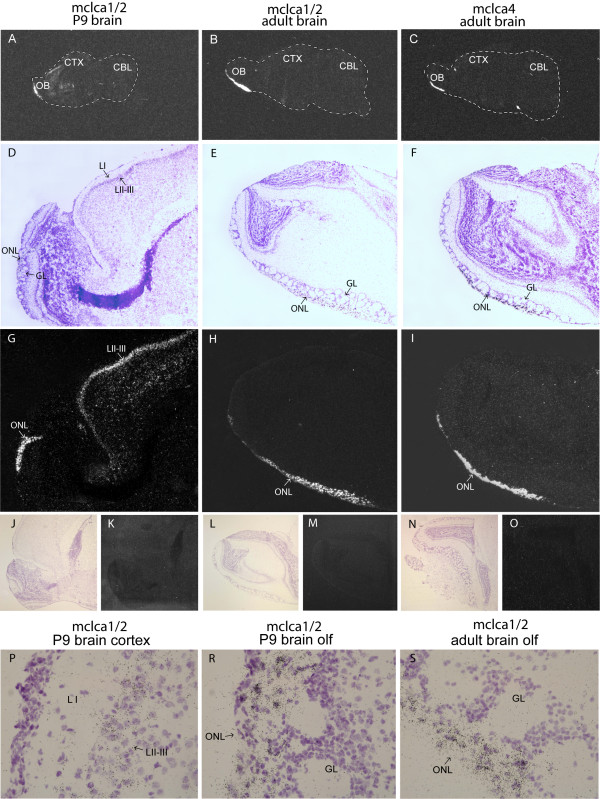
To further analyze the cellular distribution of mClca1,2 and 4 expression in brain, we performed in-situ hybridization on adult brain sections. Since mClca1 and 2 genes share 95% identity, we were unable to design probes that distinguish between these genes. Therefore, we consider the expression pattern of mClca1 and 2 together (marked mClca1/2). It should be noted however, that mClca2 was expressed at very low levels in the adult mouse brain (Fig 1A) and therefore most of the signal likely corresponds to mClca1 expression. Sense probes were used as negative controls and they did not give any signal (Fig 2, J–O). Our analysis showed that mClca1/2 and 4 genes are expressed in the olfactory nerve layer of the adult brain (Fig 2, B, C, E, F, H and 2I). High magnification imaging of mClca1/2 expression in the adult mouse brain showed expression in cells next to the glomerular layer of the olfactory bulb, namely layer of entering olfactory nerve fibers, which is populated by the olfactory ensheathing cells (Fig 2, S). We observed very low levels of mClca1/2 and mClca4 expression in hypothalamic nuclei and mClca1/2 expression in the layer II-III of the cerebral cortex (data not shown). Since mClca1 seems to be the most highly expressed CLCA family member in the mouse brain, we analyzed mClca1/2 expression also in postnatal day (P9) brain. In P9 brains the expression of mClca1/2 was more broad with the highest levels in the olfactory nerve layer of the olfactory bulb (Fig 2, A, D, G, R) and also in the layer II-III of the developing cerebral cortex containing pyramidal neurons (Fig 2.A, D, G, P). At P9 low level of mClca1/2 expression was observed in CA3 layer of hippocampus and in amygdalohippocampal area (data not shown).
Figure 2.
In situ hybridization analysis of mClca1/2 and mClca4 expression in the mouse brain. Dark-field emulsion autoradiographs of whole P9 and adult brain mid saggital sections are shown in A-C. Hematoxylin-eosin stained bright-field images (D, E and F) and corresponding dark-field emulsion autoradiographs (G, H and I) are shown at 40× magnification. Lack of in situ hybridization signal using corresponding sense probes is shown in J-O. Cellular distribution of Clca1/2 expression in P9 mouse cerebral cortex and olfactory bulb and adult mouse olfactory bulb are shown in J-L at 600× magnification. Abbreviations: CBL – cerebellum; CTX – cortex; GL – glomerular cell layer; LI – cerebral cortex layer I; LII-III – cerebral cortex layers II-III; OB – olfactory bulb; ONL – olfactory nerve layer.
Expression pattern of mouse Clca1/2 during embryonic development
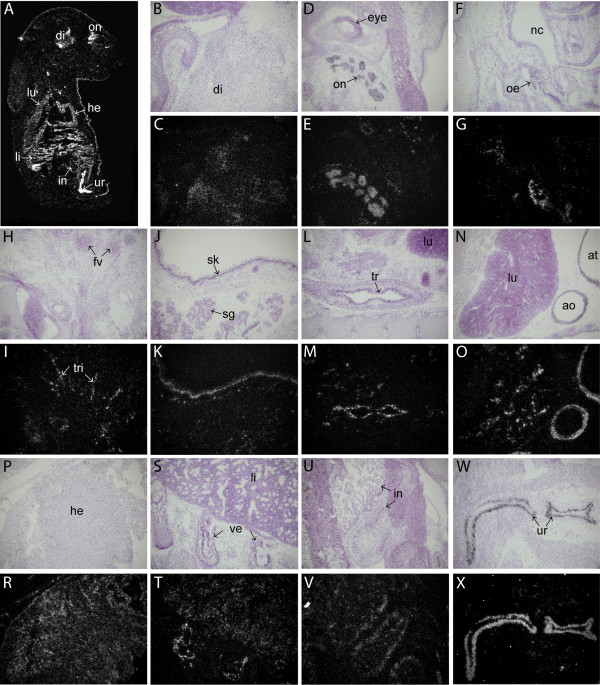
We performed in situ hybridization analysis in order to characterize mClca1/2 expression during mouse development. Our analysis showed that at embryonic day 13 (E13) mClca1/2 is expressed at high levels in the developing urethra, midgut, aorta and heart (Fig 3A). High magnification analysis showed that mClca1/2 is also expressed in cells that lie adjacent to the epithelium of the nasal cavity. Most likely this expression conforms to the developing cranial nerve I (olfactory nerve)(Fig 3B–D). Low levels of mClca1/2 expression was seen in the developing spinal nerves (Fig 3E – G). In the E13 heart mClca1/2 was expressed in ventricle and atrium as well as in aorta (Fig 3H–M). High level of mClca1/2 expression was observed in E13 midgut and urethra (Fig 3N–T).
Figure 3.
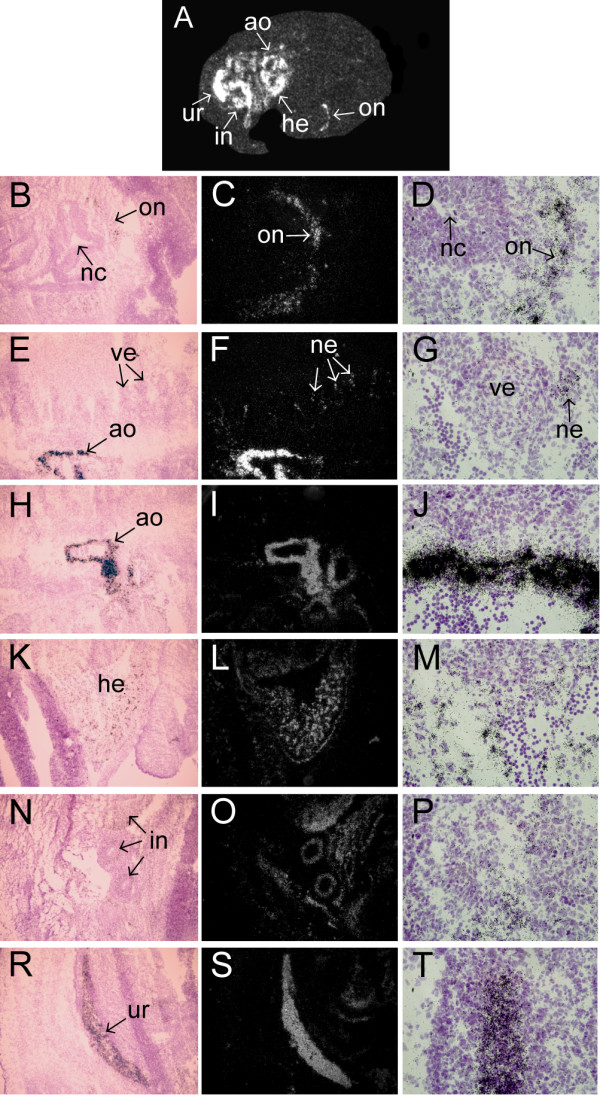
In situ hybridization analysis of mClca1/2 expression in E13 mouse embryo. Dark-field emulsion autoradiograph depicting whole embryo is shown in A. Hematoxylin-eosin stained bright-field images (B, E, H, K, N, R at 100× magnification and D, G, J, M, P, T at 600× magnification) and corresponding dark-field emulsion autoradiographs (C, F, I, L, O and S) are shown corresponding to various parts of the embryo. Abbreviations: ao-aorta; he-heart; in-intestine; on-olfactory nerve nc-nasal cavity; ne-spinal nerve; ur-urethra; ve-vertebrae.
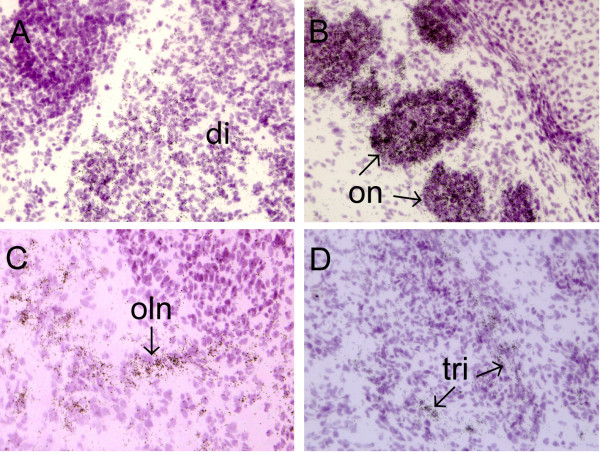
In situ hybridization analysis on E17 mouse embryos showed that high levels of mClca1/2 mRNA expression were retained in the developing urethra (Fig 4A). Expression was seen also in the brain, predominantly in the diencephalon (Fig 4B,C). Highest level of mClca1/2 expression in the nervous system was observed in optic nerve (Fig 4D,E). The expression of mClca1/2 was also detected in the olfactory nerve (Fig 4F,G) and in the trigeminal nerve (Fig 4H,I). Higher magnification images of mClca1/2 expression in the nervous system of E17 embryos are shown in Fig 5. Outside the nervous system the expression of mClca1/2 was observed in the heart (Fig 4N–R), intestine (Fig 4U,V), urethra (Fig 4W–X) and also in trachea and lung (Fig 4L–O). Lower levels were seen in liver, vertebrae (Fig 4S,T) and skin (Fig 4J,K).
Figure 4.
In situ hybridization analysis of mClca1/2 expression in E17 mouse embryo. Dark-field emulsion autoradiograph depicting whole embryo is shown in A. Hematoxylin-eosin stained bright-field images (B, D, F, H, J, L, N, P, S, U, W) and corresponding dark-field emulsion autoradiographs (C, E, G, I, K, M, O, R, T, V, X) taken at 100× magnification, corresponding to various parts of the embryo are shown. Abbreviations: di-diencephalon; fv-follicles of vibrissae; he-heart; in-intestine; li-liver; lu-lung; oe-olfactory epithelium; on-optic nerve; sg-submandibular gland; sk-skin; tr-trachea; tri-trigeminal nerve; ur-urethra; ve-vertebrae.
Figure 5.
High magnification images of mClca1/2 expression in the nervous system at E17. Images of diencephalon (A), optic nerve (B), olfactory nerve (C) and trigeminal nerve (D) are shown at 600× magnification. Abbreviations: di-diencephalon; oln-olfactory nerve; on-optic nerve; tri-trigeminal nerve.
Expression of human CLCA2 and 4 in the nervous system
Since three mouse Clca gene family members were expressed in brain, we were interested if any of the four human CLCA genes are expressed in the nervous system. As the numbering of CLCA family members in human and rodents is different, we performed bioinformatic analysis to reveal which rodent Clca genes have closest homology to which human family members. Schematic depiction of human, mouse and rat CLCA loci is shown in Fig 6A. We created a homology tree of the mouse, rat and human proteins using DNAMAN software (Fig 6B). Bioinformatic analysis revealed that the order of genes within the rodent and human locus was similar e.g. hCLCA2, which is the most 5' of the human genes has the highest homology with mClca5 and rClca2 (predicted gene), which also lie in the most 5' part of the mouse and rat locus respectively (Fig 6A). Our analysis also showed that the 3' part of the locus has undergone duplication in rat (rbClca and rbClca2 genes) and triplication in mouse (mClca1, 2 and 4 genes), whereas there is a single 3' gene (CLCA3) in the human locus (Fig 6).
Figure 6.
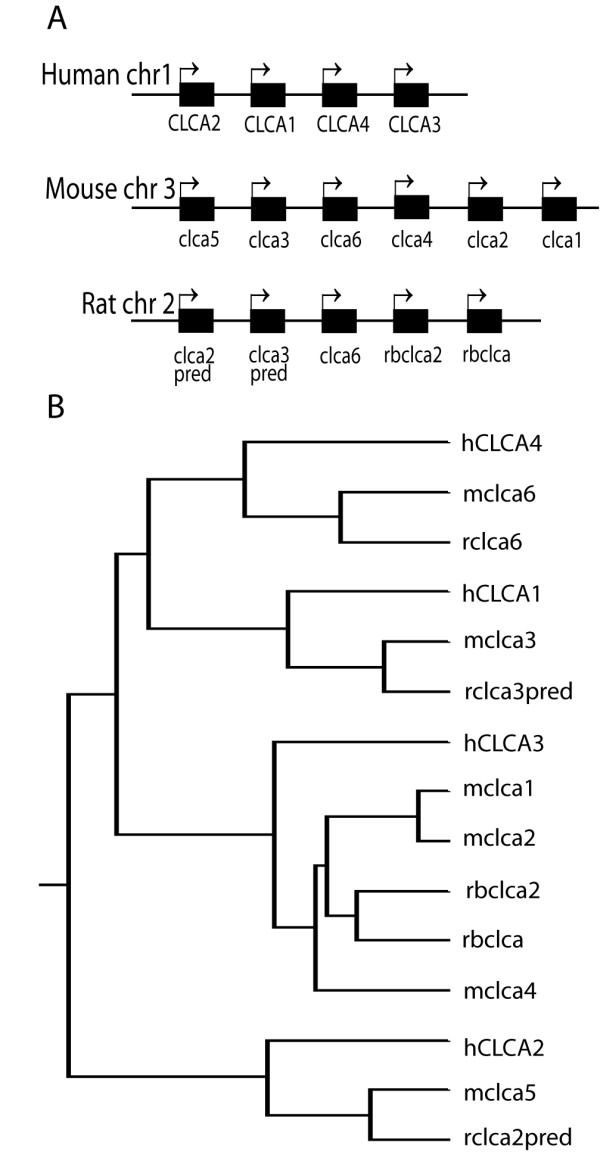
Structure of human, mouse and rat CLCA locus and homology between CLCA family members. Schematic depiction of order of succession of genes within human, mouse and rat CLCA locus is shown in A (the figure is not drawn in scale). Homology tree showing relationship between human, mouse and rat CLCA proteins (B). The dendrogram was generated using DNAMAN software (Lynnon Biosoft) with complete amino acid sequences of the CLCA proteins.
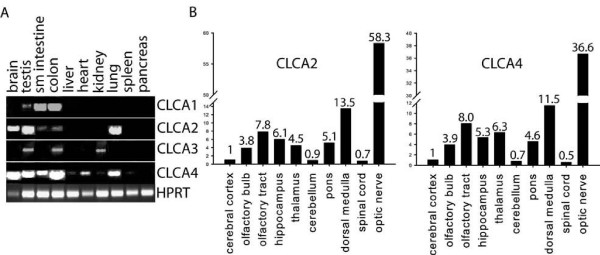
Our bioinformatic analysis showed that human CLCA3 is the closest homologue of mouse Clca1, 2 and 4 genes (Fig 6B). It shares 74% homology at the protein level with its mouse counterparts. RT-PCR analysis revealed that neither hCLCA3 nor hCLCA1 was expressed in the nervous system. In contrast, hCLCA2 and hCLCA4 were expressed in the brain (Fig 7A). Expression of hCLCA1 was largely confined to the gastrointestinal tract, with high level of expression in the small intestine. Low level of hCLCA1 expression was detected in testis. hCLCA2 was expressed at high levels in the brain, testis and lung and at low levels in the small intestine and colon. hCLCA3 was expressed in testis, kidney and colon. hCLCA4 was expressed widely in human tissues. High levels of hCLCA4 were expressed in the brain, testis, small intestine, colon and lung. Lower levels of expression were detected in heart (Fig 7A).
Figure 7.
A) Semiquantitative RT-PCR analysis of human CLCA1-4 mRNA expression and control mRNA hprt in adult human tissues. B) Real-time PCR analysis of CLCA2 and CLCA4 expression in adult human brain regions. Expression levels are shown relative to the expression level in the cerebral cortex.
hCLCA2 and 4 were differentially expressed in the adult brain as revealed by quantitative RT-PCR analysis (Fig 7B). The highest level of hCLCA2 and hCLCA4 expression was found in optic nerve. The expression level of hCLCA2 and hCLCA4 in optic nerve exceeded 58 and 35 times the expression level of the corresponding gene in cerebral cortex. The expression of hCLCA2 and hCLCA4 was also significantly higher in medulla and olfactory tract as compared to the expression level in cerebral cortex. Very low levels of hCLCA2 and hCLCA4 expression were found in cerebral cortex, cerebellum and spinal cord (Fig 7B).
Discussion
In this study we show novel expression sites for mouse Clca1, Clca2 and Clca4 genes. All six mouse Clca genes are located in chromosome 3 and are clustered in the same locus. Our RT-PCR and in situ hybridization analyses reveal that in the murine nervous system, mClca1, 2 and 4 genes are preferentially expressed in the olfactory ensheathing cells. In contrast to our findings, it has been previously shown that mClca2 is not expressed in the mouse brain [13]. Our analysis reveals that mClca2 is expressed in mouse brain, albeit at very low levels. The discrepancy between the results may come from the observation that at least in the gastrointestinal tract, there are marked differences in the expression level of mouse Clca genes between different mouse strains [18]. Also, it has recently been shown that mClca2 is expressed in the cerebral cortex, albeit at very low levels as compared to mClca1 [19]. The same study also detected low levels of mClca5 expression in the dorsal root ganglia of adult mouse.
mClca 1, 2 and 4 genes share highest similarity with each other within the gene family. At amino acid level mClca1 and 2 share 95% identity and mClca4 shares 81% identity with mClca2 and 80% identity with mClca1. Moreover, these three genes lie next to each other and form a 3' gene cluster in the Clca gene locus. Given their similar expression pattern in the nervous system, it could be argued that either their olfactory ensheathing cell specific expression is driven by a common regulatory element or each of these mouse genes has retained an olfactory ensheathing cell specific promoter element following gene duplication. Other reports have shown that the rat Clca genes most homologous to mouse Clca1,2 and 4, i.e. rbClca and rbClca2 are expressed in rat brain [20,21]. Their analysis revealed that both genes are expressed at comparable levels in the cerebellum, cerebrum and spinal cord. Also, they showed by single cell PCR analysis that rbClca is expressed in both neurons and glial cells. It would be interesting to analyze the expression level of rbClca and rbClca2 in the olfactory bulb of rat.
Our analysis of mClca1/2 expression in the nervous system at early postnatal development revealed that it is expressed also in the layer II-III of the cerebral cortex. Interestingly the expression was seen only in the frontal part of the developing cortex. At E17 mClca1/2 expression was more widespread in the brain, with prominent expression in diencephalon. During embryonic development mClca1/2 expression was seen in the developing nerves of the peripheral nervous system. We could detect expression at E13 in the developing olfactory nerve and spinal nerves and at E17 in the optic nerve, trigeminal nerve and olfactory nerve. It is possible that mClca1/2 expression marks the glial cells ensheathing peripheral nerves.
In this study we have also analyzed the expression of human CLCA genes in the nervous system. Human CLCA locus contains 4 genes. The most 3' of the genes is hCLCA3, which is also most closely related to mClca1, 2 and 4. RT-PCR analysis showed that unlike its mouse homologues, hCLCA3 is not expressed in the nervous system. In contrast, our results show that two other members of the family, hCLCA 2 and 4 are expressed in various parts of human brain. It has previously been shown, using RNA dot-blot analysis, that hCLCA4 is expressed rather uniformly in the brain with striking absence in the cerebellum [22]. However, RT-PCR analysis performed in this study showed low level of CLCA4 expression in cerebellum. Unlike mouse Clca genes expressed in the nervous system, human CLCA 2 and 4 expression is not confined to olfactory ensheathing cells. It should be noted however, that both genes were expressed at higher levels in the olfactory nerve as compared to olfactory bulb. Highest expression for both genes was found in the optic nerve. Together with the data from the analysis of mouse mClca1/2 expression, it could be suggested that CLCA genes could be expressed at higher levels in the cells that ensheath cranial nerves.
Conclusion
In this study we have shown that mClca1, mClca2 and mClca4 are expressed in the olfactory ensheathing cells of the adult mouse CNS. During mouse development mClca1/2 widely expressed in the CNS but at particularly high levels in cranial nerves. In addition, we found that mClca1/2 is expressed in layer II of the developing cerebral cortex at P9. Our analysis also reveals that hCLCA2 and hCLCA4 are expressed in the CNS of adult humans.
Authors' contributions
TT and DM contributed to the design of the experiments and to the preparation of the manuscript. MP performed the experiments and contributed to the design of the experiments and to the preparation of the manuscript.
Acknowledgments
Acknowledgements
We thank Enn Jõeste and Liina Kiho from North Estonian Regional Hospital, Tallinn, for help in collecting tissue samples and Epp Väli for technical assistance. This work was supported by Estonian Ministry of Education and Research (Grants 0222602 and 0140143) and Estonian Science Foundation (Grant 7257).
Contributor Information
Marko Piirsoo, Email: marko.piirsoo@ttu.ee.
Dies Meijer, Email: d.meijer@erasmusmc.nl.
Tõnis Timmusk, Email: tonis.timmusk@ttu.ee.
References
- Hartzell C, Putzier I, Arreola J. Calcium-activated chloride channels. Annu Rev Physiol. 2005;67:719–58. doi: 10.1146/annurev.physiol.67.032003.154341. [DOI] [PubMed] [Google Scholar]
- Pauli BU, Abdel-Ghany M, Cheng HC, Gruber AD, Archibald HA, Elble RC. Molecular characteristics and functional diversity of CLCA family members. Clin Exp Pharmacol Physiol. 2000;27:901–5. doi: 10.1046/j.1440-1681.2000.03358.x. [DOI] [PubMed] [Google Scholar]
- Papassotiriou J, Eggermont J, Droogmans G, Nilius B. Ca(2+)-activated Cl- channels in Ehrlich ascites tumor cells are distinct from mClca1, 2 and 3. Pflugers Arch. 2001;442:273–9. doi: 10.1007/s004240100526. [DOI] [PubMed] [Google Scholar]
- Gruber AD, Pauli BU. Molecular cloning and biochemical characterization of a truncated, secreted member of the human family of Ca2+-activated Cl- channels. Biochim Biophys Acta. 1999;1444:418–23. doi: 10.1016/s0167-4781(99)00008-1. [DOI] [PubMed] [Google Scholar]
- Gibson A, Lewis AP, Affleck K, Aitken AJ, Meldrum E, Thompson N. hCLCA1 and mClca3 are secreted non-integral membrane proteins and therefore are not ion channels. J Biol Chem. 2005;280:27205–12. doi: 10.1074/jbc.M504654200. Epub 2005 May 25. [DOI] [PubMed] [Google Scholar]
- Pawłowski K, Lepistö M, Meinander N, Sivars U, Varga M, Wieslander E. Novel conserved hydrolase domain in the CLCA family of alleged calcium-activated chloride channels. Proteins. 2006;63:424–39. doi: 10.1002/prot.20887. [DOI] [PubMed] [Google Scholar]
- Abdel-Ghany M, Cheng HC, Elble RC, Pauli BU. The breast cancer beta 4 integrin and endothelial human CLCA2 mediate lung metastasis. J Biol Chem. 2001;276:25438–46. doi: 10.1074/jbc.M100478200. [DOI] [PubMed] [Google Scholar]
- Abdel-Ghany M, Cheng HC, Elble RC, Lin H, DiBiasio J, Pauli BU. The interacting binding domains of the beta(4) integrin and calcium-activated chloride channels (CLCAs) in metastasis. J Biol Chem. 2003;278:49406–16. doi: 10.1074/jbc.M309086200. [DOI] [PubMed] [Google Scholar]
- Elble RC, Pauli BU. Tumor suppression by a proapoptotic calcium-activated chloride channel in mammary epithelium. J Biol Chem. 2001;276:40510–7. doi: 10.1074/jbc.M104821200. [DOI] [PubMed] [Google Scholar]
- Nakanishi A, Morita S, Iwashita H, Sagiya Y, Ashida Y, Shirafuji H, Fujisawa Y, Nishimura O, Fujino M. Role of gob-5 in mucus overproduction and airway hyperresponsiveness in asthma. Proc Natl Acad Sci USA. 2001;98:5175–80. doi: 10.1073/pnas.081510898. [DOI] [PMC free article] [PubMed] [Google Scholar]
- Kamada F, Suzuki Y, Shao C, Tamari M, Hasegawa K, Hirota T, Shimizu M, Takahashi N, Mao XQ, Doi S. Association of the hCLCA1 gene with childhood and adult asthma. Genes Immun. 2004;5:540–7. doi: 10.1038/sj.gene.6364124. [DOI] [PubMed] [Google Scholar]
- Ritzka M, Stanke F, Jansen S, Gruber AD, Pusch L, Woelfl S, Veeze HJ, Halley DJ, Tümmler B. The CLCA gene locus as a modulator of the gastrointestinal basic defect in cystic fibrosis. Hum Genet. 2004;115:483–91. doi: 10.1007/s00439-004-1190-y. [DOI] [PubMed] [Google Scholar]
- Leverkoehne I, Horstmeier BA, von Samson-Himmelstjerna G, Scholte BJ, Gruber AD. Real-time RT-PCR quantitation of mClca1 and mClca2 reveals differentially regulated expression in pre- and postnatal murine tissues. Histochem Cell Biol. 2002;118:11–7. doi: 10.1007/s00418-002-0420-4. [DOI] [PubMed] [Google Scholar]
- Leverkoehne I, Gruber AD. The murine mClca3 (alias gob-5) protein is located in the mucin granule membranes of intestinal, respiratory, and uterine goblet cells. J Histochem Cytochem. 2002;50:829–38. doi: 10.1177/002215540205000609. [DOI] [PubMed] [Google Scholar]
- Elble RC, Ji G, Nehrke K, DeBiasio J, Kingsley PD, Kotlikoff MI, Pauli BU. Molecular and functional characterization of a murine calcium-activated chloride channel expressed in smooth muscle. J Biol Chem. 2002;277:18586–91. doi: 10.1074/jbc.M200829200. [DOI] [PubMed] [Google Scholar]
- Evans SR, Thoreson WB, Beck CL. Molecular and functional analyses of two new calcium-activated chloride channel family members from mouse eye and intestine. J Biol Chem. 2004;279:41792–800. doi: 10.1074/jbc.M408354200. [DOI] [PMC free article] [PubMed] [Google Scholar]
- Laurén J, Airaksinen MS, Saarma M, Timmusk T. A novel gene family encoding leucine-rich repeat transmembrane proteins differentially expressed in the nervous system. Genomics. 2003;81:411–21. doi: 10.1016/S0888-7543(03)00030-2. [DOI] [PubMed] [Google Scholar]
- Leverkoehne I, Holle H, Anton F, Gruber AD. Differential expression of calcium-activated chloride channels (CLCA) gene family members in the small intestine of cystic fibrosis mouse models. Histochem Cell Biol. 2006;126:239–50. doi: 10.1007/s00418-006-0164-7. [DOI] [PubMed] [Google Scholar]
- Al-Jumaily M, Kozlenkov A, Mechaly I, Fichard A, Matha V, Scamps F, Valmier J, Carroll P. Expression of three distinct families of calcium-activated chloride channel genes in the mouse dorsal root ganglion. Neurosci Bull. 2007;23:293–9. doi: 10.1007/s12264-007-0044-8. [DOI] [PMC free article] [PubMed] [Google Scholar]
- Jeong SM, Park HK, Yoon IS, Lee JH, Kim JH, Jang CG, Lee CJ, Nah SY. Cloning and expression of Ca2+-activated chloride channel from rat brain. Biochem Biophys Res Commun. 2005;334:569–76. doi: 10.1016/j.bbrc.2005.06.122. [DOI] [PubMed] [Google Scholar]
- Yoon IS, Jeong SM, Lee SN, Lee JH, Kim JH, Pyo MK, Lee JH, Lee BH, Choi SH, Rhim H, Choe H, Nah SY. Cloning and heterologous expression of a Ca2+-activated chloride channel isoform from rat brain. Biol Pharm Bull. 2006;29:2168–73. doi: 10.1248/bpb.29.2168. [DOI] [PubMed] [Google Scholar]
- Agnel M, Vermat T, Culouscou JM. Identification of three novel members of the calcium-dependent chloride channel (CaCC) family predominantly expressed in the digestive tract and trachea. FEBS Lett. 1999;455:295–301. doi: 10.1016/S0014-5793(99)00891-1. [DOI] [PubMed] [Google Scholar]


