

Abstract
Animal studies suggest that increased levels of circulating angiotensin II (AngII) could contribute to the loss of lean body mass in chronic kidney disease, but the mechanism by which this occurs is unclear. Here, AngII infusion increased circulating IL-6 and its hepatic production in wild-type mice, suggesting that AngII-induced inflammation may trigger muscle loss. AngII infusion also stimulated the suppressor of cytokine signaling (SOCS3) in muscle, which led to loss of insulin receptor substrate 1 (IRS-1), thereby impairing insulin/IGF-1 signaling and enhancing protein degradation. All of these responses to AngII were suppressed in IL-6–deficient mice. Recombinant human IL-6 (rhIL-6) treatment of cultured myotubes only minimally increased SOCS3, however, suggesting the contribution of other mediators. Because AngII increases hepatic serum amyloid A (SAA) expression in an IL-6–dependent manner, we treated wild-type mice with rhIL-6 and an SAA1-overexpressing adenovirus; the combination led to a significantly greater increase in SOCS3 and decrease in IRS-1 compared with either rhIL-6 or SAA1 alone. We observed similar effects on SOCS3 and IRS-1 when we treated cultured muscle myotubes with rhIL-6 and SAA1. Taken together, these results suggest an interorgan response to high levels of AngII: Hepatic production of IL-6 and SAA increases, and these mediators act synergistically to impair insulin/IGF-1 signaling, which promotes muscle proteolysis. Targeting the high levels of IL-6 and SAA in catabolic disorders might be a therapeutic approach to prevent muscle wasting.
Increased circulating angiotensin II (AngII) occurs in several conditions that are characterized by muscle wasting (e.g., chronic kidney disease [CKD], congestive heart failure [CHF]).1,2 Experimentally, long-term AngII infusion into mice stimulates muscle protein wasting by activating two proteolytic mechanisms: Caspase-3 and the ubiquitin-proteasome system (UPS).3 Identifying mechanisms linking AngII with muscle wasting is of interest because blocking AngII in patients with CHF can ameliorate their loss of muscle mass.2
The mechanisms underlying AngII-induced loss of lean body mass could involve a direct effect of AngII on muscle, but there is evidence that AngII type 1 receptors (AT1) are not expressed in skeletal muscle.4 Alternatively, AngII could trigger muscle protein losses indirectly, possibly through inflammatory mechanisms, because AngII stimulates inflammation.5 There is abundant evidence that CKD and cardiovascular diseases are complicated by inflammation,2,6 and inflammation has been associated with activation of E3 ubiquitin ligase MuRF1 in muscle and, therefore, could stimulate protein degradation in the UPS.7 Inflammation also causes insulin resistance: In one mechanism, TNF-α or fatty acids stimulate phosphorylation of IRS-1ser307, leading to suppression of insulin/IGF-1 signaling.8–10 This is relevant because impaired insulin/IGF-1 signaling is closely linked to activation of muscle protein degradation.3,11,12 Indeed, overexpression of IGF-1 in muscle prevents AngII-induced muscle wasting.3 Additional evidence for impaired insulin/IGF-1 signaling is that glucocorticoids exert a permissive effect in mediating muscle proteolysis in conditions associated with impaired insulin/IGF-1 signaling, such as acidosis, insulin deficiency/resistance, starvation, and sepsis.3,12–16 Moreover, administration of a steroid receptor antagonist substantially reduces muscle wasting in AngII-infused mice. Because impaired insulin/IGF-1 signaling occurs in inflammation and several conditions causing muscle catabolism, identifying how AngII impairs insulin/IGF-1 signaling could uncover mechanisms in catabolic conditions.
In examining whether inflammation contributes to AngII-induced muscle wasting, we found that AngII infusion raises circulating IL-6. The increase in IL-6 is essential for AngII-induced muscle wasting, and it interacts synergistically with serum amyloid A (SAA) to increase muscle suppressor of cytokine signaling (SOCS3) expression, leading to reduced IRS-1 levels in muscle. These results uncover a new role for an acute-phase reactant protein.
RESULTS
Skeletal Muscle and Muscle-Derived Cells Do not Express AngII Receptors
To seek functional AngII receptors, we examined AngII receptor expression in C2C12 cells derived from mice, L6 cells from rats, and mouse skeletal muscle. In C2C12 myotubes, treatment with 1 μM AngII did not cause an intracellular calcium spike or phosphorylation of extracellular signal–regulated kinase (ERK; a downstream target of AngII), but in C2C12 infected with an adenovirus encoding AT1,17 AngII stimulated a calcium spike and ERK phosphorylation (Supplemental Figure 1). In L6 cells, we found no expression of AT2, AT1A, or AT1B receptors by ribonuclease protection assay18,19 (Figure 1A). By real-time PCR (RT-PCR), we found no detectable AT1 receptor mRNA in C2C12 cells, a small amount in gastrocnemius muscle (possibly due to vessels within the muscle) and abundant AT1 receptor mRNA in mouse vein (Figure 1B). These results are consistent with immunostaining results which revealed AT1 receptors in blood vessels of muscle but not in muscle itself.4
Figure 1.
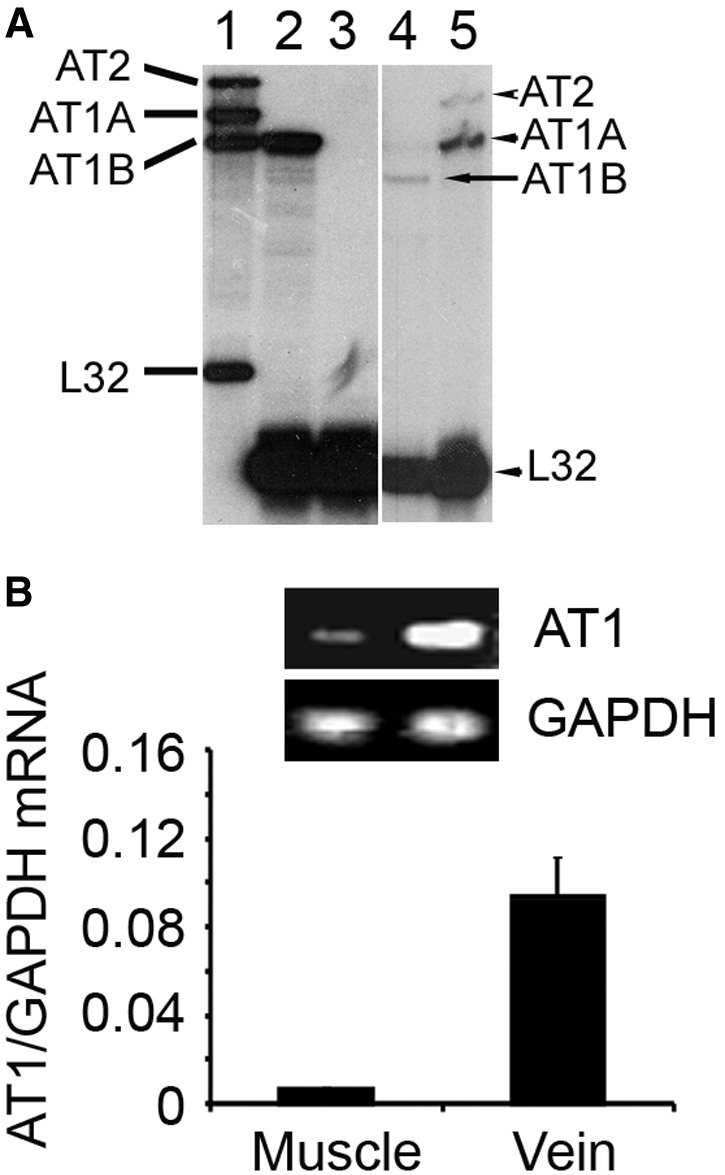
Skeletal muscle and cells derived from it do not express AngII receptors. (A) AngII receptors analyzed by ribonuclease protection assay (lane 1, probes for AT2, AT1A, and AT1B; lane 2, rat aorta smooth muscle cells as a positive control for AT1B; lane 3, L6 cells; lane 4, positive control for AT1B; lane 5, positive control for AT2 [upper band] and AT1A [lower band]). The rat ribosomal L-32 gene was used as the housekeeping gene; probes containing polylinker regions are longer than the protected bands. (B) AngII receptors in mouse muscle, mouse vein, or C2C12 cells analyzed by RT-PCR.
AngII Induces IL-6 Expression in Mice
The absence of AngII receptors indicates that it acts through mediators to cause muscle wasting. Because AngII can cause inflammation,5 we measured inflammatory mediators induced by AngII. Male pair-fed, wild-type (WT), C57/BL6 mice were infused with PBS or AngII. One week later, we found increased plasma levels of chemokines and cytokines in AngII-infused mice; the largest increase was IL-6 (Table 1). There was an associated 10-fold increase in IL-6 mRNA in liver plus much smaller increases in kidney and muscle (Supplemental Figure 2).
Table 1.
Changes in plasma cytokines induced by AngIIa
| Cytokine or Chemokine | PBS Infusion (pg/ml) | AngII Infusion (pg/ml) | Fold Change (AngII versus PBS) | P |
|---|---|---|---|---|
| KC | 38.59 ± 6.25 | 76.50 ± 0.83 | 1.98 | 0.037 |
| RANTES | 7.19 ± 0.08 | 8.33 ± 0.33 | 1.16 | 0.019 |
| IL-1β | 6.75 ± 1.35 | 7.13 ± 1.01 | 1.06 | 0.126 |
| IL-1α | 11.38 ± 3.03 | 17.73 ± 0.57 | 1.56 | 0.054 |
| IL-6 | 3.27 ± 2.12 | 17.60 ± 0.87 | 5.38 | 0.005 |
| IL-10 | 35.52 ± 5.93 | 1.00 ± 0.05 | 0.03 | 0.003 |
| IL-12p(70) | 52.42 ± 13.78 | 13.96 ± 11.00 | 0.27 | 0.024 |
| TNF-α | 4.48 ± 0.78 | 6.02 ± 1.50 | 1.34 | 0.053 |
| IFN-γ | 32.78 ± 2.50 | 43.92 ± 1.40 | 1.34 | 0.052 |
Circulating concentrations of cytokines and chemokines were measured in plasma samples from mice infused with PBS or AngII for 7 d (n = 4 mice in each group).
AngII-Induced Muscle Wasting Depends on IL-6
To examine whether IL-6 plays a role in AngII-induced muscle wasting, we compared IL-6 knockout (KO) and WT mice infused with AngII or PBS. After 7 d of AngII infusion, the weights of mixed-fiber gastrocnemius and tibialis anterior (TA) muscles and the red fiber, soleus muscles of WT mice were significantly reduced. The AngII-induced loss of muscle mass was significantly blocked in IL-6 KO mice (Table 2). Likewise, the frequency distribution of cross-sectional areas (CSA) of fibers in TA muscles of WT mice infused with AngII was shifted toward smaller sizes compared with results of PBS infusion (Figure 2, A and C). Again, the shift in CSAs as a result of AngII was blocked in TA muscles from IL-6 KO mice (Figure 2, B and D). The mean CSA in TA muscles of AngII-infused WT mice was lower than that in PBS-infused WT mice. This difference was not present in AngII-infused IL-6 KO mice (Figure 2E).
Table 2.
Skeletal muscle and body weights of WT and IL-6 KO infused with AngII or PBSa
| Parameter | Gastrocnemius (mg) | Soleus (mg) | TA (mg) | Body Weight (g) |
|---|---|---|---|---|
| WT | ||||
| PBS | 131.30 ± 2.87 | 10.60 ± 0.59 | 53.18 ± 2.28 | 23.50 ± 0.39 |
| AngII | 116.40 ± 3.61b | 8.60 ± 0.12b | 46.40 ± 1.54b | 21.90 ± 0.44 |
| IL-6 KO, | ||||
| PBS | 128.60 ± 6.50 | 10.90 ± 1.20 | 51.60 ± 1.47 | 23.80 ± 0.59 |
| AngII | 123.70 ± 3.97 | 10.10 ± 1.11 | 50.10 ± 1.75 | 22.20 ± 0.69 |
Data are means ± SEM; n = 12 mice in each group.
P < 0.05, AngII versus PBS infused.
Figure 2.

The muscle atrophy induced by AngII infusion is significantly suppressed in IL-6 KO mice. PBS-infused mice were pairfed with AngII-infused mice, and the experiments were repeated five times with three animals in each group. (A) TA muscles of WT mice were stained for laminin after 7 d of PBS or AngII infusion. (B) TA muscles of IL-6 KO mice were also stained for laminin. (C) Frequency distribution of fiber sizes (CSA) in TA muscles of AngII- or PBS-infused WT mice. (D) Frequency distribution of CSA in fibers of TA muscles from AngII- or PBS-infused IL-6 KO mice. (E) Mean ± SEM of CSA in TA fibers from each group of mice (*P < 0.05 for AngII-infused versus PBS-infused WT mice).
We also examined whether AngII affects fiber types I, IIA, or IIB, using immunostaining of TA muscles from three mice of each group. AngII infusion shifted the CSA frequency distribution toward smaller size in type IIB fibers, and the mean CSA of type IIB fibers was smaller compared with results from PBS-infused WT mice. This difference was not observed in type I or IIA fibers or in TA muscles from IL-6 KO mice (Supplemental Figure 3). Thus, type IIB fibers may be more susceptible to AngII-induced proteolysis.
Proteolytic Pathways Activated by AngII Infusion Depend on IL-6
To assess how AngII causes muscle wasting, we examined evidence for caspase-3 and the UPS proteolytic activities. The 14-kD actin fragment “footprint” of caspase-3 activity3,11,12,20–22 was increased by AngII (Figure 3A). Immunohistochemistry with an antibody recognizing active caspase-3 confirmed the increase in caspase-3 activity induced by AngII11 (Figure 3, C and D). There also was an increase in the mRNAs for the E3 ubiquitin ligases Atrogin-1/MAFbx and MuRF-1, consistent with activation of UPS proteolysis23–25 (Figure 3B). Notably, these responses to AngII infusion were significantly suppressed in muscle of IL-6 KO mice.
Figure 3.

Loss of IL-6 prevents AngII-induced activation of proteolytic pathways in muscle. (A) Representative blots of the 14-kD actin fragment resulting from caspase-3 action in gastrocnemius muscle.20 AngII increased the 14-kD fragment in muscle of WT mice but not IL-6 KO mice. (B) Similar results occurred with RT-PCR measurements of the mRNAs (corrected for GAPDH mRNA) of E3 ubiquitin-conjugating enzymes Atrogin-1/MAFbx and MuRF1. AngII increased Atrogin-1/MuRF1 in muscle of WT but not IL-6 KO mice. (C) Active caspase-3 in TA muscle was detected by immunostaining (green color; nuclei, blue color). (D) The percentage of cells staining positively for activated caspase-3 was calculated by counting the number of cells with activated caspase-3 present in 500 fibers (n = 5 mice in each group).
Decreased Muscle Levels of IRS-1 and Phosphorylated Akt Induced by AngII Depend on IL-6
Defective insulin/IGF-1 signaling stimulates muscle protein degradation by caspase-3 and the UPS.11,12,20 To determine whether similar events contribute to AngII-induced muscle wasting, we measured IRS-1 and phosphorylated Akt (p-Akt) in muscle. AngII significantly reduced IRS-1 and p-Akt in muscle of WT mice. Both responses were blocked in AngII-infused IL-6 KO mice (Figure 4).
Figure 4.

IL-6 KO prevents the reduction in IRS-1 and Akt phosphorylation which is induced by AngII infusion. (A) The levels of IRS-1 and p-Akt in gastrocnemius muscles of WT and IL-6 KO mice after 7 d of PBS or AngII infusion were detected by Western blot. (B) Differences in the densities of IRS-1 (corrected for β-actin; left), p-Akt (corrected for total Akt; right) from A are shown. Values from mice infused with AngII minus value in PBS-infused mice were calculated from five mice in each group.
AngII-Induced SOCS3 Expression in Muscle Depends on IL-6
To understand how AngII downregulates IRS-1, we examined SOCS3, which is stimulated by cytokines or growth factors and can increase IRS-1 degradation by the UPS.26 In AngII-infused WT mice, SOCS3 mRNA and protein levels in muscle were sharply increased (Figure 5). In contrast, SOCS3 mRNA and protein in muscle of AngII-infused, IL-6 KO mice did not significantly change.
Figure 5.
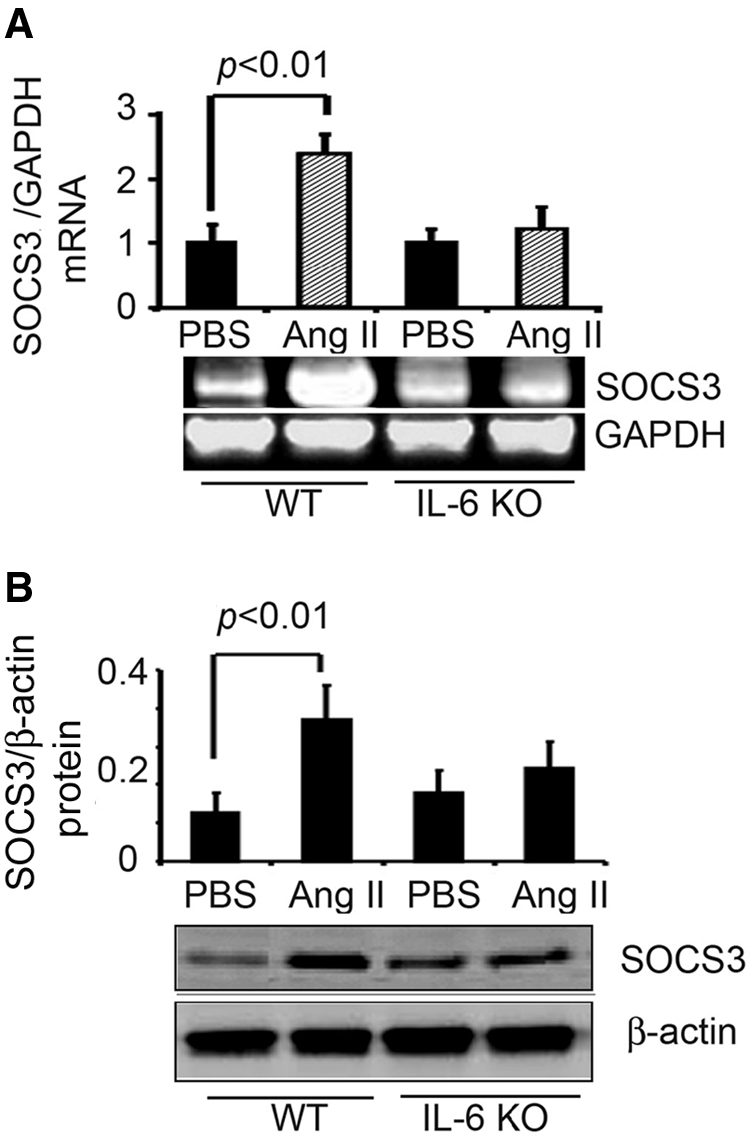
AngII infusion stimulates IL-6–dependent expression of SOCS3 in muscle. (A) SOCS3 mRNA in gastrocnemius muscles of AngII- or PBS-infused mice was detected by RT-PCR (corrected for GAPDH mRNA). (B) SOCS3 protein in gastrocnemius muscles of AngII- or PBS-infused mice was detected by Western blot (corrected for β-actin). In each figure, a representative blot is shown in the bottom panel with quantitative results in the top panel. Results from five mice in each group were quantified. The significant increase in SOCS3 induced by AngII was not present in IL-6 KO mice.
IL-6 and SAA Act Synergistically to Increase SOCS3 Expression and Decrease IRS-1 Levels
Because IL-6 does not increase protein degradation in isolated muscles,27 we examined other AngII-induced circulating factors. There was a sharp increase in circulating SAA, an acute-phase protein, and this increase was eliminated in AngII-infused, IL-6 KO mice (Supplemental Figure 4A). Again, the liver was the major source of SAA, although there was some SAA1 mRNA expression in muscle and kidney (Supplemental Figure 4B).
To assess whether SAA1 and IL-6 change muscle metabolism synergistically in vivo, we injected tail veins of WT mice with adenoviruses that overexpress either SAA1 or green fluorescence protein.28 Overexpression of SAA1 alone increased SOCS3 mRNA or protein by 51.5 and 36.5%, respectively, whereas rhIL-6 injection increased SOCS3 mRNA and protein by 56.7 and 38.7%, respectively (Figure 6, A and B). When SAA1 overexpression and rhIL-6 injection were combined, SOCS3 mRNA and protein increased 150 and 80.3%, respectively. The latter responses were accompanied by a reciprocal and significant decrease in muscle IRS-1 and p-Akt.
Figure 6.

Mice treated to overexpress SAA1 and infused with rhIL-6 exhibit increased SOCS3 expression and decreased IRS-1 in gastrocnemius muscles. (A) Levels of p-STAT3, p-IRS-1ser307, p-Akt, SOCS3, and IRS-1 in gastrocnemius muscles of mice injected with a recombinant adenovirus expressing SAA1 and/or injected with recombinant IL-6 were detected by Western blot (corrected for GAPDH). (Left) Representative blot and the right panel is a quantification of band densities. (B) SOCS3 mRNA in gastrocnemius muscles of mice described for A were detected by RT-PCR (corrected for GAPDH). Nine mice in each group were studied.
Interpreting results of injecting rhIL-6 and/or the SAA1 adenovirus is complicated because green fluorescence protein or SAA adenoviruses caused an increase in circulating IL-6, whereas rhIL-6 injection raised circulating SAA (Supplemental Figure 5, A and B). For this reason, we studied C2C12 myotubes: Treatment with a high concentration of rhIL-6 produced a minimal decrease in IRS-1 (9.4%) and no detectable change in p-IRS-1ser307 (Figure 7A). Treatment with SAA1 alone yielded similar results; however, treatment of C2C12 myotubes with rhIL-6 + SAA1 reduced IRS-1 60% (P < 0.01). This decrease was accompanied by increases in SOCS3 mRNA (150%) and protein (seven-fold; Figure 7, B and C). Individually, rhIL-6 or SAA1 increased SOCS3 mRNA by approximately 45% (Figure 7C). These responses provide a mechanism for the decrease in IRS-1 because SOCS3 binds to IRS-1 and promotes its degradation by the UPS.26
Figure 7.

In C2C12 muscle cells, SAA1 enhances the rhIL-6–induced increase in SOCS3 expression while reducing IRS-1. (A) C2C12 myotubes were treated with rhIL-6, SAA1, or rhIL-6 + SAA1 for 16 h, and IRS-1 was measured by Western blotting (corrected by β-actin). In addition, p-IRS-1ser307 was measured after 30 min of treatment. (B) C2C12 myotubes were treated with SAA1 and/or rhIL-6 for the indicated times, and p-STAT3 and SOCS3 were measured. (C) SOCS3 mRNA expression was analyzed by RT-PCR (corrected for GAPDH). The experiments were repeated three times, and, in each case, the combination of SAA1 and rhIL-6 resulted in the greatest changes in IRS-1, SOCS3 (protein and mRNA), and p-IRS-1ser307.
We also evaluated STAT3, an IL-6–activated transcription factor that stimulates SOCS3 expression.29 Treatment with rhIL-6 alone led to STAT3 phosphorylation, but the addition of SAA1 and rhIL-6 led to a stronger (P < 0.05) STAT3 phosphorylation and a major increase in SOCS3 expression. Notably, the increase in p-STAT3 preceded SOCS3 expression (Figure 7B). We also found that the combination increased p-IRS-1ser307 two-fold (P < 0.05), providing another mechanism for IRS-1 degradation.11 A decrease in muscle IRS-1 could suppress insulin/IGF-1 signaling, triggering protein degradation.11,12
To confirm stimulation of proteolysis by IL-6 and SAA1, we studied L6 myotubes. Treatment with high concentrations of either SAA1 or rhIL-6 did not significantly change the rate of protein degradation; the myotube size; the level of the 14-kD actin fragment; or mRNA levels of Atrogin-1, MuRF1, or ubiquitin. In contrast, treatment with rhIL-6 + SAA1 increased protein degradation, the 14-kD actin fragment, and the mRNAs of Atrogin-1 and ubiquitin but not MuRF1; myotube size was reduced (Supplemental Figure 6).
DISCUSSION
Several complications of CKD, including CHF, hypertension, and progression of renal insufficiency, as well as loss of lean body mass are linked to increased AngII.3,30,31 To identify how AngII affects muscle protein metabolism, we initially sought to determine whether functional AngII receptors are present in muscle or muscle cells4 (Figure 1). The absence of AT1 receptors indicates that AngII works through other factors to cause muscle wasting. In AngII-infused normal mice, we found high circulating levels of IL-6 and SAA; their major source was the liver, indicating contributions of other organs to muscle wasting (Supplemental Figures 2 and 4). Additional studies will be needed to determine the contribution of muscle production of IL-6 and SAA to the proteolytic response we measured in muscle. Thus, muscle proteolytic responses to AngII depend on contributions of other organs. We also found that IL-6 + SAA acted synergistically to increase SOCS3 expression in muscle. The increase in SOCS3 can account for downregulation of IRS-1 and impaired insulin/IGF-1 signaling (documented as decreased Akt phosphorylation [Figure 4]). This pathway explains the loss of muscle mass because we found that AngII infusion into mice overexpressing IGF-1 in muscle do not experience accelerated muscle protein degradation.3 We conclude that AngII-induced muscle wasting is due to defects in insulin/IGF-1 signaling with activation of caspase-3 and the UPS to degrade muscle protein.11,12,21,25,32 Indeed, AngII or rhIL-6 + SAA1 did stimulate proteolytic pathways in muscle (Figure 3, Supplemental Figure 6).
We extensively examined muscle and muscle-derived cells for AngII receptors using ribonuclease protection assay and RT-PCR (Figure 1). Assessment of an AngII-induced calcium spike or phosphorylation of ERK, an AngII target protein, did not reveal the presence of functional AngII receptors in muscle cells (Supplemental Figure 1). Consequently, we cannot explain reports concluding that AngII causes signaling responses in C2C12 myotubes or that the absence of AngII stimulates muscle cell development.33,34 In some cases, nonspecific events can occur with high (10 μM) AngII concentrations.
Because we did not find AngII receptors in mouse muscle or C2C12 or L6 muscle cells, AngII must act by circulating factors that stimulate muscle proteolysis. The AngII-induced increase in circulating IL-6 and SAA (Table 1, Supplemental Figures 2 and 4) led to stimulation of proteolytic pathways and smaller muscles. Notably, in IL-6 KO mice, AngII did not stimulate pathways of muscle protein breakdown or muscle wasting (Figure 3). We note that the absence of IL-6 did not completely block the loss of muscle mass. This could be related to food deprivation, because high levels of AngII suppress appetite and starvation can impair muscle protein metabolism.35,36
How does the absence of IL-6 prevent activation of proteolytic pathways in muscle despite AngII infusion? We found that AngII decreased Akt phosphorylation, a response that triggers activation of caspase-3 and the UPS in muscle,3,11,25,32 but when AngII was infused into IL-6 KO mice, there was no decrease in muscle p-Akt (Figure 4). This is because of the finding that AngII did not decrease IRS-1 in these animals, and, hence, insulin/IGF-1 signaling would not be impaired (Figure 4).
Why is IL-6 necessary for the decrease in muscle IRS-1? Cytokines, including IL-6, stimulate the expression of SOCSs, which in turn stimulates UPS-mediated degradation of IRS-1.26 In AngII-infused mice, we found an increase in muscle SOCS3 levels in WT but not in IL-6 KO mice (Figure 5). We conclude that IL-6 is necessary because it stimulates IRS-1 degradation by upregulating SOCS3 in muscle.
Circulating IL-6 is linked to muscle wasting because injection of IL-6 into rodents produces muscle catabolism; alternatively, treatment with an IL-6 receptor antibody prevents muscle atrophy in mice that overexpress IL-6.27,37,38 IL-6 actions are complex, however, because IL-6 alone does not stimulate protein degradation in isolated muscles.27 Indeed, we found that rhIL-6 alone minimally decreased IRS-1 in C2C12 myotubes (Figure 7A), prompting a search for another mediator. In AngII-infused mice, we found a 100-fold increase in SAAs in an IL-6–dependent manner (Supplemental Figure 4A). Moreover, C2C12 myotubes treated with rhIL-6 + SAA1 exhibited a significant increase in SOCS3 and a significant decrease in IRS-1 (Figure 7). When we treated C2C12 myotubes with rhIL-6 or SAA1 alone, we found a small response of SOCS3, and, in this case, IRS-1 did not decrease.
The concentrations of IL-6 or SAA1 studied in C2C12 myotubes was much higher than circulating levels (Table 1, Figure 1, Supplemental Figure 6) but similar to those used by others.29,39 Despite this difference, SOCS3 and IRS-1 changed minimally in C2C12 myotubes treated with rhIL-6 or SAA1 alone. Possibly, mediators other than SAA1 may be required to stimulate muscle protein degradation in vivo. For example, in several catabolic conditions, including AngII-stimulated muscle protein breakdown,3 glucocorticoids are required to stimulate muscle proteolysis in vivo.
Cytokine-induced SOCS3 expression is activated by the transcription factor STAT3,29 and we found that rhIL-6 + SAA1 significantly increased STAT3 phosphorylation (Figure 7B). This synergistic response was also found in vivo: In WT mice treated to express SAA1 and injected with rhIL-6, STAT3 phosphorylation increased as did SOCS3 mRNA and protein levels; IRS-1 protein was decreased (Figure 6).
The mechanism by which SAA synergizes with IL-6 to increase SOCS3 transcription is unknown. SAA alone could act through a receptor or, alternatively, might stimulate other transcription factors (e.g., NF-κB) via the receptor for advanced glycosylation end products.28,40,41 In our in vivo experiments, SAA1 overexpression or rhIL-6 administration individually was associated with an increase in SOCS3 and decrease in IRS-1, but the combination of SAA1 + rhIL-6 reduced IRS-1 significantly more (P < 0.01). The apparent decrease in IRS-1 induced by SAA1 or rhIL-6 alone can be attributed to the in vivo interaction between SAA and IL-6; SAA1 overexpression raised circulating IL-6, and rhIL-6 treatment raised SAA (Supplemental Figure 5). Taken together, our results indicate that AngII stimulates IL-6–dependent expression of SAA, raising its circulating level. SAA interacts with IL-6 to increase SOCS3 and decrease IRS-1. When SAA + IL-6 act together, there is a 60% decrease in IRS-1 impairing insulin/IGF-1 signaling (i.e., decreased p-Akt). The result is activation of proteolytic pathways in muscle (Figure 8). To examine the interaction of IL-6 with SAA more completely, it would be of interest to infuse AngII into a SAA KO mouse, but this mouse is not available.
Figure 8.
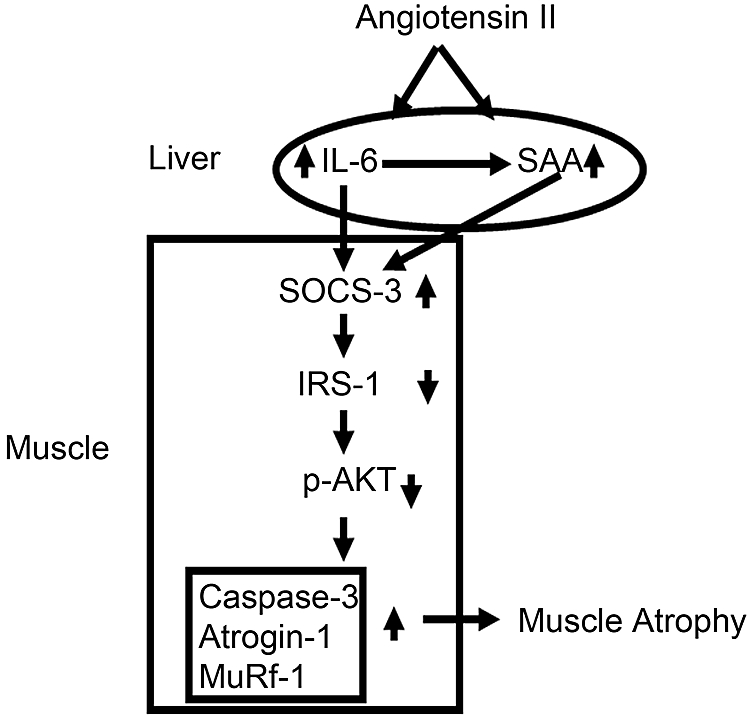
A scheme for the interaction of IL-6 and SAA in stimulating SOCS3 to reduce IRS-1 and impair insulin/IGF-1 signaling (signified by a decrease in p-Akt). Impaired insulin/IGF-1 signaling activates proteolytic pathways, caspase-3, and the UPS, leading to muscle wasting.
In conclusion, interactions among organs can influence muscle protein metabolism. Specifically, AngII stimulates an interaction between the liver and skeletal muscle because the liver becomes the major source of IL-6 and SAA. The result is stimulation of protein breakdown in muscle. This interaction is of special interest because circulating IL-6 rises in a number of catabolic conditions, including CKD.6 These results also suggest there could be new roles for acute-phase proteins.
CONCISE METHODS
Reagents
rhIL-6 and SAA1 were obtained from Bender Medsystems (Burlingame, CA) and PeproTech (Rocky Hill, NJ), respectively. The SAA produced in the liver was identified by RT-PCR as SAA1; the ELISA method (see the ELISA and Multiplex Assay section) for measuring plasma SAA recognized SAA1 and SAA2. Antibodies against phospho-Akt (Ser473), phospho-STAT3 (Tyr 705), and phospho-ERK (42/44) were purchased from Cell Signaling Technology (Beverly, MA). The C-terminus–specific anti-actin, anti-laminin, and anti–β-actin antibodies and AngII and horse serum were purchased from Sigma-Aldrich (St. Louis, MO). Antibodies against IRS-1 and p-IRS-1ser307 were purchased from Upstate Biotechnology (Waltham, MA). Antibodies against ERK or SOCS3 were obtained from Santa Cruz Biotechnology (Santa Cruz, CA); the glyceraldehyde-3-phosphate dehydrogenase (GAPDH) antibody was from Chemicon (Temecula, CA). DMEM and FBS were from Cellgro Mediatech (Manassas, VA). Rat L6 and C2C12 mouse myoblasts from American Type Culture Collection (Manassas, VA) were grown in DMEM to 80% confluence before incubation in DMEM with 2% horse serum for 4 d, stimulating differentiation into myotubes. Myotubes were used in all cell experiments and were treated with 2 μg/ml SAA1 and/or 10 ng/ml rhIL-6.29,39
Intracellular Calcium Measurements
Fura-2/AM was purchased from Molecular Probes (Eugene, OR). C2C12 myoblasts infected with a control Ad-TRACK or Ad-TRACK-AT1 receptor adenoviruses.5 These were plated on 25-mm coverslips and differentiated into myotubes by incubating in 2% horse serum. The myotubes were washed in calcium-free PBS and loaded with 2 μM Fura-2/AM diluted in PBS at room temperature for 1 h. After two washings, the myotubes were equilibrated in PBS for 20 min at room temperature before imaging using an EPI200 Nikon microscope equipped with a TE200-IUC Quantitative Fluorescence Live-Cell and Multidimensional Imaging System and a digital monochrome cooled CCD Roper Coolsnap HQ camera (Roper Scientific, Tucson, AZ). Ca2+ from single myotubes was recorded every 5 s and quantified by calculating the change in fluorescence ratio expressed as a percentage of the AngII-induced value divided by the basal fluorescence value.
ELISA and Multiplex Assay
Cytokines and chemokines (mKC, mRANTES, mINFγ, mIL-1β, mIL-1α, mIL-6, mIL-10, mIL-12[p70], and mTNF-α) in mouse plasma were quantified by the Lincoplex assay kit (Linco Research, St. Charles, MO) and Luminex 100 platform (Bio-Rad, Hercules, CA) according to the manufacturers’ protocol. The concentration of SAA1 and SAA2 in mouse plasma was measured by ELISA kit from Biosource (Camarillo, CA), and, as with cytokines/chemokines, duplicates were measured.
AngII Infusion Model
All animal experiments were approved by the Institutional Animal Care and Use Committee of Baylor College of Medicine. IL-6 KO and WT mice (both of C57/BL6 background) were purchased from Jackson Laboratory (Bar Harbor, ME). Osmotic minipumps (ALZET model 2004; ALZA Corp, Cupertino, CA) were subcutaneously implanted to infuse AngII at 1.5 μg/kg per min. AngII increased the BP of WT mice as demonstrated previously.5 Note that mice in this study were 6 to 10 wk old and, hence, younger than mice studied previously to avoid the known metabolic changes that might occur in older IL-6 KO mice.5 Body weight and food intake of each mouse were measured daily. For pair feeding, PBS-infused WT mouse was given the same amount of food as eaten by the AngII-infused mouse on the previous day. After 7 d, mice were anesthetized and tissues were removed, weighed, and snap-frozen in liquid nitrogen before storing at −80°C.
Protein Degradation
The rate of protein degradation in cultured L6 myotubes was measured from the release of L[14C]phenylalanine from prelabeled cells as described previously.42 The experiment was repeated six times.
RT-PCR
Total RNA was extracted using the RNeasy kit (Qiagen, Valencia, CA), cDNA was synthesized using the first-strand cDNA synthesis kit with oligo dT (12 through 18) primers (Invitrogen, Carlsbad, CA), and RT-PCR was performed (Opticon real-time PCR; MJ Research, Waltham, MA). The RT-PCR conditions were as follows: 42°C for 20 min and then 40 cycles at 95°C for 5 min, 94°C for 20 s, and 72°C for 42 s. The melting curve was run at 65 to 95°C. Relative expression was calculated from cycle threshold values corrected for GAPDH [Ct; relative expression = 2(sample Ct − GAPDH Ct)]. The specificity of RT-PCR was confirmed using agarose gel electrophoresis. The primers were as follows: Mouse SOCS3 5′-CACAGCAAGTTTCCCGCCGCC-3′, 5′-GTGCACCAGCTTGAGTACACA-3′; mouse Atrogin-1 5′-GAGGCAGATTCGCAAGCGTTTGAT-3′, 5′-TCCAGGAGAGAATGT-GGCAGTGTT-3′; mouse MuRF-1 5′-AGTGTCCATGTCTGGAGGTCGTTT-3′, 5′-ACTGGAGCACTCCTGCTTGTAGAT-3′; mouse IL-6 5′-GAGGATACCACTCCCAACAGACC-3′, 5′-AAGTGCATCATCGTTGTTCATACA-3′; mouse SAA1 5′-ACATGAAGGA-AGCTGGCTGGAA-3′, 5′-ATGTCTGTTGGCTTCCTGGTCA-3′; and mouse AT1 receptor 5′-AGCCGTCATCCACCGAAATGTGTA-3′, 5′-TTAGGAAAGGGAACAGGAAGCCCA-3′.
mRNA Expression of AT2, AT1A, and AT1B Receptors
A rat AT2 probe was generated (NM_012494, nucleotides 745 through 1177) from fetal kidney tissue using RT-PCR. A rat AT1A probe (NM_030985) and AT1B probe (NM_031009) were designed from the 3′ untranslated regions, which have low homology between the two receptors. AT1A (323 bp) and AT1B (266 bp) probes were generated from fetal lung and pituitary gland tissues, respectively, by RT-PCR. Three micrograms of RNA from rat aorta smooth muscle cells and L6 myotubes were used in an RNAse protection assay using the Torrey Pines Biolabs kit (Houston, TX) as described previously.18,19
Muscle Fiber Size
Mouse TA muscles were flash-frozen in embedding medium. Cross-sections were fixed in 4% paraformaldehyde at room temperature. After blocking and washing, the slides were incubated for 16 h at 4°C with anti-laminin antibody (Sigma-Aldrich). Alternatively, slides were incubated with type I (Sigma-Aldrich) or type IIA or IIB antibodies (Developmental Studies Hybridoma Bank, University of Iowa, Iowa City, IA); sections were subsequently incubated with the Alexa Fluor secondary antibody (1:400; Molecular Probes) for 30 min at room temperature. After extensive washing with 0.1% TTBS, CSAs of type I, IIA, or IIB fibers were determined using Sigma Pro v5. In each section, at least 500 fibers were examined.
Statistical Analysis
Values are presented as means ± SEM. Results were analyzed using the t test when results from two experimental groups were compared or using ANOVA when data from three groups were studied. For data analyzed by ANOVA, pair-wise comparisons were made by the Student-Newman-Keuls test. P ≤ 0.05 was considered statistically significant.
DISCLOSURES
None.
Acknowledgments
These studies were sponsored by National Institutes of Health grants R37 DK37175, R01 DK62828, and P50 DK64233. The adenovirus expressing SAA1 was generously provided by Dr. Deneys R. van der Westhuyzen (University of Kentucky, Lexington, KY).
We acknowledge the innovative contributions of our friend and colleague, Dr. Lili Feng, who died before the experiments were completed.
Published online ahead of print. Publication date available at www.jasn.org.
Supplemental information for this article is available online at http://www.jasn.org/.
REFERENCES
- 1.Fouque D, Kalantar-Zadeh K, Kopple JD, Cano N, Chauveau P, Cuppari L, Franch HA, Guarnieri G, Ikizler TA, Kaysen GA, Lindholm B, Massy Z, Mitch WE, Pineda E, Stenvinkel P, Trevinho-Becerra T, Wanner C: A proposed nomenclature and diagnostic criteria for protein–energy wasting in acute and chronic kidney disease. Kidney Int 73: 391–398, 2000 [DOI] [PubMed] [Google Scholar]
- 2.Anker SD, Ponikowski P, Varney S, Chua TP, Clark AL, Webb-Peploe KM, Harrington D, Kox WJ, Poole-Wilson PA, Coats AJ: Wasting as independent risk factor for mortality in chronic heart failure. Lancet 349: 1050–1053, 1997 [DOI] [PubMed] [Google Scholar]
- 3.Song Y-H, Li Y, Du J, Mitch WE, Rosenthal N, Delafontaine P: Muscle-specific expression of insulin-like growth factor-1 blocks angiotensin II-induced skeletal muscle wasting. J Clin Invest 115: 451–458, 2005 [DOI] [PMC free article] [PubMed] [Google Scholar]
- 4.Paxton WG, Runge M, Horaist C, Cohen C, Alexander RW, Bernstein KE: Immunohistochemical localization of rat angiotensin II AT1 receptor. Am J Physiol 264: F989–F995, 1993 [DOI] [PubMed] [Google Scholar]
- 5.Zhang L, Cheng J, Ma Y, Thomas W, Zhang J, Du J: Dual pathways for nuclear factor kappaB activation by angiotensin II in vascular smooth muscle: Phosphorylation of p65 by IkappaB kinase and ribosomal kinase. Circ Res 97: 975–982, 2005 [DOI] [PubMed] [Google Scholar]
- 6.Stenvinkel P, Ketteler M, Johnson RJ, Lindholm B, Pecoits-Filho R, Riella M, Heimburger O, Cederholm T, Girndt M: IL-10, IL-6, and TNF-alpha: Central factors in the altered cytokine network of uremia—The good, the bad, and the ugly. Kidney Int 67: 1216–1233, 2005 [DOI] [PubMed] [Google Scholar]
- 7.Cai D, Frantz JD, Tawa NE, Melendez PA, Oh BC, Lidov HG, Hasselgren PO, Frontera WR, Lee J, Glass DJ, Shoelson SE: IKKbeta/NF-kappaB activation causes severe muscle wasting in mice. Cell 119: 285–298, 2004 [DOI] [PubMed] [Google Scholar]
- 8.Hotamisligil GS, Peraldi P, Budavari A, Ellis R, White MF, Spielgelman BM: IRS-1-mediated inhibition of insulin receptor tyrosine kinase activity in TNF-a- and obesity-induced insulin resistance. Science 271: 665–668, 1996 [DOI] [PubMed] [Google Scholar]
- 9.Aguirre V, Werner ED, Giraud J, Lee YH, Shoelson SE, White MF: Phosphorylation of Ser 307 in insulin receptor substrate-1 blocks interactions with the insulin receptor and inhibits insulin action. J Biol Chem 277: 1531–1537, 2002 [DOI] [PubMed] [Google Scholar]
- 10.Wang XL, Zhang L, Youker K, Zhang MX, Wang J, LeMaire SA, Coselli JS, Shen YH: Free fatty acids inhibit insulin signaling-stimulated endothelial nitric oxide synthase activation through upregulating PTEN or inhibiting Akt kinase. Diabetes 55: 2301–2310, 2006 [DOI] [PubMed] [Google Scholar]
- 11.Lee SW, Dai G, Hu Z, Wang X, Du J, Mitch WE: Regulation of muscle protein degradation: Coordinated control of apoptotic and ubiquitin-proteasome systems by phosphatidylinositol 3 kinase. J Am Soc Nephrol 15: 1537–1545, 2004 [DOI] [PubMed] [Google Scholar]
- 12.Wang XH, Hu Z, Hu JP, Du J, Mitch WE: Insulin resistance accelerates muscle protein degradation: Activation of the ubiquitin-proteasome pathway by defects in muscle cell signaling. Endocrinology 147: 4160–4168, 2006 [DOI] [PubMed] [Google Scholar]
- 13.May RC, Kelly RA, Mitch WE: Metabolic acidosis stimulates protein degradation in rat muscle by a glucocorticoid-dependent mechanism. J Clin Invest 77: 614–621, 1986 [DOI] [PMC free article] [PubMed] [Google Scholar]
- 14.Mitch WE, Bailey JL, Wang X, Jurkovitz C, Newby D, Price SR: Evaluation of signals activating ubiquitin-proteasome proteolysis in a model of muscle wasting. Am J Physiol 276: C1132–C1138, 1999 [DOI] [PubMed] [Google Scholar]
- 15.Wing SS, Goldberg AL: Glucocorticoids activate the ATP-ubiquitin-dependent proteolytic system in skeletal muscle during fasting. Am J Physiol 264: E668–E676, 1993 [DOI] [PubMed] [Google Scholar]
- 16.Tiao G, Fagan J, Roegner V, Lieberman M, Wang J-J, Fischer JE, Hasselgren P-O: Energy-ubiquitin-dependent muscle proteolysis during sepsis in rats is regulated by glucocorticoids. J Clin Invest 97: 339–348, 1996 [DOI] [PMC free article] [PubMed] [Google Scholar]
- 17.Zhang LP, Cui RW, Cheng XD, Du J: Anti-apoptotic effect of serum and glucocorticoid-inducible protein kinase is mediated by a novel mechanism activating IkB kinase. Cancer Res 65: 457–464, 2005 [PubMed] [Google Scholar]
- 18.Chen S, Bacon KB, Li L, Garcia GE, Xia YM, Lo D, Thompson DA, Siani MA, Yamamoto T, Harrison JK, Feng L: In vivo inhibition of CC and CX3C chemokine-induced leukocyte infiltration and attenuation of glomerulonephritis in Wistar-Kyoto (WKY) rats by vMIP-II. J Exp Med 188: 193–198, 1998 [DOI] [PMC free article] [PubMed] [Google Scholar]
- 19.Garcia GE, Truong PL, Chen J-F, Feng L: Adenosine A2A receptor activation and macrophage-mediated experimental glomerulonephritis. FASEB J 22: 445–454, 2008 [DOI] [PMC free article] [PubMed] [Google Scholar]
- 20.Du J, Wang X, Meireles CL, Bailey JL, Debigare R, Zheng B, Price SR, Mitch WE: Activation of caspase 3 is an initial step triggering muscle proteolysis in catabolic conditions. J Clin Invest 113: 115–123, 2004 [DOI] [PMC free article] [PubMed] [Google Scholar]
- 21.Bailey JL, Price SR, Zheng B, Hu Z, Mitch WE: Chronic kidney disease causes defects in signaling through the insulin receptor substrate/phosphatidylinositol 3-kinase/Akt pathway: Implications for muscle atrophy. J Am Soc Nephrol 17: 1388–1394, 2006 [DOI] [PubMed] [Google Scholar]
- 22.Workeneh B, Rondon-Berrios H, Zhang L, Hu Z, Ayehu G, Ferrando A, Kopple JD, Wang H, Storer TW, Fournier M, Lee SW, Du J, Mitch WE: Development of a diagnostic method for detecting increased muscle protein degradation in patients with catabolic conditions. J Am Soc Nephrol 17: 3233–3239, 2006 [DOI] [PubMed] [Google Scholar]
- 23.Bodine SC, Latres E, Baumhueter S, Lai VK, Nunez L, Clark BA, Poueymirou WT, Panaro FJ, Na E, Dharmarajan K, Pan ZQ, Valenzuel DM, DeChiara TM, Stitt TN, Yancopoulos GD, Glass DJ: Identification of ubiquitin ligases required for skeletal muscle atrophy. Science 294: 1704–1708, 2001 [DOI] [PubMed] [Google Scholar]
- 24.Gomes MD, Lecker SH, Jagoe RT, Navon A, Goldberg AL: Atrogin-1, a muscle-specific F-box protein is highly expressed during muscle atrophy. Proc Natl Acad Sci U S A 98: 14440–14445, 2001 [DOI] [PMC free article] [PubMed] [Google Scholar]
- 25.Stitt TN, Drujan D, Clarke BA, Panaro F, Timofeyva Y, Klinenber JR, Gonzalez M, Yancopoulos GD, Glass DJ: The IGF-1/PI3K/Akt pathway prevents expression of muscle atrophy-induced ubiquitin ligases by inhibiting FOXO transcription factors. Mol Cell 14: 395–403, 2004 [DOI] [PubMed] [Google Scholar]
- 26.Rui L, Yuan M, Frantz D, Shoelson S, White MF: SOCS-1 and SOCS-3 block insulin signaling by ubiquitin-mediated degradation of IRS1 and IRS2. J Biol Chem 277: 42394–42398, 2002 [DOI] [PubMed] [Google Scholar]
- 27.Goodman MN: Interleukin-6 induces skeletal muscle protein breakdown in rats. Proc Soc Exp Biol Med 205: 182–185, 1994 [DOI] [PubMed] [Google Scholar]
- 28.Van der Westhuyzen DR, Cai L, de Beer MC, de Beer FC: Serum amyloid A promotes cholesterol efflux mediated by scavenger receptor B-I. J Biol Chem 280: 35890–35895, 2005 [DOI] [PubMed] [Google Scholar]
- 29.Zhang L, Badgwell DB, Bevers JJ III, Schlessinger K, Murray PJ, Levy DE, Watowich SS: IL-6 signaling via the STAT3/SOCS3 pathway: Functional analysis of the conserved STAT3 N-domain. Mol Cell Biochem 288: 179–189, 2006 [DOI] [PMC free article] [PubMed] [Google Scholar]
- 30.Forstermann U: Oxidative stress in vascular disease: causes, defense mechanisms and potential therapies. Nat Clin Pract Cardiovasc Med 5: 338–349, 2008 [DOI] [PubMed] [Google Scholar]
- 31.Brenner BM, Cooper ME, De Zeeuw D, Keane WF, Mitch WE, Parving H-H, Remuzzi G, Snapinn SM, Zhang Z, Shahinfar S: Effects of losartan on renal and cardiovascular outcomes in patients with type 2 diabetes and nephropathy. N Engl J Med 345: 861–869, 2001 [DOI] [PubMed] [Google Scholar]
- 32.Sandri M, Sandri C, Gilbert A, Skuck C, Calabria E, Picard A, Walsh K, Schiaffino S, Lecker SH, Goldberg AL: Foxo transcription factors induce the atrophy-related ubiquitin ligase atrogin-1 and cause skeletal muscle atrophy. Cell 117: 399–412, 2004 [DOI] [PMC free article] [PubMed] [Google Scholar]
- 33.Puri PL, Avantaggiati ML, Burgio VL, Chirillo P, Collepardo D, Natoli G, Balsano C, Levrero M: Reactive oxygen intermediates mediate angiotensin II-induced c-Jun.c-Fos heterodimer DNA binding activity and proliferative hypertrophic responses in myogenic cells. J Biol Chem 270: 22129–22134, 1995 [DOI] [PubMed] [Google Scholar]
- 34.Mori S, Tokuyama K: Variation in ACE activity affects myogenic differentiation in C2C12 cells. Biochem Biophys Res Commun 353: 369–375, 1995 [DOI] [PubMed] [Google Scholar]
- 35.Brink M, Price SR, Chrast J, Bailey JL, Anwar A, Mitch WE, Delafontaine P: Angiotensin II induces skeletal muscle wasting through enhanced protein degradation and down regulation of autocrine insulin-like growth factor-1. Endocrinology 142: 1489–1496, 2001 [DOI] [PubMed] [Google Scholar]
- 36.Li JB, Goldberg AL: Effects of food deprivation on protein synthesis and degradation in rat skeletal muscles. Am J Physiol 231: 441–448, 1995 [DOI] [PubMed] [Google Scholar]
- 37.Fujita J, Tsujinaka T, Ebisui C, Yano M, Shiozaki H, Katsume A, Ohsugi Y, Monden M: Role of interleukin-6 in skeletal muscle protein breakdown and cathepsin activity in vivo. Eur Surg Res 28: 361–366, 1996 [DOI] [PubMed] [Google Scholar]
- 38.Tsujinaka T, Fujita J, Ebisui C, Yano M, Kominami E, Suzuki K, Tanaka K, Katsume A, Ohsugi Y, Shiozaki H, Monden M: Interleukin 6 receptor antibody inhibits muscle atrophy and modulates proteolytic systems in interleukin 6 transgenic mice. J Clin Invest 97: 244–249, 1996 [DOI] [PMC free article] [PubMed] [Google Scholar]
- 39.Cai Z, Cai L, Jiang J, Chang KS, Van der Westhuyzen DR, Luo G: Human serum amyloid A protein inhibits hepatitis C virus entry into cells. J Virol 81: 6128–6133, 2007 [DOI] [PMC free article] [PubMed] [Google Scholar]
- 40.Wang ZG, Ye RD: Characterization of two new members of the formyl peptide receptor gene family from 129S6 mice. Gene 299: 57–63, 2002 [DOI] [PubMed] [Google Scholar]
- 41.Okamoto H, Katagiri Y, Kiire A, Momohara S, Kamatani N: Serum amyloid A activates nuclear factor-kappaB in rheumatoid synovial fibroblasts through binding to receptor of advanced glycation end-products. J Rheumatol 35: 752–756, 2008 [PubMed] [Google Scholar]
- 42.England BK, Chastain J, Mitch WE: Abnormalities in protein synthesis and degradation induced by extracellular pH in BC3H1 myocytes. Am J Physiol 260: C277–C282, 1991 [DOI] [PubMed] [Google Scholar]