Abstract
Over time, peritoneal dialysis results in functional and structural alterations of the peritoneal membrane, but the underlying mechanisms and whether these changes are reversible are not completely understood. Here, we studied the effects of high levels of glucose, which are found in the dialysate, on human peritoneal mesothelial cells (HPMCs). We found that high concentrations of glucose induced epithelial-to-mesenchymal transition (EMT) of HPMC, suggested by decreased expression of E-cadherin and increased expression of α-smooth muscle actin, fibronectin, and type I collagen and by increased cell migration. Normalization of glucose concentration on day 2 reversed the phenotypic transformation, but the changes were irreversible after 7 d of stimulation with high glucose. In addition, exposure of HPMC to high glucose resulted in a decreased expression of the antifibrotic cytokines, hepatocyte growth factor (HGF) and bone morphogenic protein 7 (BMP-7). Exogenous treatment with HGF resulted in a dosage-dependent prevention of high glucose–induced EMT. Both BMP-7 peptide and gene transfection with an adenoviral vector of BMP-7 also protected HPMCs from EMT. Furthermore, adenoviral BMP-7 transfection decreased peritoneal EMT and ameliorated peritoneal thickening in an animal model of peritoneal dialysis. In summary, high concentrations of glucose induce a reversible EMT of HPMCs, associated with decreased production of HGF and BMP-7. Treatment of HPMCs with HGF or BMP-7 blocks high glucose–induced EMT, and BMP-7 ameliorates peritoneal fibrosis in an animal model of peritoneal dialysis.
Long-term peritoneal dialysis (PD) is known to result in functional and structural alterations in the peritoneal membrane.1–3 Although the exact mechanisms of peritoneal damage during PD still remain unclear, complex interactions of host and local factors, each components of unphysiologic conventional dialysate such as hypertonicity, high concentrations of glucose and lactate, acidic pH, and the presence of glucose degradation products (GDP) associated with an activation of inflammatory cytokine and various growth factors, all are responsible.4 High glucose (HG) itself is proved to induce a profibrotic and proinflammatory reaction.5,6 HG upregulates the expression of β1 (TGF-β1),7,8 vascular endothelial growth factor,9 and monocyte chemoattractant peptide-110 with an induction of apoptosis of peritoneal mesothelial cells.11 Most HG-associated effects were known to be mediated primarily by glucose itself or GDP, depending on parameters used for assessing functional and structural changes in peritoneal membrane or cells.3,12
Epithelial-to-mesenchymal transition (EMT) or mesothelial-to-mesenchymal transition of peritoneal mesothelial cells has been regarded as an early mechanism of peritoneal fibrosis.13 Yanez-Mo et al.13 demonstrated mesothelial cells from dialysate effluents showed a progressive loss of epithelial characteristics and acquired a fibroblast-like phenotype. EMT is a process whereby epithelial cell layers lose polarity and cell–cell contacts and undergo a dramatic remodeling of the cytoskeleton.14,15 Concurrent with a loss of epithelial cell adhesion and cytoskeletal components, cells undergoing EMT acquire the expression of mesenchymal components and manifest a migratory phenotype.16,17 Although EMT is a critical and physiologic process in embryogenesis and tissue repair, it can impose an unfavorable effect by promoting tissue fibrosis in nonphysiologic conditions. In several animal models of organ fibrosis, the inhibition of EMT could prevent the progression of tissue fibrosis, suggesting that EMT was an important mediator of organ damage.18,19
Although peritoneum in PD patients is continuously exposed to various unfavorable stimuli to residential cells, it may also have its own protective system against profibrotic and proinflammatory insults. Hepatocyte growth factor (HGF) and bone morphogenic protein 7 (BMP-7) are intrinsic antifibrotic factors that prevent organ fibrosis20–23; however, their roles in peritoneal fibrosis have not been extensively studied. Treatment of HGF was reported to prevent fibrosis and angiogenesis of peritoneum associated with an enhancement of peritoneal cell proliferation and viability.24,25 There was also a brief report showing the beneficial effect of BMP-7 on phenotypic transformation of peritoneal cells in ex vivo study26; however, despite a demonstration of the presence of EMT of peritoneal mesothelial cells in patients undergoing PD, there have been few studies about the mechanism of peritoneal EMT, especially regarding the role of HGF or BMP-7.
In this study, we examined the effect of HG per se on EMT of cultured HPMCs and its reversibility with a removal of HG stimulation. Thereafter, we studied HG-induced alteration in the expression of intrinsic antifibrotic cytokines, HGF and BMP-7. We also investigated whether the treatment of HGF or BMP-7 can prevent or reverse EMT of peritoneal cells. Because there has been no in vivo study regarding the effect of BMP-7 on peritoneal fibrosis, we examined the effect of BMP-7 gene transfer on EMT and peritoneal fibrosis in an animal model of PD.
RESULTS
Effect of HG on EMT of HPMC and Its Reversibility
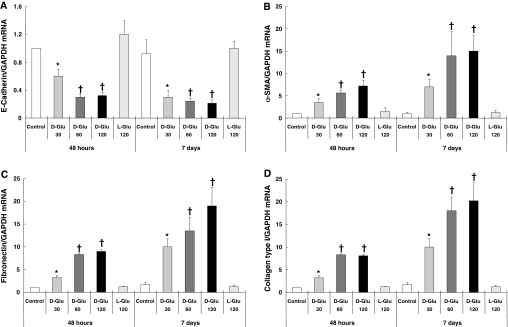
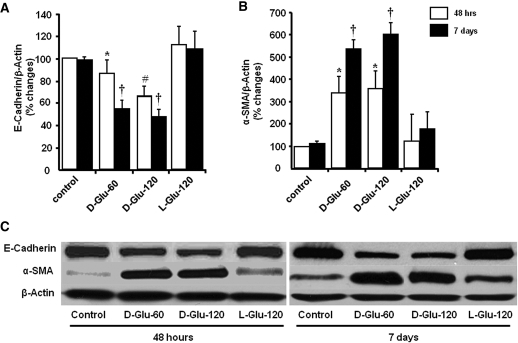
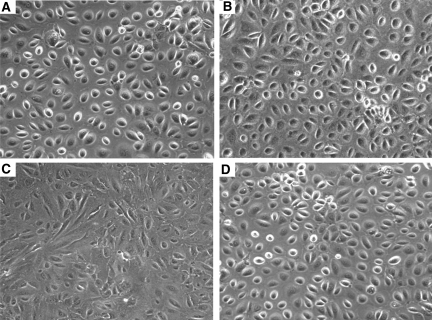
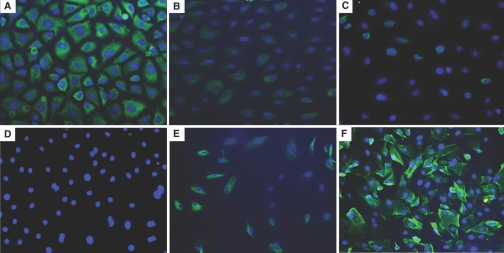
Exposure of HPMCs to HG solution (30, 60, and 120 mM d-glucose) for 2 to 7 d decreased the mRNA expression of epithelial cell marker E-cadherin, associated with an increase in the expression of mesenchymal markers, α-smooth muscle actin (α-SMA), fibronectin, and collagen type I (Figure 1). l-Glucose changed the expression of none of these markers (Figure 1), which suggested not high osmolality but HG per se induced EMT of HPMCs. Figure 2 shows the change in protein expression of E-cadherin and α-SMA on days 2 and 7 of stimulation. Morphologic changes of cultured HPMCs on days 2 and 7 are shown in Figure 3. There were no significant changes in the characteristic cobblestone-like appearance of HPMC monolayer on day 2; however, loss of cell contacts with an acquisition of elongated fibroblastoid morphology was observed after 7 d of HG stimulation (Figure 3C). Immunofluorescence staining demonstrated a gradual decrease in cytokeratin, a marker of epithelial cells, and an increase and reorganization of SMA filament as early as 2 d of HG stimulation (Figure 4).
Figure 1.
Effect of HG on mRNA expression of epithelial and mesenchymal cell markers. HG (d-glucose 30, 60, and 120 mM/L) stimulation induced the EMT of HPMCs shown as a decreased expression of E-cadherin (A) and an increase in the expressions of α-SMA (B), fibronectin (C), and collagen type I (D) at 48 h and 7 d. Glucose concentrations >60 mM/L showed a comparable effect without a definite dosage dependence. l-Glucose (120 mM/L) did not induce any changes in mRNA expression of the markers of epithelial and mesenchymal cells (n = 7). *P < 0.05 versus control and l-glucose at each time point; †P < 0.05 versus control, l-glucose and 30 mM of d-glucose at each time point.
Figure 2.
Effect of HG on protein expression of E-cadherin and α-SMA. (A and B) HG induced a significant decrease in protein expression of E-cadherin (A) and an increase in α-SMA (B) at 48 h and 7 d of stimulation. (C) Representative Western blot demonstrated HG-induced alteration in E-cadherin and α-SMA (n = 6). *P < 0.05 versus control and l-glucose of 48 h; †P < 0.05 versus control and l-glucose of day 7 and d-glucose of 48 h at each glucose concentration; #P < 0.05 versus control, l-glucose, and 60 mM of d-glucose at 48 h.
Figure 3.
Effect of HG on cell morphology. (A and C) Representative photomicrograph shows the cobblestone-like appearance of normal mesothelial cells (A), which converted into a fibroblast-like morphology after continuous stimulation with HG (60 mM/L d-glucose) for 7 d (C). (B and D) There was no significant change in cell shape with 2 d of stimulation of d-glucose (60 mM/L; B) or 7 d stimulation of l-glucose (60 mM/L; D). n = 5. Magnification, ×100.
Figure 4.
Effect of HG on cytokeratin and α-SMA expression. In parallel to morphologic changes, HG (B, C, E, and F) also decreased the expression of the epithelial marker cytokeratin (A through C) with an increase in the expression of α-SMA (D through F) at day 2 (B and E) and day 7 (C and F) compared with control (A and D). n = 5. Magnification, ×200.
Interestingly, a change of culture medium after 2 d of stimulation with HG into normal glucose medium resulted in a reversal of altered expression of E-cadherin and α-SMA after an additional incubation for 2 d (Figure 5); however, 7 d of stimulation of HG followed by incubation of normal glucose medium for 2 d was not associated with a reversal of EMT. This finding suggests HG-induced EMT of HPMC is reversible at early time points but becomes irreversible at late time points.
Figure 5.
Reversibility of HG-induced EMT of HPMCs. (A and B) HG-induced alteration in protein expression of E-cadherin (A) and α-SMA (B) was reversible with an exposure to media with normal glucose (NG) concentration after 48 h of HG stimulation; however, it became irreversible after 7 d of exposure to HG. (C) Representative Western blot demonstrated HG-induced EMT and its reversibility. n = 6. *P < 0.05 versus control at each time point.
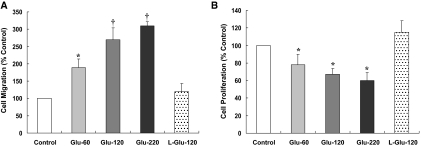
To examine whether HG-induced phenotypic alteration was associated with the change of cell motility, we used a transwell migration method using the Boyden chamber. As shown in Figure 6, HG stimulation for 48 h induced an increased migration of HPMC. To investigate whether HG-induced change in cell migration was caused by an enhancement of cell proliferation, we used 3-[4,5-dimethylthiazol-2-yl]-2,5-diphenyltetrazolium bromide (MTT) assay. Despite that HG per se increased cell migration, it inhibited cell proliferation (Figure 6B) on day 2, indicating that the HG effect on cell migration was not caused by an increase of cell proliferation.
Figure 6.
Effect of HG on migration and proliferation of HPMCs. (A and B) Stimulation of HPMCs with HG for 48 h induced cell migration assessed by Boyden chamber assay (A), whereas it inhibited the proliferation of HPMCs (B). n = 5. *P < 0.05 versus control and l-glucose; †P < 0.05 versus control, l-glucose, and 60 mM/L d-glucose.
Effect of HG on HGF and BMP-7 Production
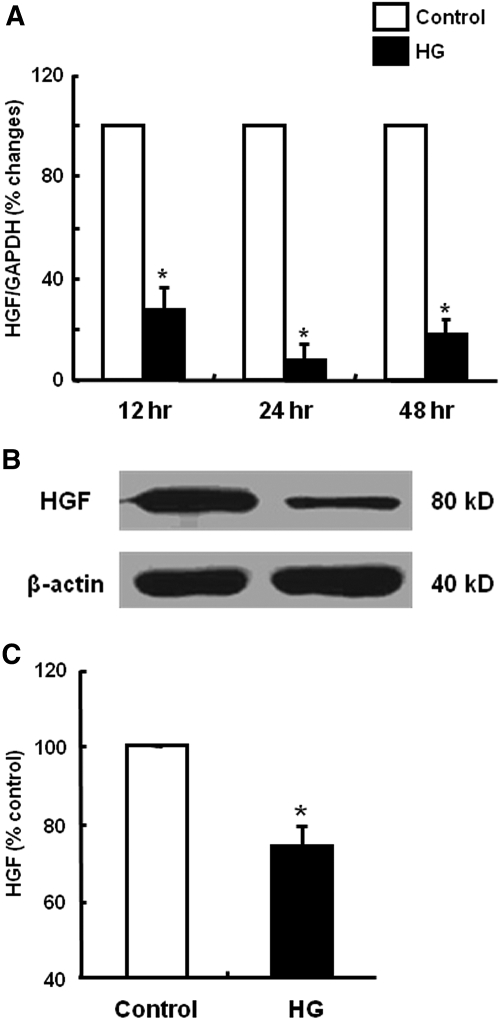
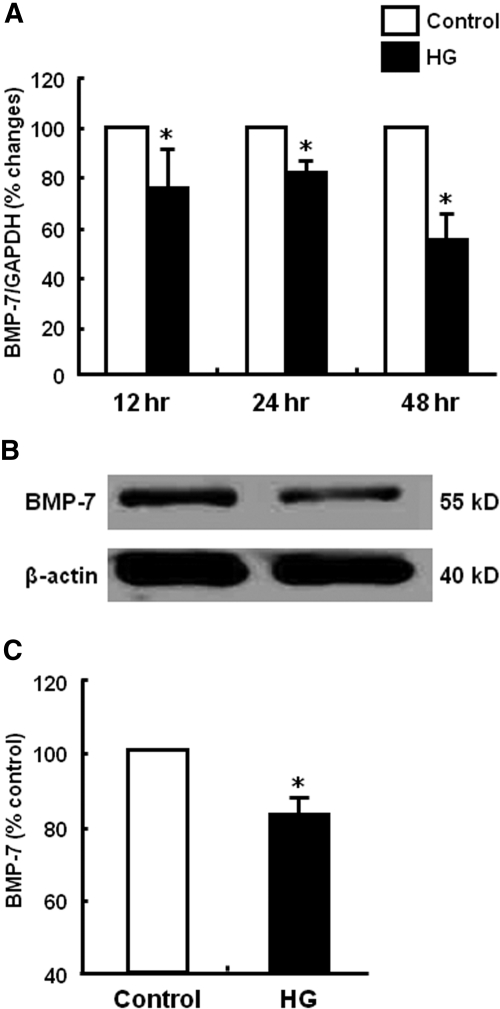
To investigate the mechanism of HG-induced EMT, we first examined whether HPMCs constitutively expressed two key antifibrotic factors, HGF and BMP-7, and whether the expression of HGF and BMP-7 was altered by HG stimulation. As shown in Figures 7 and 8, HPMCs constitutively expressed HGF and BMP-7, suggesting that HPMCs have their own protective system against fibrosis. Baseline amounts of HGF and BMP-7 protein assessed by ELISA were 100.5 ± 12.5 and 104.6± 20.3 pg/mg, respectively. Interestingly, HG stimulation significantly decreased HGF and BMP-7 mRNA and protein expression (Figures 7 and 8). Especially HGF mRNA expression had decreased to 8.8% of control at 24 h after HG stimulation. Decreased production of HGF and BMP-7 protein by HG stimulation was also confirmed by ELISA (Figures 7C and 8C).
Figure 7.
Effect of HG on HGF production of HPMCs. (A) HG (60 mM/L d-glucose) induced a decrease in HGF mRNA expression from 12 to 48 h. (B and C) HG also decreased the production of HGF protein at 48 h assessed by Western blotting (B) and ELISA (C). n = 5. *P < 0.05 versus control at each time point.
Figure 8.
Effect of HG on BMP-7 production of HPMCs. (A) HG (60 mM/L d-glucose) induced a decrease in BMP-7 mRNA expression from 12 to 48 h. (B and C) HG also decreased the production of BMP-7 protein at 48 h assessed by Western blotting (B) and ELISA (C). n = 5. *P < 0.05 versus control at each time point.
Effect of HGF on HG-Induced EMT of HPMC
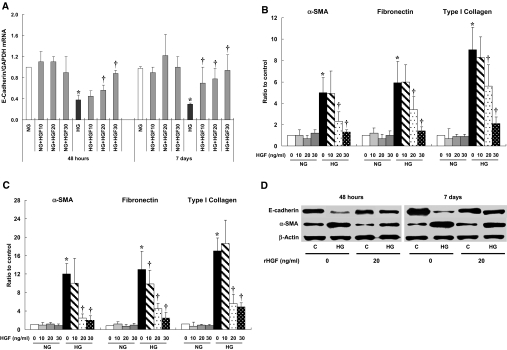
Because we observed that HG stimulation decreased the expression of antifibrotic cytokines associated with EMT, we examined the effect of HGF or BMP-7 treatment on HG-induced EMT. Treatment of HPMCs with recombinant human HGF (10, 20, and 30 ng/ml) showed a dosage-dependent amelioration of HG-induced changes in markers of EMT on days 2 and 7 (Figure 9). HGF treatment significantly protected cells from EMT at concentrations of >20 ng/ml HGF, whereas no effect on EMT was seen with 10 ng/ml HGF except E-cadherin mRNA expression on day 7. Effect of 20 ng/ml HGF on E-cadherin and α-SMA protein expression is shown in Figure 7D. HGF treatment also reversed the HG-induced increase in cell migration at 48 h (data not shown).
Figure 9.
Effect of rHGF on HG-induced EMT of HPMCs. (A through C) rHGF ameliorated HG-induced alteration in mRNA expressions of E-cadherin (A) and α-SMA, fibronectin, and type I collagen from a dosage of 20 ng/ml at 48 h (B) and 7 d (C) of treatment. (D) Representative Western blotting shows an amelioration of HG-induced changes in E-cadherin and α-SMA with 20 ng/ml rHGF. n = 6 for real-time PCR, and n = 5 for Western blotting. *P < 0.05 versus NG at each time point; †P < 0.05 versus HG at each time point.
Effect of BMP-7 on HG-Induced EMT of HPMC
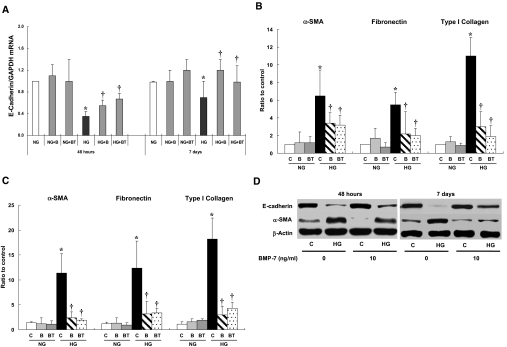
We examined the effect of BMP-7 on HG-induced EMT in two ways: Via the treatment of BMP-7 peptide and BMP-7 gene transfer. Figure 10 shows a significant increase in BMP-7 production up to 7 d of gene transfection in HPMCs. Either BMP-7 peptide treatment (1 to 100 ng/ml) or BMP-7 transfection significantly ameliorated HG-induced changes in mRNA expression of E-cadherin, α-SMA, fibronectin, and collagen I from days 2 to 7 (Figure 11). Consistent with mRNA data, BMP-7 treatment resulted in an amelioration of HG-induced changes in E-cadherin and α-SMA proteins of HPMCs on day 7 (Figure 11D). BMP-7 treatment also resulted in a reversal of HG-induced increase in cell migration at 48 h (data not shown).
Figure 10.
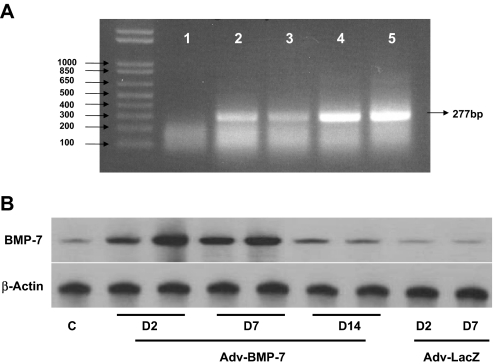
Expression of BMP-7 mRNA and protein of HPMCs after adenoviral gene transfer. (A) Representative RT-PCR shows BMP-7 gene abundance with Adv-BMP-7 transfection (lanes 4 and 5) compared with negative control (lane 1), nontransfected control (lane 2), or Adv-LacZ transfection (lane 3) at 48 h after transfection. (B) Representative Western blot shows a time course of BMP-7 protein production, which is maintained in high abundance up to 7 d (D7) of Adv-BMP-7 transfection compared with control without transfection (C) or Adv-LacZ transfection.
Figure 11.
Effect of BMP-7 on HG-induced EMT of HPMCs. (A through C) Both rBMP-7 (10 ng/ml; B) and Adv-BMP-7 gene transfection (BT) ameliorated HG-induced alteration in mRNA expressions of E-cadherin (A) and α-SMA, fibronectin, and type I collagen at 48 h (B) and 7 d (C) of treatment. (D) Representative Western blotting shows an amelioration of HG-induced changes in E-cadherin and α-SMA with 10 ng/ml BMP-7. n = 6 for real-time PCR, and n = 5 for Western blotting. *P < 0.05 versus NG at each time point; †P < 0.05 versus HG at each time point.
Effects of Antifibrotic Peptides on Reversibility of Cell Morphology and Phenotypic Transformation after Prolonged HG Stimulation
Because we observed that 7 d of stimulation of HG resulted in an irreversible transformation of cell morphology and phenotype (Figures 3 through 5), we also examined whether treatment of either HGF or BMP-7 affected the irreversible EMT induced by prolonged incubation with HG for 7 d. Treatment of cells with HGF (20 ng/ml) or BMP-7 (10 ng/ml) peptide for 2 d after 7 d of stimulation of HG resulted in a reversal of cell morphology and altered expression of cytokeratin and α-SMA (Figure 12).
Figure 12.
Effect of combined treatment of HGF or BMP-7 peptides with a removal of HG on phenotypic transformation of HPMCs after long-term stimulation with HG. (A through E) Morphologic transformation of cells before (A) and after (B) continuous stimulation with HG for 7 d, which is not reversible with a switch of culture medium with NG concentration for 2 d (C), is ameliorated with combined treatment of removal of HG and HGF (20 ng/ml; D) or BMP-7 (10 ng/ml; E) treatment for 2 d. (F through I) Immunofluorescence microscope reveals that altered expression of cytokeratin (F and G) and α-SMA (H and I) in HG-stimulated cells (F and H) is recovered with HG removal and BMP-7 peptide treatment for 2 d (G and I). Magnifications: ×100 in A through E; ×250 in F through I.
Effect of BMP-7 Transfection in Animal Model of PD
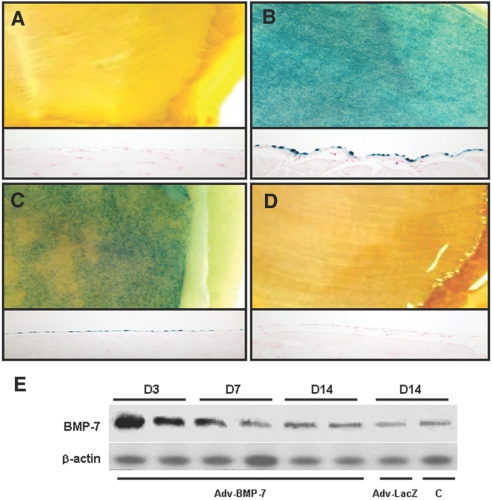
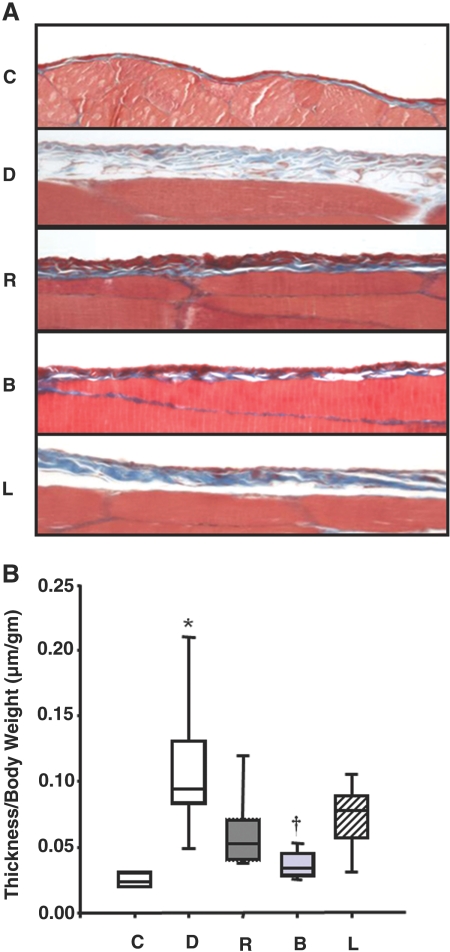
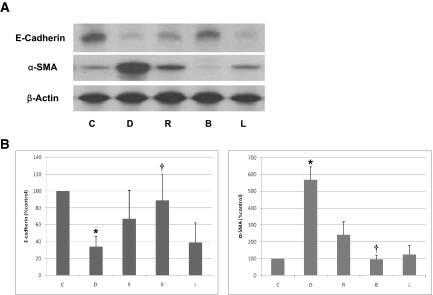
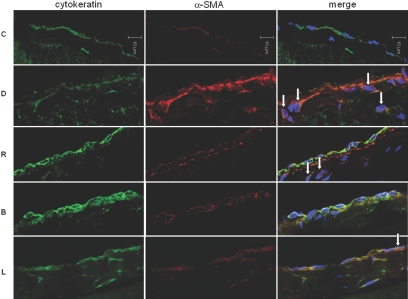
Adenovirus-harboring human BMP-7 (Adv-BMP-7) gene transfer resulted in a significant increase in BMP-7 expression to day 7 but returned almost to the pretreatment level on day 14 shown in X-gal staining (Figure 13, A through D) and Western blotting (Figure 13E). After 6 wk of experimental PD in rats, the thickness of the peritoneal membrane in group D was significantly increased compared with group C. Peritoneal rest for 2 wk after 6 wk of PD (group R) resulted in decreased peritoneal thickness (Figure 14), suggesting that peritoneal fibrosis is a reversible process with a removal of offending stimuli. Treatment of BMP-7 showed an additional benefit in terms of peritoneal fibrosis as evidenced by decreased peritoneal thickness in group B compared with groups R and L. Altered expression of E-cadherin and α-SMA in the dialysis group (group D) was reversed by peritoneal rest (group R), which was further ameliorated by BMP-7 transfection (group B; Figure 15). Adenoviral gene transfer of LacZ (group L) showed no additional benefit in reversing EMT and peritoneal thickening compared with group R. Immunofluorescence stain also demonstrated that BMP-7 gene transfection reversed an alteration of the expression of cytokeratin and α-SMA in peritoneal membrane of animals in group D (Figure 16). An increase in the number of submesothelial dual-stained cytokeratin- and α-SMA–positive myofibroblasts in group D was ameliorated by peritoneal rest (group R), which was further decreased by Adv-BMP-7 transfection (group B).
Figure 13.
Expression of β-gal and BMP-7 in an animal model of PD after adenoviral gene transfer. (A through D) Gross morphology of abdominal walls (top) and the expression of X-gal were evaluated by histochemical staining with X-gal (bottom) after intraperitoneal injection with Adv-LacZ (A, control; B, 3 d after injection; C, 7 d after injection; D, 14 d after injection). An increased expression was noted until 7 d after injection, and it is reduced to the level of control after 14 d. (E) Representative Western blot shows BMP-7 protein abundance in rat peritoneum up to 14 d (D14) after Adv-BMP-7 gene transfer compared with Adv-LacZ transfection or control (C) without transfection at day 14 (D14).
Figure 14.
Effect of BMP-7 on thickness of peritoneal membrane. (A) Trichrome-stained parietal peritoneum of abdominal wall shows a marked increase in submesothelial matrix in group D (dialysis), which is ameliorated by peritoneal rest (group R). Adv-BMP-7 transfection (group B) further decreases peritoneal thickening compared with groups R and L (Adv-LacZ transfection). (B) The peritoneal thickness/body weight (μm/g) assessed by morphometric analysis is increased in group D compared with group C (control) and group R, which is further decreased in group B. *P < 0.05 versus other groups; †P < 0.05 versus groups D, R, and L. Horizontal lines at the top, middle, and bottom of the boxes show the 75th, 50th, and 25th percentiles, respectively, and vertical lines above and below the boxes show the 90th and 10th percentiles, respectively. Magnification, ×400.
Figure 15.
Effect of BMP-7 on EMT of peritoneum. (A and B) Representative Western blot (A) and quantitative analysis (B) demonstrate the EMT of rat peritoneum shown as a decrease in E-cadherin and an increase in α-SMA in group D (dialysis). Altered expression of E-cadherin and α-SMA in group D is ameliorated by peritoneal rest (group R), which is further improved by Adv-BMP-7 transfection (group B). Adv-LacZ transfection (group L) shows no additional benefit in reversing EMT. *P < 0.05 versus other groups; †P < 0.05 versus groups D, R, and L.
Figure 16.
Effect of BMP-7 on the number of submesothelial myofibroblast in an animal model of PD. Immunofluorescence microscopy stained for cytokeratin (green) and α-SMA (red) with nuclear counterstain (blue, DAPI) demonstrates an increase in submesothelial dual-stained cytokeratin- and α-SMA–positive myofibroblasts (arrow) in group D associated with a decrease in cytokeratin and an increase in α-SMA expression. Peritoneal rest decreases the number of these cells in group R, which is further decreased by Adv-BMP-7 transfection (group B). Magnification, ×640.
DISCUSSION
Phenotypic transition of peritoneal mesothelial cell to mesenchymal cell (“EMT’ of peritoneal mesothelium) has been recognized as an important mechanism of peritoneal fibrosis.13,27 A recent article28 also demonstrated the association of EMT and ultrafiltration failure in PD patients, which highlighted the clinical significance of peritoneal EMT as a cause of peritoneal dysfunction and damage; however, there have been limited data regarding the exact mechanism of peritoneal EMT and the role of each component of peritoneal dialysate on EMT. No study yet has shown whether HG itself is responsible for peritoneal EMT. Our study demonstrated HG per se induced EMT of cultured HPMCs for the first time. HG-induced EMT seemed to be due to glucose per se and not related to high osmolality, because l-glucose, a compound sharing osmotic properties of d-glucose but presenting different intracellular metabolism and metabolically inactive, did not induce EMT. HG-induced phenotypic transition was observed as early as 48 h of stimulation before any significant morphologic changes of cells, which suggests HG-induced alteration in cell phenotype may be one of the earliest phenomena of peritoneal damage.29 There were several reports about the EMT of mesothelial cells of different origins.13,30,31 Most of those studies demonstrated EMT at later time points than in our study with transformation into fibroblastoid morphology. Yang et al.32 showed myofibroblastic conversion of cultured mesothelial cells by stimulation of TGF-β for 1 wk, and Vargha et al.26 also demonstrated EMT of mesothelial cells from peritoneal effluent after 7 d of stimulation of TGF-β. Early phenotypic transformation of HPMCs before the development of morphologic change suggests an important clinical relevance suggesting an early intervention targeting EMT before morphologic changes of cells may protect the peritoneum from the fibroblastoid cell transformation of mesothelial cells and further peritoneal fibrosis.
Consistent with this speculation, early phenotypic transformation of HPMCs was reversible in our experiment. Although peritoneal fibrosis was regarded as a relentless process once it started,33 HG stimulation for 48 h followed by a removal of HG milieu resulted in a significant reversal of EMT of HPMCs with epithelial redifferentiation to prestimulation level. Consistent with in vitro experimental results, in an animal model of PD, peritoneal rest after 6 wk of dialysis with 4.25% HG-based dialysate resulted in a reversal of EMT and peritoneal thickening. However, HG-induced EMT after 7 d of stimulation was not reversible in our experiment, suggesting EMT is a reversible process at early time points but may result in an irreversible phenotypic transformation with prolonged stimulation with unphysiologic dialysate. Aguilera et al.34 also demonstrated a time dependence of EMT reversal by rapamycin. Rapamycin showed a mild protective effect on TGF-β–induced EMT of mesothelial cells at early time points; however, it was not able to inhibit the fibroblast-like phenotypic transformation on day 7 of TGF-β stimulation.34
As a potential mechanism of HG-induced EMT of mesothelium, we investigated the alteration of local expression of antifibrotic factors. Our body has its own protective system against various fibrotic and inflammatory stimuli. One of these defense systems is an expression of antifibrotic peptide. HGF is known to play a crucial role in the repairing process of tissues in a reciprocal manner against TGF-β.35 HGF inhibited the development of interstitial fibrosis in various animal model of renal progression.18 HGF also prevented the thickening of rat peritoneum induced by PD with an amelioration of advanced glycation end product accumulation and a decrease in TGF-β expression.25 A recent study36 also revealed that peritoneal injection of HGF-transfected mesothelial cells in an animal model of encapsulating peritoneal sclerosis improved peritoneal fibrosis. In vitro study using peritoneal mesothelial cells revealed a beneficial effect of HGF on viability and regeneration of cells37; however, there have been no studies regarding whether human peritoneal mesothelial cells express HGF, and each component of dialysis is responsible for an alteration in HGF expression. Our study demonstrated HPMCs constitutively synthesized HGF. More importantly, HG per se decreased HGF production, suggesting a natural antifibrotic mechanism of peritoneum against fibrosis was weakened by HG stimulation. Interestingly, HG-induced EMT was reversed by HGF treatment, suggesting a link between a decreased HGF expression and EMT of HPMCs. Constitutive expression of HGF with a capacity to reverse EMT of mesothelial cells may be one of the mechanisms by which some patients can maintain relatively stable peritoneal function despite a continuous exposure to peritoneal dialysate of an unphysiologic component.
HGF treatment was proved to block TGF-β–induced EMT of renal tubular cells by the mechanism of inducing Smad transcriptional co-repressor SnoN, which interacted with activated Smad-2 by formation of inactive complex.35 Although we did not explore the mechanism of HGF-induced reversal of HG-induced EMT of HPMCs in this study, HG might induce EMT of HPMCs with a decrease in HGF expression by an activation of TGF-β because HG is also a strong inducer of TGF-β expression of HPMCs.7,8
Another important finding of our study is a dosage dependence of the effect of HGF. Blockade of HG-induced EMT was seen at the concentrations of HGF >20 ng/ml, whereas a lower dosage of HGF did not reverse HG-induced EMT. Matsuo et al.24 also reported that an HGF level >30 ng/ml reversed an inhibition of cell proliferation by HG. In experimental renal disease, the therapeutic value of HGF was established at a relatively high dosage of 500 μg/kg per d to 5 mg/kg per d38,39; however, HGF prevented the histologic changes in peritoneum of an animal model of PD at a lower dosage of 4 μg/kg per d, which might be due to direct administration of HGF on targeting tissue by adding to peritoneal dialysate in a rat model of PD.25 An article by Rampino et al.40 showed that a high concentration of HGF (50 ng/ml) caused a fibroblast-like change and a detachment of cells from peritoneal membrane. These findings suggest that an antifibrotic effect of HGF may be dosage dependent with variable therapeutic dosages that depend on experimental conditions, types of animal model, and route of administration.
Another important antifibrotic peptide is BMP-7. BMP-7 is a 35-kD homodimeric protein and member of the TGF-β superfamily. BMP-7 is expressed highest in the kidney and maintains the renal tubular epithelial cells in a mature and functional state by preventing TGF-β–induced disruption of tubular epithelial polarity.41,42 Acute and chronic renal injury was reported to be associated with a decreased BMP-7 expression and a recovery of renal function with normalization of BMP-7 level.43,44 It was also shown repeatedly in various animal models and cell culture systems that BMP-7 treatment delayed progression of chronic renal disease and reversed TGF-β–induced EMT of renal tubular cells45,46; however, there have been few articles about the effect of BMP-7 on mesothelial cells, and our study is the first to identify peritoneal mesothelial cells as a site of BMP-7 synthesis. BMP-7 expression was decreased by HG stimulation as in the case of an HG-induced decrease in HGF production and was normalized with a removal of HG stimulation (data not shown) associated with a reversal of EMT, suggesting a putative role of endogenous BMP-7 on HG-induced EMT. Furthermore, the replacement of BMP-7 was associated with a reversal of HG-induced EMT. In agreement with in vitro findings, adenoviral gene transfer of BMP-7 to peritoneum in an animal model of PD was associated with the additive therapeutic effect on peritoneal fibrosis compared with peritoneal rest. This study is the first to investigate the effect of BMP-7 gene transfer on peritoneal EMT and fibrosis in an animal model of PD. Adv-BMP-7 gene transfer to HPMCs or rat peritoneum resulted in an increased BMP-7 production to 7 d that was not maintained on day 14 after transfection; however, a protective effect on peritoneal EMT and fibrosis was still observed on day 14. Because we did not investigate peritoneal pathology on day 7, it was not clear whether better protection could be observed on day 7. Nonetheless, an early increase in BMP-7 production imposed a beneficial effect on peritoneal fibrosis at later time points. An article by Vargha et al.26 showed that ex vivo treatment of BMP-7 peptide reversed TGF-β1–induced EMT of mesothelial cells from peritoneal effluents of seven children. These findings raised the possibility of therapeutic use of BMP-7 to prevent peritoneal fibrosis in patients with long-term PD.
One of the most interesting observations of our study was the reversibility of peritoneal EMT and fibrosis. Early EMT was reversible with a timely removal of offending stimuli; however, there was also a possible option to reverse EMT even after the development of peritoneal fibrosis. Both in vitro and in vivo data in our study demonstrated antifibrotic peptide treatment along with a removal of HG stimuli (in vitro) or peritoneal rest (in vivo) resulted in a reversal of phenotypic transformation and cell morphology and an amelioration of peritoneal fibrosis, suggesting a decreased production of antifibrotic peptides as a mechanism determining the irreversibility of EMT. This finding offers the novel therapeutic possibility to reverse peritoneal fibrosis with timely and active management.
We did not investigate the protective mechanism of antifibrotic factors in this article, especially related to TGF-β signaling. Considering the previous works from our group and others, alteration in HG-induced upregulation of TGF-β–Smad signaling may be responsible for the effect of antifibrotic peptides.7,19,25,35 The other limitation of this study is that EMT and fibrosis observed in in vivo study can be due to HG per se and/or GDP, although in vitro EMT is not related to GDP in our experiment. Given the consideration of previous data,47 we believe both HG and GDP are responsible for peritoneal damage, which can be reversed with treatment of antifibrotic peptides.
In summary, we observed a reversible EMT by HG per se associated with a decreased expression of antifibrotic cytokines HGF and BMP-7. Both HGF and BMP-7 ameliorated HG-induced EMT of cultured mesothelial cells. BMP-7 gene transfer in an animal model of PD also resulted in an amelioration of EMT and peritoneal thickening. To the best of our knowledge, this article is the first to show the beneficial effect of BMP-7 on reversing EMT in an animal model of PD with a demonstration of de novo synthesis of HGF and BMP-7 of peritoneal mesothelium, which was reduced by HG stimulation.
CONCISE METHODS
Reagents
All chemicals and tissue culture plates were obtained from Sigma-Aldrich Co. (St. Louis, MO) and Nunc Labware (Waltham, MA), unless otherwise stated.
Isolation and Maintenance of HPMCs
HPMCs were isolated using a modified method of previous work from our group.7 Briefly, a piece of human omentum obtained from consenting patients undergoing elective abdominal surgery was washed in PBS and incubated in 0.05% Trypsin–0.02% EDTA solution for 20 min at 37°C with continuous agitation. After incubation, the suspension was centrifuged at 50 × g for five minutes at 4×C, and the cells were cultured in medium 199 containing 10% FBS, 100 U/ml penicillin, 100 μg/ml streptomycin, and 26 mmol/L NaHCO3. Half the medium was exchanged 48 h after seeding; thereafter, the entire medium was replaced once every 3 d. HPMCs were identified by phase-contrast microscopy according to the morphologic criteria and by the immunofluorescence technique.7 All experiments were performed using cells between the second and fourth passages. Tissue collection was approved by the ethics committee of the institution, and informed consent was obtained from each patient.
Exposure of HPMCs to HG
Subconfluent HPMCs grown in culture dish were incubated with serum-free medium for 24 h to arrest and synchronize the cell growth. After this period, the media were changed to fresh serum-free medium 199 containing normal glucose (5.6 mmol/L) or HG (30 to 220 mmol/L) for 48 h to 7 d with an exchange of media every 3 d. Preliminary experiments evaluating a time and a dosage dependence of glucose-induced EMT showed a plateau response at a concentration of 60 mM/L d-glucose (Figure 1) without a significant cell toxicity evaluated by cell morphology and lactate dehydrogenase release (data not shown); therefore, we used 60 mM/L glucose for the rest of the experiment regarding HG-induced EMT. l-Glucose of the same concentration was used as an osmotic control.
Cell Morphology and Immunofluorescence Analysis of HPMCs
Cell morphology was analyzed under an inverted phase-contrast microscope (Axiovert 200; Carl Zeiss, Oberkochen, Germany), and the images were obtained by digital camera (AxioCam HRC; Carl Zeiss). For immunofluorescence staining, cells were washed and fixed in 4% phosphate-buffered paraformaldehyde (25 min at 20°C) and permeabilized with 1% Triton X-100 in PBS (15 min at 4°C). After washing with PBS, the cells were treated with 5% BSA in PBS for 1 h before incubation with primary antibodies specific for pan-cytokeratin (Dako, Carpinteria, CA) or α-SMA (Sigma) in 5% BSA overnight at 4°C. The cells were then washed with 0.2% Tween 20 in PBS before an incubation with goat anti-mouse IgG-FITC–conjugated secondary antibody (Santa Cruz Biotechnology, Santa Cruz, CA) for 1 h at room temperature in the dark. The nucleus was counterstained with DAPI, and the cells were visualized under the Axiovert 200 fluorescence microscope with 10 × 0.3 and 20 × 0.4 NA objectives equipped with AxioCam HRC digital camera. Digital photographs were obtained with Axiovision 4.3 (Carl Zeiss), and merged images were obtained using Photoshop 10 (Adobe Systems, Toronto, Ontario, Canada).
Extraction of Total RNA and Reverse Transcription
After each experiment, total cellular RNA was extracted by TRIZOL and contaminating DNA was removed using DNA-free DNAse. DNA-free RNA was reverse-transcribed into cDNA using the Superscript First Strand Synthesis System (Life Technologies BRL, Carlsbad, CA).
Real-Time PCR
Real-time PCR was performed on the ABI PRISM 7700 Sequence Detection System using SYBR Green I as a double-stranded DNA–specific dye according to the manufacturer's instructions (Applied Biosystems, Foster City, CA). The PCR reaction was carried out in 5 μl of cDNA, 10 μl of SYBR Green PCR master mix, and 5 pM of sense and antisense primers for a final volume of 20 μl per reaction. Primer concentrations were determined by preliminary experiments that analyzed the optimal concentrations of each primer. All primers used in real-time PCR were designed using Primer Express 2.0 software (Applied Biosystems) and checked for homology in BLAST (Table 1). The PCR conditions used were as follows: For E-cadherin, 35 cycles of denaturation at 95°C for 15 s, annealing at 60°C for 30 s, and extension at 72°C for 1 min; for α-SMA and collagen I, 30 cycles of denaturation at 90°C for 20 s, annealing at 60°C for 30 s, and extension at 72°C for 30 s; and for fibronectin and glyceraldehyde-3-phosphate dehydrogenase, 35 cycles of denaturation at 95°C for 30 s, annealing at 60°C for 30 s, and extension at 72°C for 1 min. At the end of each reaction, the melting curve analysis was done in one cycle of 95°C for 30 s and 65°C for 10 s, each with a temperature transition rate of 2°C/min, and then ramping to 95°C. A control without cDNA was run in parallel with each assay. The relative mRNA expression levels of the target genes in each sample were calculated using the comparative CT method. The CT value is the cycle number at which the fluorescence signal is greater than a defined threshold. At least three independent PCR procedures were performed to allow statistical analysis. The amount of PCR products was normalized with housekeeping gene glyceraldehyde-3-phosphate dehydrogenase to determine the relative expression ratios for each mRNA in relation to the control group.
Table 1.
Real-time PCR primer sequence
| Gene Symbol | Accession No. | Forward Primer (5′-3′) | Reverse Primer (5′-3′) |
|---|---|---|---|
| E-cadherin | NM_004360 | ACCCCTGTTGGTGTCTTT | TTCGGGCTTGTTGTCATTCT |
| α-SMA | X13839 | GGGAATGGGACAAAAAGACA | CTTCAGGGGCAACACGAA |
| Fibronectin | X02761 | GTTCGGGAGGAGGTTGTTACC | GAGTCATCTGTAGGCTGGTTTAGG |
| Collagen | BC036531 | CCTGCGTGTACCCCACTCA | ACCAGACATGCCTCTTGTCCTT |
| BMP-7 | X51801 | CAGCCTGCAAGATAGCCATT | AATCGGATCTCTTCCTGCTC |
| HGF | X16323 | CCCCTTCAATAGCATGTCAA | GCTGTGTTCGTGTGGTATCAT |
| GAPDH | M33197 | TGAACGGGAAGCTCACTGG | TCCACCACCCTGTTGCTGTA |
Western Blotting for E-Cadherin, α-SMA, HGF, and BMP-7
Protein samples isolated from cell lysate or whole parietal peritoneal tissue homogenate (30 μg) were mixed in reducing buffer, boiled, resolved on 7.5% SDS-PAGE gels, and transferred to a polyvinylidene difluoride membrane by electroblotting. Membranes were blocked in 5% wt/vol nonfat milk powder in Tris-buffered saline for 30 min at room temperature. Then, blot was incubated overnight in blocking solution with primary antibody at 4°C. Mouse mAb to human E-cadherin (BD Bioscience, Bedford, MA) and human α-SMA (Sigma), rabbit polyclonal human HGF (Santa Cruz Biotechnology), and goat polyclonal human BMP-7 (Santa Cruz Biotechnology) were used. After washing the blot with TBST, blot was incubated with alkaline phosphatase–conjugated secondary antibodies corresponding to each primary antibody and enhanced chemiluminescence detection (Santa Cruz Biotechnology). Positive immunoreactive bands were quantified by densitometry and compared with the expression of human β-actin (Sigma).
ELISA for HGF and BMP-7
HGF or BMP-7 protein production from HPMCs was also evaluated by ELISA (R&D Systems). Experiments were performed in triplicate and verified on four to six occasions. Cells were cultured in six-well plates and incubated with HG for 48 h after complete serum restriction for 24 h. Cell protein concentration was expressed as total BMP-7 or HGF per milligram of cell protein (pg/mg).
Cell Migration and Proliferation Assay
Changes in cell migration as a marker of EMT was assessed using a modified six-well Boyden chamber with 8-μm pore polyvinylpyrrolidone-free polycarbonate membranes (Neuro Probe Inc., Gaithersburg, MD). Filters were immersed overnight in 130 μg/ml matrigel (10 μg/ml; Becton Dickenson, Franklin Lakes, NJ) in PBS at 4°C. HPMCs were seeded onto the top of the transwell filter; when confluent, cells were serum-deprived for 24 h before addition of HG (120 mM) with or without HGF (20 ng/ml; R&D Systems) or BMP-7 (10 ng/ml; R&D Systems) to the lower chamber under serum-free conditions. After 48 h of incubation, the filters were fixed with 3% paraformaldehyde with 1% crystal violet in PBS. The upper surface of the filter was carefully wiped with a cotton-tipped applicator. Cells that passed through the filter pores and attached to the undersurface of the filter were counted at at least four high-power fields (×400). Each sample was assayed in triplicate in four separate experiments.
For the measurement of cell proliferation of HPMCs, MTT uptake assay was used. The cells grown and stimulated with HG for 48 h in a 96-well plate were washed with PBS with addition of 100 μl of 5 mg/ml MTT. After incubation at 37°C for 4 h, the formazan product was generated and subsequently solubilized by the addition of 100 μl of SDS lysis buffer (20% wt/vol SDS, 50% vol/vol dimethylformamide, 2% vol/vol acetic acid, and 0.06% vol/vol hydrochloric acid) at 37°C overnight. The absorbance at 600 nm was read using a 96-well plate reader (Dynex Revelation, Dynex Ltd., Billingshurst, UK).
Treatment with HGF or BMP-7
To evaluate the effect of HGF or BMP-7 on HG-induced EMT, we treated cells with recombinant HGF (approximately 10 to 30 ng/ml) or BMP-7 (approximately 1 to 100 ng/ml) simultaneously with HG or after the removal of HG stimulation.
Construction of Recombinant Adv-BMP-7 Gene
To further investigate the effect of BMP-7 on EMT of mesothelium, we also used Adv-BMP-7 gene. Adv-BMP-7 was provided by Dr. Jae Ryong Kim (Yeungnam University, Daegu, Korea).48 Briefly, human BMP-7 genes were amplified with PCR and cloned into PCR2.1 vector using PCR2.1-ToPo TA cloning kit. Restriction enzymatic analyses and DNA sequencing were used to confirm the accuracy of the PCR2.1-BMP-7. Adv-BMP-7 were produced using AdEasy vector system (Q-BIOgene, Carlsbad, CA). BMP-7 cDNA from PCR2.1-BMP-7 was inserted into the HindIII and XbaI restriction sites of pShuttle-CMV vector. pShuttle/BMP-7 plasmids were linearized with restriction enzyme PmeI and subsequently co-transformed into Escherichia coli with pAdEasy-1 vector using electroporator (Bio-Rad, Hercules, CA). Recombinants were selected for kanamycin resistance. Recombinant plasmids were transfected into the adenovirus packaging cell line HEK293 (American Type Culture Collection, Manassas, VA).
Gene Transfer of BMP-7 to HPMCs
HPMCs were pretreated with 500 μl of serum-free medium containing 10 multiplicity of infection of Adv-lacZ or Adv-BMP-7 for 4 h and then incubated with 1.5 ml of serum-free medium for 24 h. Efficiency of viral infection with a production of BMP-7 was determined by reverse transcription–PCR (RT-PCR) and Western blotting. For RT-PCR, Access RT-PCR system (Promega, Madison, WI) was used to amplify the products. RT-PCR of a single target RNA was performed in a single tube using 50 μl of reaction mixture containing 1 × reaction buffer, deoxynucleoside triphosphate at a concentration of 0.2 mM, 1 μM BMP-7 forward primer, 1 μM BMP-7 reverse primer, 2 mM MgSO4, 0.1 U of avian myeloblastosis virus reverse transcriptase, 0.1 U of Thermus flavus DNA polymerase, and 500 ng of total RNA. Primer sequences for BMP-7 are as follows: Forward TCCGATTCCCTGCCCAAGTG and reverse AGGCCGTCTTCAGTACCCAGG. RT-PCR was performed in a DNA Thermal Cycler 480 (Perkin Elmer Cetus, Norwalk, CT) with one cycle of reverse transcription at 48°C (45 min) followed by one cycle of avian myeloblastosis virus RT inactivation and RNA/complementary DNA/primer denaturation at 94°C (2 min). Subsequent amplification profiles were denaturation at 94°C (30 s), annealing at 55°C (60 s), and extension at 68°C (2 min) for 35 cycles with a final extension at 68°C for 7 min. PCR products were fractionated by 1% agarose gel electrophoresis and stained with 0.5 μg/ml ethidium bromide (Life Technologies BRL, Rockville, MD). The identity of the PCR products was confirmed using a 100-bp ladder (Life Technologies-BRL) as the DNA standard.
Animal Model of PD
A chronic infusion model of animal PD was used as described previously.49 Briefly, 40 male Sprague-Dawley rats (250 to 300 g) were divided into five groups with eight rats each, and permanent PD catheters were inserted: Control group (C), which had catheter without dialysis solution infusion; dialysis group (D), which was infused with 4.25% glucose dialysis solution for 6 wk; rest group (R), which had 2 wk of rest after 4.25% glucose dialysis solution infusion for 6 wk; BMP-7 group (B), which was infused with 4.25% dialysis solution for 6 wk followed by 2 wk of rest after intraperitoneal injection of BMP-7 adenoviral vector (Adv-BMP-7); and LacZ group (L), which had 6 wk of 4.25% dialysis solution infusion with 2 wk of rest after intraperitoneal injection of control adenoviral vector (Adv-LacZ). Groups D, R, B, and L were infused with 25 ml of 4.25% glucose dialysis solution (Dianeal; Baxter Healthcare Ltd., Singapore) two times a day for 6 wk. In groups B and L, the animals received 1 × 10⁹ infectious unit of adenovirus. At the end of 6 wk, the rats in group D were killed, and all other rats of groups C, R, B, and L were killed at 8 wk.
Serial expression of BMP-7 and β-galactosidase after injection of adenoviral vector was evaluated by Western blotting with tissue homogenate and by 5-bromo-4-chloro-3-indolyl-β-D-galactopyranoside (X-gal) staining of abdominal wall, respectively. Adv-LacZ encodes the enzyme β-galactosidase, which can be detected enzymatically using X-gal as a substrate. For X-gal staining, the abdominal wall tissues were incubated with 1 mg/ml X-gal (Amresco, Inc., Solon, OH) for 4 h at 37°C in PBS solution containing 35 mM K3Fe(CN)6, 35 mM K4Fe(CN)6, 2 mM MgCl2, 0.02% NP-40, and 0.01% sodium deoxycholate. The tissues were embedded in graded (10 to 30%) sucrose solution and then OCT solution for frozen section. Subsequently, 5-μm tissue sections were stained with nuclear fast red (Sigma) for routine light microscopic examination.
Morphologic and Immunofluorescence Analyses of Peritoneum
The parietal peritoneum of abdominal wall was fixed with 4% paraformaldehyde (pH 7.4) and embedded in paraffin. The thickness of the peritoneal membrane was measured in tissue sections stained with Masson-Trichrome under light microscopy (×40). The thickness of the submesothelial matrix was measured using the computer program Optimas 6.0 (Optimas Corp., Bothell, WA).
For immunofluorescence microscopy, 3-μm tissue sections were incubated with primary antibodies against cytokeratin (Thermo Fisher Scientific, Fremont, CA) or α-SMA (Abcam, Cambridge, UK) at 4 °C overnight after antigen retrieval in boiling citrate buffer (pH 6.0) for 10 min. Sections were then incubated for 1 h with fluorescein-conjugated secondary antibodies (Alexa Fluor 488 and Alexa Fluor 568; Molecular Probes, Eugene, OR), and slides were mounted with antifade mounting reagent (Molecular Probes). These sections were viewed under a confocal scanning laser microscope using LSM 5 EXCITER (Carl Zeiss).
Statistical Analysis
All data are presented as means ± SD. Differences in the various parameters for each time point and conditions were examined by repeated measure ANOVA. When variance reached statistical significance, the means were analyzed using Kruskal-Wallis ANOVA. Significance was defined as P < 0.05.
DISCLOSURES
None.
Acknowledgments
This work was supported by the Korea Research Foundation Grant funded by the Korean Government (KRF-2007-531-E00033) and by the Korea Science and Engineering Foundation grant funded by the Korea government (R01-2008-000-10845-0).
We thank Dr. Jae Ryong Kim for providing Adv-BMP-7.
Published online ahead of print. Publication date available at www.jasn.org.
REFERENCES
- 1.Davies SJ, Phillips L, Griffiths AM, Russell LH, Naish PF, Russell GI: What really happens to people on long-term peritoneal dialysis? Kidney Int 54: 2207–2217, 1998 [DOI] [PubMed] [Google Scholar]
- 2.Krediet RT: The peritoneal membrane in chronic peritoneal dialysis. Kidney Int 55: 341–356, 1999 [DOI] [PubMed] [Google Scholar]
- 3.Davies SJ, Phillips L, Naish PF, Russell GI: Peritoneal glucose exposure and changes in membrane solute transport with time on peritoneal dialysis. J Am Soc Nephrol 12: 1046–1051, 2001 [DOI] [PubMed] [Google Scholar]
- 4.Holmes CJ, Faict D: Peritoneal dialysis solution biocompatibility: Definitions and evaluation strategies. Kidney Int Suppl 64: S50–S56, 2003 [DOI] [PubMed] [Google Scholar]
- 5.Cendoroglo M, Sundaram S, Jaber BL, Pereira BJ: Effect of glucose concentration, osmolality, and sterilization process of peritoneal dialysis fluids on cytokine production by peripheral blood mononuclear cells and polymorphonuclear cell functions in vitro. Am J Kidney Dis 31: 273–282, 1998 [DOI] [PubMed] [Google Scholar]
- 6.Gotloib L, Waisbrut V, Shostak A, Kushnier R: Acute and long-term changes observed in imprints of mouse mesothelium exposed to glucose-enriched, lactated, buffered dialysis solutions. Nephron 70: 466–477, 1995 [DOI] [PubMed] [Google Scholar]
- 7.Kang DH, Hong YS, Lim HJ, Choi JH, Han DS, Yoon KI: High glucose solution and spent dialysate stimulate the synthesis of transforming growth factor-beta1 of human peritoneal mesothelial cells: Effect of cytokine costimulation. Perit Dial Int 19: 221–230, 1999 [PubMed] [Google Scholar]
- 8.Ha H, Yu MR, Lee HB: High glucose-induced PKC activation mediates TGF-beta 1 and fibronectin synthesis by peritoneal mesothelial cells. Kidney Int 59: 463–470, 2001 [DOI] [PubMed] [Google Scholar]
- 9.Mandl-Weber S, Cohen CD, Haslinger B, Kretzler M, Sitter T: Vascular endothelial growth factor production and regulation in human peritoneal mesothelial cells. Kidney Int 61: 570–578, 2002 [DOI] [PubMed] [Google Scholar]
- 10.Haslinger B, Mandl-Weber S, Sellmayer A, Lederer SR, Sitter T: Effect of high glucose concentration on the synthesis of monocyte chemoattractant protein-1 in human peritoneal mesothelial cells: Involvement of protein kinase C. Nephron 87: 346–351, 2001 [DOI] [PubMed] [Google Scholar]
- 11.Zheng ZH, Ye RG, Bergstrom J, Lindholm B: Effect of dialysate composition on the apoptosis and proliferation of human peritoneal mesothelial cells and protein expression of Fas and c-Myc. Adv Perit Dial 16: 31–35, 2000 [PubMed] [Google Scholar]
- 12.Witowski J, Bender TO, Wisniewska-Elnur J, Ksiazek K, Passlick-Deetjen J, Breborowicz A, Jorres A: Mesothelial toxicity of peritoneal dialysis fluids is related primarily to glucose degradation products, not to glucose per se. Perit Dial Int 23: 381–390, 2003 [PubMed] [Google Scholar]
- 13.Yanez-Mo M, Lara-Pezzi E, Selgas R, Ramirez-Huesca M, Dominguez-Jimenez C, Jimenez-Heffernan JA, Aguilera A, Sanchez-Tomero JA, Bajo MA, Alvarez V, Castro MA, del Peso G, Cirujeda A, Gamallo C, Sanchez-Madrid F, Lopez-Cabrera M: Peritoneal dialysis and epithelial-to-mesenchymal transition of mesothelial cells. N Engl J Med 348: 403–413, 2003 [DOI] [PubMed] [Google Scholar]
- 14.Thiery JP: Epithelial-mesenchymal transitions in development and pathologies. Curr Opin Cell Biol 15: 740–746, 2003 [DOI] [PubMed] [Google Scholar]
- 15.Kalluri R, Neilson EG: Epithelial-mesenchymal transition and its implications for fibrosis. J Clin Invest 112: 1776–1784, 2003 [DOI] [PMC free article] [PubMed] [Google Scholar]
- 16.Savagner P: Leaving the neighborhood: Molecular mechanisms involved during epithelial-mesenchymal transition. Bioessays 23: 912–923, 2001 [DOI] [PubMed] [Google Scholar]
- 17.Boyer B, Valles AM, Edme N: Induction and regulation of epithelial-mesenchymal transitions. Biochem Pharmacol 60: 1091–1099, 2000 [DOI] [PubMed] [Google Scholar]
- 18.Yang J, Liu Y: Blockage of tubular epithelial to myofibroblast transition by hepatocyte growth factor prevents renal interstitial fibrosis. J Am Soc Nephrol 13: 96–107, 2002 [DOI] [PubMed] [Google Scholar]
- 19.Lan HY: Tubular epithelial-myofibroblast transdifferentiation mechanisms in proximal tubule cells. Curr Opin Nephrol Hypertens 12: 25–29, 2003 [DOI] [PubMed] [Google Scholar]
- 20.Michalopoulos G, Houck KA, Dolan ML, Leutteke NC: Control of hepatocyte replication by two serum factors. Cancer Res 44: 4414–4419, 1984 [PubMed] [Google Scholar]
- 21.Mizuno S, Kurosawa T, Matsumoto K, Mizuno-Horikawa Y, Okamoto M, Nakamura T: Hepatocyte growth factor prevents renal fibrosis and dysfunction in a mouse model of chronic renal disease. J Clin Invest 101: 1827–1834, 1998 [DOI] [PMC free article] [PubMed] [Google Scholar]
- 22.Urist MR: Bone: Formation by autoinduction. Science 150: 893–899, 1965 [DOI] [PubMed] [Google Scholar]
- 23.Zeisberg M: Bone morphogenic protein-7 and the kidney: Current concepts and open questions. Nephrol Dial Transplant 21: 568–573, 2006 [DOI] [PubMed] [Google Scholar]
- 24.Matsuo K, Maeda Y, Naiki Y, Matsuoka T, Tamai Y, Yonekawa S, Sakaguchi M, Iwamoto I, Hasegawa H, Matsumoto K, Nakamura T, Kanamaru A: Possible effects of hepatocyte growth factor for the prevention of peritoneal fibrosis. Nephron Exp Nephrol 99: e87–e94, 2005 [DOI] [PubMed] [Google Scholar]
- 25.Nakamura S, Niwa T: Pyridoxal phosphate and hepatocyte growth factor prevent dialysate-induced peritoneal damage. J Am Soc Nephrol 16: 144–150, 2005 [DOI] [PubMed] [Google Scholar]
- 26.Vargha R, Endemann M, Kratochwill K, Riesenhuber A, Wick N, Krachler AM, Malaga-Dieguez L, Aufricht C: Ex vivo reversal of in vivo transdifferentiation in mesothelial cells grown from peritoneal dialysate effluents. Nephrol Dial Transplant 21: 2943–2947, 2006 [DOI] [PubMed] [Google Scholar]
- 27.Aroeira LS, Aguilera A, Sánchez-Tomero JA, Bajo MA, del Peso G, Jiménez-Heffernan JA, Selgas R, López-Cabrera M: Epithelial to mesenchymal transition and peritoneal membrane failure in peritoneal dialysis patients: Pathologic significance and potential therapeutic interventions. J Am Soc Nephrol 18: 2004–2013, 2007 [DOI] [PubMed] [Google Scholar]
- 28.Del Peso G, Jiménez-Heffernan JA, Bajo MA, Aroeira LS, Aguilera A, Fernández-Perpén A, Cirugeda A, Castro MJ, de Gracia R, Sánchez-Villanueva R, Sánchez-Tomero JA, López-Cabrera M, Selgas R: Epithelial-to-mesenchymal transition of mesothelial cells is an early event during peritoneal dialysis and is associated with high peritoneal transport. Kidney Int Suppl 108: S26–S33, 2008 [DOI] [PubMed] [Google Scholar]
- 29.Selgas R, Bajo A, Jimenez-Heffernan JA, Sanchez-Tomero JA, Del Peso G, Aguilera A, Lopez-Cabrera M: Epithelial-to-mesenchymal transition of the mesothelial cell: Its role in the response of the peritoneum to dialysis. Nephrol Dial Transplant 21: ii2–ii7, 2006 [DOI] [PubMed] [Google Scholar]
- 30.Margetts PJ, Bonniaud P, Liu L, Hoff CM, Holmes CJ, West-Mays JA, Kelly MM: Transient overexpression of TGF-β1 induces epithelial mesenchymal transition in the rodent peritoneum. J Am Soc Nephrol 16: 425–436, 2005 [DOI] [PubMed] [Google Scholar]
- 31.Dokic D, Dettman RW: VCAM-1 inhibits TGF-β stimulated epithelial-mesenchymal transformation by modulating Rho activity and stabilizing intercellular adhesion in epicardial mesothelial cells. Dev Biol 299: 489–504, 2006 [DOI] [PubMed] [Google Scholar]
- 32.Yang AH, Chen JY, Lin JK: Myofibroblastic conversion of mesothelial cells. Kidney Int 63: 1530–1539, 2003 [DOI] [PubMed] [Google Scholar]
- 33.Pollock C: Pathogenesis of peritoneal sclerosis. Int J Artif Organs 28: 90–96, 2005 [DOI] [PubMed] [Google Scholar]
- 34.Aguilera A, Aroeira LS, Ramirez-Huesca M, Perez-Lozano ML, Cirugeda A, Bajo MA, Del Peso G, Valenzuela-Fernandez A, Sanchez- Tomero JA, Lopez-Cabrera M, Selgas R: Effects of rapamycin on the epithelial-to-mesenchymal transition of human peritoneal mesothelial cells. Int J Artif Organs 28: 164–169, 2005 [DOI] [PubMed] [Google Scholar]
- 35.Yang J, Dai C, Liu Y: A novel mechanism by which hepatocyte growth factor blocks tubular epithelial to mesenchymal transition. J Am Soc Nephrol 16: 68–78, 2005 [DOI] [PubMed] [Google Scholar]
- 36.Matsuoka T, Maeda Y, Matsuo K, Naiki Y, Tamai Y, Sakaguchi M, Hasegawa H, Funauchi M, Kanamaru A: Hepatocyte growth factor prevents peritoneal fibrosis in an animal model of encapsulating peritoneal sclerosis. J Nephrol 21: 64–73, 2008 [PubMed] [Google Scholar]
- 37.Naiki Y, Matsuo K, Matsuoka T, Maeda Y: Possible role of hepatocyte growth factor in regeneration of human peritoneal mesothelial cells. Int J Artif Organs 28: 141–149, 2005 [DOI] [PubMed] [Google Scholar]
- 38.Mizuno S, Matsumoto K, Nakamura T: Hepatocyte growth factor suppresses interstitial fibrosis in a mouse model of obstructive nephropathy. Kidney Int 59: 1304–1314, 2001 [DOI] [PubMed] [Google Scholar]
- 39.Inoue T, Okada H, Kobayashi T, Watanabe Y, Kanno Y, Kopp JB, Nishida T, Takigawa M, Ueno M, Nakamura T, Suzuki H: Hepatocyte growth factor counteracts transforming growth factor-1, through attenuation of connective tissue growth factor induction, and prevents renal fibrogenesis in 5/6 nephrectomized mice. FASEB J 17: 268–270, 2003 [DOI] [PubMed] [Google Scholar]
- 40.Rampino T, Cancarini G, Gregorini M, Guallini P, Maggio M, Ranghino A, Soccio G, Dal Canton A: Hepatocyte growth factor/scatter factor released during peritonitis is active on mesothelial cells. Am J Pathol 159: 1275–1285, 2001 [DOI] [PMC free article] [PubMed] [Google Scholar]
- 41.Patel SR, Dressler GR: BMP7 signaling in renal development and disease. Trends Mol Med 11: 512–518, 2005 [DOI] [PubMed] [Google Scholar]
- 42.Gould SE, Day M, Jones SS, Dorai H: BMP-7 regulates chemokine, cytokine, and hemodynamic gene expression in proximal tubule cells. Kidney Int 61: 51–60, 2002 [DOI] [PubMed] [Google Scholar]
- 43.Klahr S, Morrissey J, Hruska K, Wang S, Chen Q: New approaches to delay the progression of chronic renal failure. Kidney Int Suppl 80: 23–26, 2002 [DOI] [PubMed] [Google Scholar]
- 44.Simon M, Maresh JG, Harris SE, Hernandez JD, Arar M, Olson MS, Abboud HE: Expression of bone morphogenetic protein-7 mRNA in normal and ischemic adult rat kidney. Am J Physiol 276: F382–F389, 1999 [DOI] [PubMed] [Google Scholar]
- 45.Vukicevic S, Basic V, Rogic D, Basic N, Shih MS, Shepard A, Jin D, Dattatreyamurty B, Jones W, Dorai H, Ryan S, Griffiths D, Maliakal J, Jelic M, Pastorcic M, Stavljenic A, Sampath TK: Osteogenic protein-1 (bone morphogenetic protein-7) reduces severity of injury after ischemic acute renal failure in rat. J Clin Invest 102: 202–214, 1998 [DOI] [PMC free article] [PubMed] [Google Scholar]
- 46.Hruska KA, Guo G, Wozniak M, Martin D, Miller S, Liapis H, Loveday K, Klahr S, Sampath TK, Morrissey J: Osteogenic protein-1 prevents renal fibrogenesis associated with ureteral obstruction. Am J Physiol Renal Physiol 279: F130–F143, 2000 [DOI] [PubMed] [Google Scholar]
- 47.Do JY, Kim YL, Park JW, Cho KH, Kim TW, Yoon KW, Kim CD, Park SH, Han JH, Song IH: The effect of low glucose degradation product dialysis solution on epithelial-to-mesenchymal transition in continuous ambulatory peritoneal dialysis patients. Perit Dial Int 25[Suppl 3]: S22–S25, 2005 [PubMed] [Google Scholar]
- 48.Jang WS, Kim JR, Sohn WJ, Seo JS, Ahn MW, Jang YS, Kim HK, Kim JR: Osteoinduction using recombinant bone morphogenic protein-7 gene. J Korean Orthop Assoc 39: 598–606, 2004 [Google Scholar]
- 49.Park SH, Lee EG, Kim IS, Kim YJ, Cho DK, Kim YL: Effect of glucose degradation products on the peritoneal membrane in a chronic inflammatory infusion model of peritoneal dialysis in the rat. Perit Dial Int 24: 115–122, 2004 [PubMed] [Google Scholar]


