Abstract
Left ventricular hypertrophy (LVH) is associated with electric remodeling and increased arrhythmia risk, although the underlying mechanisms are poorly understood. In the experiments here, functional voltage-gated (Kv) and inwardly rectifying (Kir) K+ channel remodeling was examined in a mouse model of pressure overload–induced LVH, produced by transverse aortic constriction (TAC). Action potential durations (APDs) at 90% repolarization in TAC LV myocytes and QTc intervals in TAC mice were prolonged. Mean whole-cell membrane capacitance (Cm) was higher, and Ito,f, IK,slow, Iss, and IK1 densities were lower in TAC, than in sham, LV myocytes. Although the primary determinant of the reduced current densities is the increase in Cm, IK,slow amplitudes were decreased and Iss amplitudes were increased in TAC LV cells. Further experiments revealed regional differences in the effects of LVH. Cellular hypertrophy and increased Iss amplitudes were more pronounced in TAC endocardial LV cells, whereas IK,slow amplitudes were selectively reduced in TAC epicardial LV cells. Consistent with the similarities in Ito,f and IK1 amplitudes, Kv4.2, Kv4.3, and KChIP2 (Ito,f), as well as Kir2.1 and Kir2.2 (IK1), transcript and protein expression levels were similar in TAC and sham LV. Unexpectedly, expression of IK,slow channel subunits Kv1.5 and Kv2.1 was increased in TAC LV. Biochemical experiments also demonstrated that, although total protein was unaltered, cell surface expression of TASK1 was increased in TAC LV. Functional changes in repolarizing K+ currents with LVH, therefore, result from distinct cellular (cardiomyocyte enlargement) and molecular (alterations in the numbers of functional channels) mechanisms.
Keywords: hypertrophy, arrhythmia, heart failure
Left ventricular hypertrophy (LVH) is an adaptive response of the myocardium to an increase in load.1 LVH is seen in various disease states including hypertension and myocardial infarction, as well as in valvular and congenital heart diseases.1 LVH is also observed in physiological states following rigorous, prolonged exercise.2 Although physiological LVH does not confer increased morbidity and mortality, pathological LVH is consistently associated with prolongation of ventricular action potentials and alterations in the dispersion of repolarization, both of which result in electric instability and increase the propensity to develop life-threatening arrhythmias.3 Several lines of evidence suggest that these electric changes reflect, at least in part, alterations in the functioning of the K+ channels that underlie ventricular action potential repolarization.3,4
Various experimental models of LVH,5–7 including pressure overload–induced LVH,8,9 have been developed to explore the mechanisms underlying K+ current remodeling. Although several studies have examined regional differences in remodeling,8–11 few have probed the underlying molecular and cellular mechanisms. In the studies here, a mouse model of pressure overload–induced LVH, produced by transverse aortic constriction (TAC), was exploited to quantify the effects of LVH on repolarizing K+ currents in LV myocytes and to delineate the mechanisms underlying K+ current remodeling. These experiments revealed that APDs were prolonged in TAC LV myocytes and that QTc intervals were increased in TAC mice. Mean whole-cell membrane capacitance (Cm) was increased significantly, and the densities of voltage-gated K+ (Kv) and inwardly rectifying K+ (Kir) currents were reduced in TAC LV myocytes. Further electrophysiological, molecular, and biochemical analyses revealed marked regional differences in the effects of LVH and that distinct cellular and molecular mechanisms contribute to the functional remodeling of repolarizing Kv and Kir currents.
Materials and Methods
Animals were handled in accordance with the Guide for the Care and Use of Laboratory Animals (NIH). Detailed methods are provided in the online data supplement at http://circres.ahajournals.org.
Induction of LVH
Pressure overload–induced LVH was produced in adult mice by TAC.12 Sham-operated animals underwent surgery but without aortic constriction. Seven days after surgery, echocardiographic images were acquired and analyzed using described methods.12,13
Electrophysiological Recordings
Electrocardiographic (ECG) recordings were obtained from anesthetized mice.14 Myocytes were isolated from the LV (and RV), as well as from the epicardial (EPI) and endocardial (ENDO) LV surfaces, of sham and TAC hearts by enzymatic dissociation and mechanical dispersion using described methods.15 Whole-cell membrane currents and action potentials were measured as previously described.15
Quantitative RT-PCR
Total RNA from RV, LV, EPI, and ENDO was isolated and DNase treated using described methods.16 RNA concentrations were determined by optical density measurements. TaqMan low-density arrays (Applied Biosystems) were used in a 2-step RT-PCR process as described previously.16 The 96 genes selected for quantification (supplemental Table I) encode 68 ion channel α, β, and regulatory subunits; 11 Ca2+ homeostasis regulators; 6 transcription factors; 7 markers of vessels, neurons, fibroblasts, inflammation, and hypertrophy; and 4 controls.17 Data were analyzed using the threshold cycle relative quantification method, with hypoxanthine guanine phosphoribosyl transferase (HPRT) as the endogenous control. Because hypertrophy is associated with a generalized increase in transcript and protein content without an increase in cell numbers,18 transcript expression data determined in each sham and TAC (LV, EPI and ENDO) sample were multiplied by the LV mass to body weight ratio (LVM/BW) determined in the same animal.
The expression of genes encoding atrial natriuretic factor (ANF), β-myosin heavy chain (β-MHC), and the 2-pore domain K+ (K2P) channel subunits TASK1, TASK2, and TREK1 was determined by SYBR green quantitative RT-PCR using sequence specific primers. Expression data were normalized to HPRT and to the measured LVM/BW.
Biochemical Analyses
Protein lysates were prepared from sham and TAC LV, EPI, and ENDO using described methods.19 Biotinylation of isolated LV myocytes was used to examine cell surface protein expression. Protein quantification was performed with the BCA Protein Assay Kit (Pierce). Proteins were loaded on SDS-PAGE gels in amounts proportional to the relative LVM/BW in TAC and sham mice.
Statistics
Results are expressed as means±SEM. Statistical analyses were performed using the Student’s t test. Multiple regression analysis was used to determine the significance of regional (EPI/ENDO) differences.
Results
Pressure Overload–Induced LVH
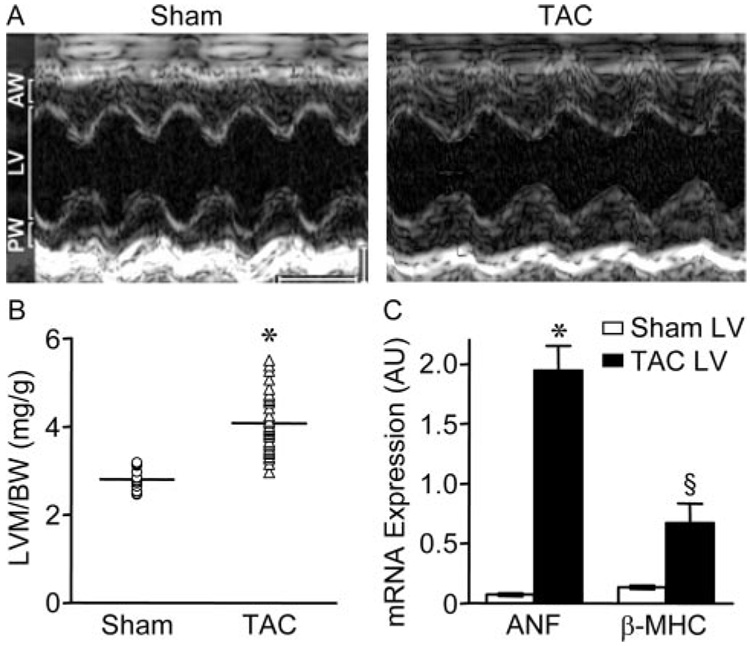
Preliminary echocardiographic experiments revealed that the extent/severity of LVH did not vary appreciably in mice examined 7 days to 3 months after TAC (not shown). Experiments here, therefore, were completed 7 days following surgery. Reduced chamber volume and increased anterior and posterior wall thicknesses were observed in echocardio-graphic 2D short axis cine loops of the LV in TAC mice (Figure 1A). M-mode based LV mass measurements revealed that mean±SEM LVM/BW was significantly (P<0.001) higher in TAC (4.07±0.1 mg/g, n=39), than in sham (2.8±0.06 mg/g, n=18), mice (Figure 1B and supplemental Table II). In addition, the mean±SEM E/A wave ratio was significantly (P<0.05) larger in TAC animals (supplemental Table II), consistent with diastolic dysfunction.13 Fractional shortening, however, was similar (supplemental Table II), and there was no evidence of altered systolic function or heart failure in TAC animals.
Figure 1. Detection of LVH 7 days after TAC.
A, Representative echocardiographic M-mode images of sham and TAC LV. Scale bars are 1 mm and 100 ms. AW and PW designate anterior and posterior wall thicknesses, respectively. B, LVM/BW in sham (n=18) and TAC (n=39) mice; individual values and means±SEM are plotted. *P<0.001. C, Mean±SEM mRNA expression levels (arbitrary units) of the hypertrophy markers ANF and β-MHC are significantly (*P<0.001; §P<0.05) higher in TAC (n=6) than in sham (n=6) LV.
SYBR green quantitative RT-PCR revealed that expression of the hypertrophy markers2 ANF (P<0.001) and β-MHC (P<0.05) was increased significantly in TAC, compared with sham, LV (Figure 1C), consistent with the presence of pathological LVH.
K+ Current Remodeling in TAC LV Myocytes
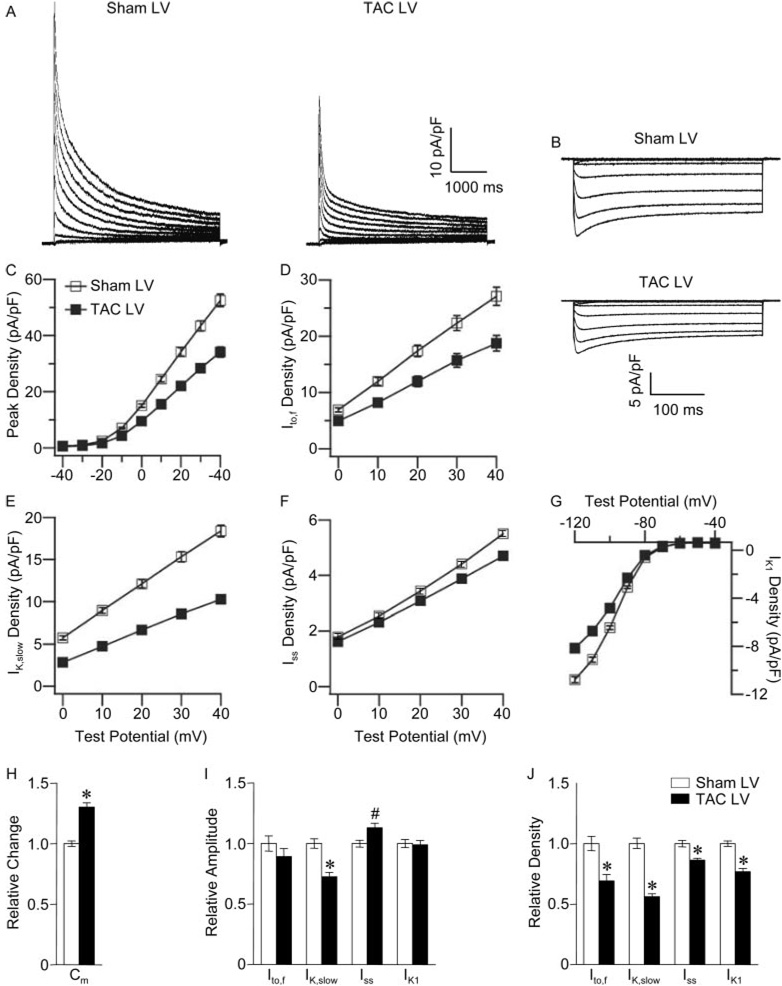
Whole-cell recordings revealed that mean±SEM Cm was significantly (P<0.001) higher in TAC, than in sham, LV myocytes (Table). Consistent with the increased Cm, peak Kv current (Figure 2A and 2C) and IK1 (Figure 2B and 2G) densities were significantly (P<0.001) lower in TAC LV cells (Table). The decay phases of the Kv currents in adult wild-type mouse ventricular myocytes are best described by the sum of 2 exponentials, reflecting the inactivating currents Ito,f and IK,slow and a noninactivating current, Iss.15 Kinetic analyses of the currents revealed that mean±SEM Ito,f (Figure 2D), IK,slow (Figure 2E), and Iss (Figure 2F) densities were significantly (P<0.001) lower in TAC, than in sham, LV myocytes (Table). Mean±SEM Ito,f and IK1 amplitudes in TAC and sham LV myocytes, however, were indistinguishable (Figure 2I), suggesting that the reductions in Ito,f and IK1 densities (Figure 2J) reflect only the increase in Cm (Figure 2H). In contrast, mean±SEM IK,slow amplitude was significantly (P<0.001) smaller and mean±SEM Iss amplitude was significantly (P<0.01) larger in TAC, than in sham, LV myocytes (Figure 2I). The increase in Iss amplitude, however, was not enough to offset the increase in Cm, and Iss density was decreased (Figure 2J). There were no differences in the kinetics or voltage dependences of the Kv currents in TAC and sham LV myocytes, and no significant differences in Cm or current amplitudes/densities in TAC and sham RV myocytes were observed (Table).
Table.
Kv and Kir Currents in Sham and TAC LV, RV, EPI, and ENDO Myocytes
| Cells | Cm | Ipeak | Ito,f | IK,slow | Iss | IK1 |
|---|---|---|---|---|---|---|
| Sham | ||||||
| LV | 132±3 | |||||
| τd | 84±3 | 1281±23 | ||||
| pA | 6849±306 | 3533±219 | 2408±96 | 714±20 | −1474±48 | |
| pA/pF | 52.5±2.2 | 27.1±1.6 | 18.4±0.7 | 5.5±0.1 | −11.2±0.2 | |
| n | 73 | 60 | ||||
| RV | 130±5 | |||||
| τd | 74±3 | 1155±28 | ||||
| pA | 8909±607 | 5087±417 | 2702±157 | 690±33 | −1618±75 | |
| pA/pF | 68.3±3.8 | 38.9±2.8 | 20.7±0.9 | 5.3±0.1 | −12.6±0.5 | |
| n | 35 | 26 | ||||
| EPI | 138±7 | |||||
| τd | 87±5 | 1191±40 | ||||
| pA | 8393±519 | 4105±308 | 3031±193 | 787±49 | −1427±105 | |
| pA/pF | 61.6±3.2 | 30.2±2.2 | 22.3±1.3 | 5.7±0.2 | −10.4±0.5 | |
| n | 13 | 13 | ||||
| ENDO | 131±10 | |||||
| τd | 89±13 | 1434±51 | ||||
| pA | 5131±469 | 2335±203 | 2010±214 | 686±62 | −1579±110 | |
| pA/pF | 39.8±2.3 | 18.3±1.3 | 15.3±0.9 | 5.3±0.3 | −12.4±0.6 | |
| n | 16 | 16 | ||||
| TAC | ||||||
| LV | 172±5* | |||||
| τd | 82±2 | 1553±39 | ||||
| pA | 5744±314§ | 3149±235 | 1747±83* | 807±26# | −1459±50 | |
| pA/pF | 34.1±1.8* | 18.8±1.4* | 10.4±0.4* | 4.7±0.1* | −8.6±0.3* | |
| n | 70 | 57 | ||||
| RV | 122±5 | |||||
| τd | 66.4±2 | 1286±39 | ||||
| pA | 7123±570 | 4406±386 | 1858±150 | 662±38 | −1398±155 | |
| pA/pF | 58.4±4.1 | 36.1±2.7 | 15.2±1.1 | 5.4±0.2 | −11.4±1 | |
| n | 21 | 12 | ||||
| EPI | 177±9# | |||||
| τd | 56±2 | 1596±53 | ||||
| pA | 5754±471*b | 3684±354 | 1167±107*a | 802±57 | −1310±88 | |
| pA/pF | 32.9±2.4*b | 21.1±1.9# | 6.7±0.6*a | 4.6±0.3# | −7.1±0.4* | |
| n | 23 | 21 | ||||
| ENDO | 215±11*a | |||||
| τd | 70±3 | 1626±74 | ||||
| pA | 5642±584 | 2719±369 | 1856±182 | 1039±73*a | −1720±99 | |
| pA/pF | 26.8±2.5* | 13.2±1.7§ | 8.7±0.8* | 4.8±0.2 | −7.9±0.4* | |
| n | 18 | 19 |
All values are means±SEM. Cm, τ decay (τd), amplitude, and density values are expressed in pF, ms, pA, and pA/pF, respectively. Kv and Kir densities were determined at +40 and −120 mV (HP=−70 mV), respectively.
Values were compared in TAC and sham LV myocytes, in TAC and sham EPI myocytes, or in TAC and sham ENDO myocytes, and *P<0.001 #P<0.01, §P<0.05 values are indicated.
Impact of LVH is significantly (aP<0.05, bP<0.01) different in EPI and ENDO myocytes.
Figure 2. Alterations in repolarizing K+ currents in TAC LV myocytes.
Representative whole-cell Kv currents (A), evoked during 4.5-second voltage steps to potentials between −40 and +40 mV from a holding potential (HP) of −70 mV, and Kir currents (B), evoked during 350-ms voltage steps to potentials between −40 and −120 mV (HP=−70 mV) in sham and TAC LV cells. Mean±SEM Ipeak (C), Ito,f (D), IK,slow (E), Iss (F), and IK1 (G) densities in sham and TAC LV myocytes are plotted as a function of test potential. Relative changes in Cm (H), current amplitudes (I), and densities (J) in TAC compared with sham LV myocytes. Values in TAC and sham LV myocytes are significantly (*P<0.001, #P<0.01) different.
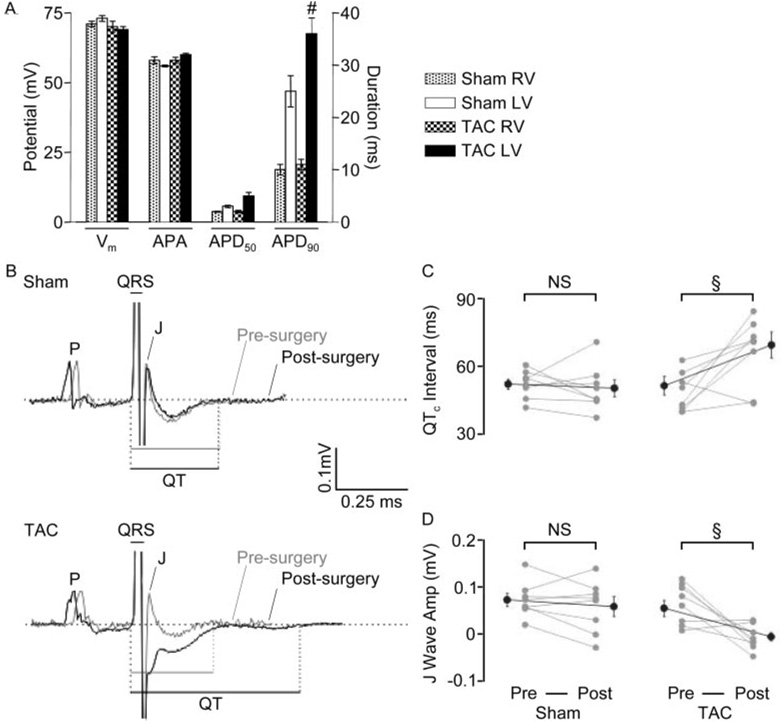
APDs at 90% repolarization (APD90) were significantly (P<0.01) longer in TAC, than in sham, LV myocytes, whereas resting membrane potentials and action potential amplitudes were not significantly different (Figure 3A and supplemental Table III). To assess the functional consequences of reduced K+ current densities and action potential prolongation, ECGs were obtained from anesthetized sham and TAC mice before and after surgery. Analysis of ECG recordings revealed significantly (P<0.05) longer QT and corrected QT (QTc) intervals in TAC, compared with sham, mice (Figure 3B and 3C and supplemental Table IV). In addition, the J wave, corresponding to the early repolarization phase of murine ventricular action potentials,20 was significantly (P<0.05) flattened or inverted (Figure 3B and 3D and supplemental Table IV), suggesting that the dispersion of ventricular repolarization is altered in TAC LV.
Figure 3. Action potential and surface ECG abnormalities with TAC.
A, Mean±SEM resting membrane potentials (Vm), action potential amplitudes (APA), and durations at 50% (APD50) and 90% (APD90) repolarization in sham and TAC RV and LV myocytes. APD90 values are significantly (#P<0.01) longer in TAC LV cells (supplemental Table III). B, Representative lead II ECGs from anesthetized sham and TAC mice before and after surgery. QTc interval durations (C) and J wave amplitudes (D) in sham (n=8) and TAC (n=8) mice before and after surgery; individual values and means±SEM are plotted (§P<0.05).
Regional Differences in the Effects of TAC-Induced LVH on K+ Currents
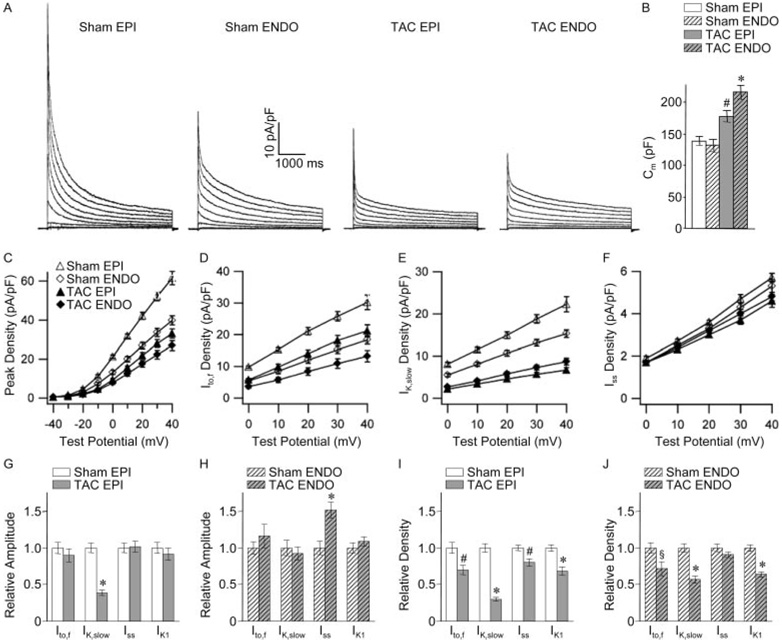
Regional differences in the remodeling of LV K+ currents would be expected to alter the dispersion of ventricular repolarization.8–11 Subsequent experiments focused, therefore, on investigating the effects of LVH on repolarizing K+ currents in cells isolated from the EPI and ENDO surfaces of the LV wall. As previously reported in wild-type cells,15 mean±SEM Ipeak (Figure 4A and 4C), Ito,f (Figure 4D), and IK,slow (Figure 4E) densities were significantly (P<0.001) higher in sham EPI, than ENDO, LV myocytes (Table). Regional differences in current densities15 have been suggested to contribute to the native transmural repolarization gradient.21
Figure 4. Regional (EPI/ENDO) differences in the effects of LVH on repolarizing K+ currents and Cm.
A, Representative Kv currents recorded, as described in the legend to Figure 2, from sham and TAC EPI and ENDO LV myocytes. B, Cm in sham and TAC EPI and ENDO cells. Mean±SEM Ipeak (C), Ito,f (D), IK,slow (E), and Iss (F) densities in sham and TAC EPI and ENDO LV myocytes are plotted as a function of test potential. Relative changes in current amplitudes (G and H) and densities (I and J) in TAC, compared with sham, EPI (G and I) and ENDO (H and J) LV myocytes. Indicated values in TAC and sham myocytes are significantly (*P<0.001, #P<0.01, §P<0.05) different.
There were also marked regional differences in the cellular effects of LVH. The reduction in Ipeak densities was more pronounced in TAC EPI, than ENDO, LV myocytes in spite of the fact that mean±SEM Cm was higher in TAC ENDO cells (Figure 4A through 4C and the Table). In addition, mean±SEM Ipeak and IK,slow amplitudes were reduced significantly (P<0.001) in TAC EPI (Figure 4G), but not in TAC ENDO (Figure 4H), LV myocytes. Mean±SEM Iss amplitude, in contrast, was increased significantly (P<0.001) in TAC ENDO (Figure 4H), but not EPI (Figure 4G), LV myocytes, and, as a result, Iss density was decreased in TAC EPI (Figure 4I), but not ENDO (Figure 4J), cells. Similar to results obtained in myocytes dispersed from whole LV, the reduced Ito,f and IK1 densities in TAC EPI and ENDO myocytes (Figure 4I and 4J) appear to reflect only cellular hypertrophy (increased Cm), because no changes in Ito,f or IK1 amplitudes were observed in EPI or ENDO cells (Figure 4G and 4H).
Molecular Basis of K+ Current Remodeling in TAC LV
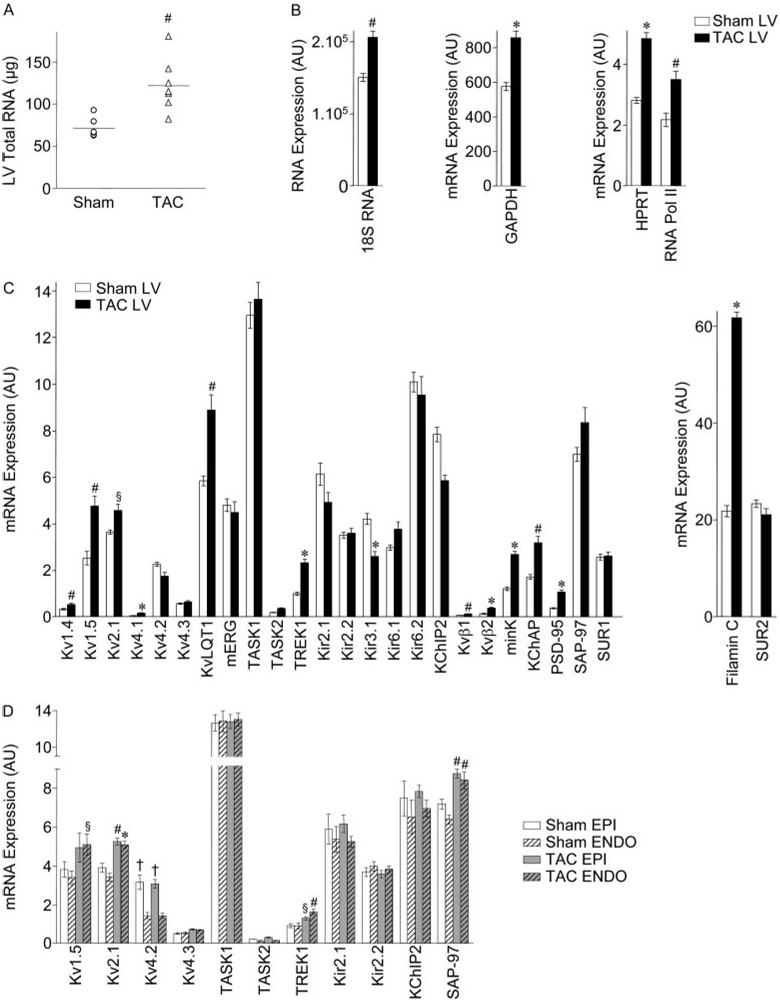
Subsequent experiments examined the impact of TAC-induced LVH on the transcript and protein expression levels of several channel pore-forming (α) and accessory (β) subunits encoding murine myocardial K+ channels.14,19,22–24 Because accumulating evidence suggests that cardiac ion channels function as components of macromolecular complexes,25 TaqMan low-density arrays16 were exploited to allow quantitative determinations of multiple transcripts simultaneously. The amount of total RNA isolated from TAC LV was significantly (P<0.01) higher (1.7-fold on average) than from sham LV (Figure 5A). This observation is consistent with previous findings demonstrating that RNA synthesis/content in the LV is increased with hypertrophy, reflecting increased myocyte size, without an increase in myocyte number.18 Transcript expression levels determined by quantitative RT-PCR on sham and TAC LV, and on EPI and ENDO LV, samples were, therefore, normalized to the LVM/BW determined in each animal. Consistent with the increase in total RNA, expression of several endogenous control genes (18S RNA, GAPDH, HPRT, RNA polymerase II [RNA Pol II])17 was increased in TAC, compared with sham, LV (Figure 5B).
Figure 5. Transcript expression profiling in TAC and sham LV.
A, Total RNA content in sham (n=6) and TAC (n=8) LV; individual values and means±SEM are plotted (#P<0.01). Mean±SEM RNA expression levels (arbitrary units) of control (B) and K+ channel subunit and regulatory (C) genes in sham and TAC LV and of K+ channel subunit and regulatory genes in sham and TAC EPI and ENDO LV (D) (n=6 mice in each group). Indicated values are significantly (*P<0.001, #P<0.01, §P<0.05) different in TAC and sham LV and in EPI versus ENDO (†P<0.001) samples.
In contrast with the global increases in transcript expression with hypertrophy, transcript expression of the Ito,f channel α subunits Kv4.2 (KCND2) and Kv4.3 (KCND3)19,24 was not significantly different in TAC and sham LV, and expression of the Ito,f channel accessory subunit KChIP2 (KCNIP2)24 was actually slightly lower in TAC LV (Figure 5C). The expression of transcripts encoding IK1 channel α subunits Kir2.1 (KCNJ2) and Kir2.2 (KCNJ12),23 and of the K2P channel subunit TASK1 (KCNK3), which has been suggested to underlie Iss in rat cardiomyocytes,26 as well as TASK2 (KCNK5), was unaffected in TAC LV (Figure 5C). In contrast, expression of the transcripts encoding IK,slow1 and IK,slow2 channels Kv1.5 (KCNA5) and Kv2.1 (KCNB1),14,22 as well as of the K2P channel subunit TREK1 (KCNK2), was increased in TAC LV (Figure 5C). The expression levels of several other Kv α subunits Kv1.4 (KCNA4), Kv4.1 (KCND1), and KvLQT1 (KCNQ1), as well as a number of K+ channel regulatory proteins including Kvβ1 (KCNAB1), Kvβ2 (KCNAB2), minK (KCNE1), KChAP (Pias3), PSD-95 (post-synaptic density 95 protein), and filamin C, were also increased in TAC LV (Figure 5C).
Analyses of transcript expression in EPI and ENDO LV samples from sham and TAC animals revealed no regional differences in remodeling. As in wild-type LV,15 KCND2 expression was significantly (P<0.001) higher in sham EPI, than ENDO, LV (Figure 5D). This gradient was maintained in TAC LV, and expression of KCND3 and KCNIP2, as well as KCNJ2 and KCNJ12, transcripts was also similar in TAC EPI and ENDO (Figure 5D), consistent with the similarities in Ito,f and IK1 amplitudes in TAC and sham EPI and ENDO LV myocytes (Figure 4). The transcript expression levels of Kv1.5, Kv2.1, and TREK1, as well as SAP-97, which has been postulated to play a role in Kv1.5 trafficking,27 were increased similarly in TAC EPI and ENDO LV (Figure 5D).
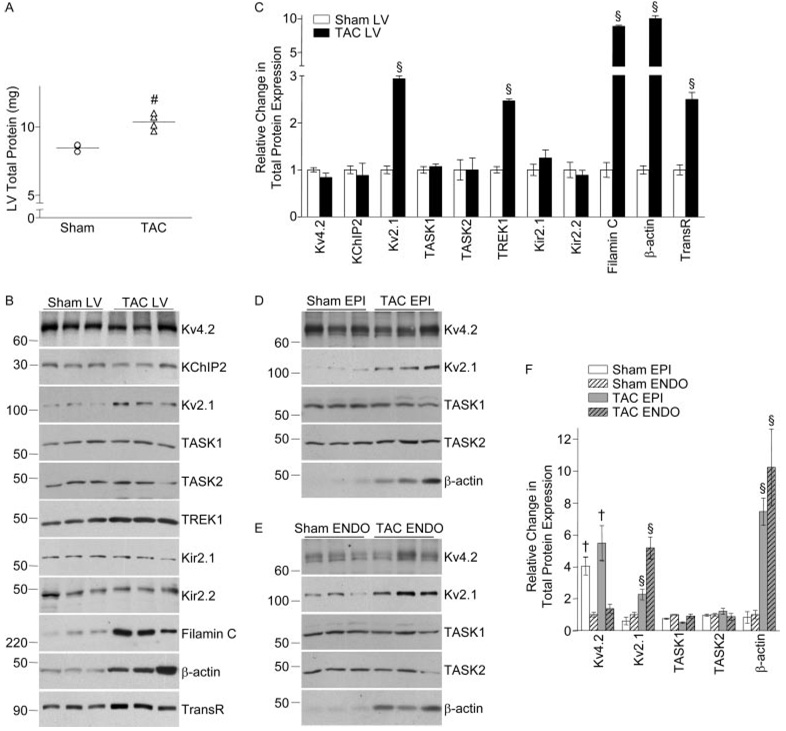
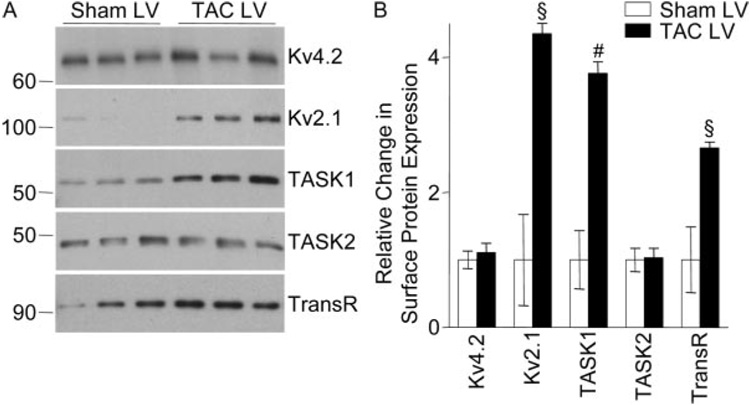
Western blot experiments were performed to determine the (total and/or cell surface) expression levels of several Kv channel subunit and regulatory proteins. Similar to the RNA data and in accordance with previous reports,18 total LV protein content was significantly (P<0.01) higher (1.2-fold on average) in TAC, compared with sham, LV (Figure 6A). To compare protein expression in sham and TAC LV and in sham and TAC EPI and ENDO LV samples, therefore, protein loading on SDS-PAGE gels was normalized to reflect the LVM/BW. Consistent with the global increase in protein content (Figure 6A), expression of the endogenous (transferrin receptor17) control protein, as well as the structural proteins filamin C and β-actin, was increased significantly (P<0.05) in TAC, compared with sham, LV (Figure 6B and 6C). Consistent with the transcript data (Figure 5), however, no significant differences in the expression levels of the Ito,f (Kv4.2, KChIP2) or IK1 (Kir2.1, Kir2.2) channel subunit proteins were observed in TAC and sham LV (Figure 6B and 6C). Further experiments revealed no regional differences in the impact of LVH: Kv2.1 and β-actin expression were increased in both TAC EPI and ENDO LV, whereas Kv4.2, TASK1, and TASK2 expression were unaffected (Figure 6D through 6F). Cell surface Kv2.1 expression was also increased in TAC LV (Figure 7). Interestingly, however, although total TASK1 protein expression was unchanged (Figure 6), cell surface TASK1 expression was markedly increased in TAC, compared with sham, LV myocytes (Figure 7), in parallel with the increase in Iss amplitude (Figure 2).
Figure 6. Protein expression in TAC and sham LV.
A, Total protein content in sham (n=3) and TAC (n=4) LV; individual values and means±SEM are plotted (#P<0.01). Representative Western blots of total protein expression of K+ channel subunits, as well as of the control proteins, transferrin receptor (TransR), β-actin, and filamin C, in sham and TAC LV (B), EPI (D), and ENDO (E). Quantification of relative differences in total protein expression in sham and TAC total LV (C) and in sham and TAC EPI and ENDO LV (F). Data are means±SEM (n=3 to 6), and indicated values are significantly (§P<0.05) different in TAC and sham LV or TAC and sham EPI or ENDO LV. As in wild-type LV,15 Kv4.2 expression is higher (†P<0.01) in (sham and TAC) EPI than ENDO LV.
Figure 7. Cell surface protein expression in TAC and sham LV.
A, Representative Western blots of cell surface expression of K+ channel subunit and the control (TransR) proteins in sham and TAC LV. B, Quantification of relative differences in cell surface protein expression in sham and TAC LV. Data are means±SEM (n=3 to 6), and expression levels are significantly (#P<0.01, §P<0.05) different in TAC and sham LV.
Discussion
LVH in TAC Mice
The experiments here revealed that pathological LVH is clearly evident in TAC mice 7 days following surgery. In parallel with the increase in LVM/BW, mean LV myocyte size, as determined by Cm measurements, was increased with TAC, in agreement with previous reports.8,28 In contrast to these earlier reports, however, there was no evidence that mean LVM/BW or myocyte size continued to increase at longer times (up to 3 months) after TAC. Also, in contrast to the effects on LV cells, there were no differences in mean Cm in TAC and sham RV cells, demonstrating that the cellular hypertrophy is specific for the LV.
Alterations in Repolarizing Kv and Kir Currents in TAC LV Myocytes
Kv current and IK1 densities were markedly lower, and action potentials were prolonged in TAC, compared with sham, LV myocytes. In addition, QTc intervals were increased in TAC mice. Reduced Kv current densities and action potential prolongation are consistent findings in experimental LVH models3–9,11 and in failing human hearts.10,29 The analyses completed here, however, revealed that cellular hypertrophy (increased Cm) is the main factor in determining reductions in Ito,f and IK1 densities, because the mean amplitudes of these currents in TAC and sham LV cells were not significantly different. In contrast, mean IK,slow and Iss amplitudes were altered in TAC LV myocytes, suggesting that functional IK,slow and Iss channel expression is modulated with LVH.
Regional Differences in the Effects of TAC-Induced LVH
As described in failing human hearts,10 as well as in various LVH models,8,9,11 the experiments here revealed marked regional differences in the effects of LVH. Specifically, Ipeak and IK,slow densities were attenuated more in TAC EPI, than TAC ENDO, LV myocytes. The larger reduction in (Ipeak/IK,slow) densities in TAC EPI cells reflects the decrease in IK,slow amplitudes, which were not affected in TAC ENDO cells.
In contrast to previous reports,8–11,28 however, the experiments here also revealed that the cellular responses to pressure overload are heterogeneous. Specifically, cellular hypertrophy was greater in TAC ENDO, than TAC EPI, LV myocytes. This regional difference may reflect the higher wall tension applied to the ENDO, as compared with the EPI, LV surface.30 No changes in mean Ito,f, IK,slow, and IK1 amplitudes were detected in TAC ENDO myocytes; the reductions in the densities of these currents in TAC ENDO cells appear to reflect only the increased cell size. Interestingly, however, mean Iss amplitude was significantly increased in TAC ENDO myocytes, partially compensating for the increase in cell size. Because this increase occurs only in TAC ENDO LV myocytes, where the increase in cell size is greater, it is tempting to speculate that ENDO Iss channels undergo remodeling to compensate (although inefficiently) for cellular hypertrophy/stretch.
The marked reduction in the functional expression of EPI IK,slow channels, together with the increased expression of ENDO Iss channels, collapses the transmural Kv current gradient in TAC LV and is reflected in the alteration in the polarity of the J wave on ECG recordings.
Molecular Remodeling of K+ Channels in TAC-Induced LVH
Reductions in the densities of specific K+ currents in the diseased myocardium have previously been reported to be associated with alterations in the expression of the subunits underlying these currents.3,4 In the molecular/biochemical analyses completed here, however, no significant changes in the expression levels of the Ito,f (Kv4.2, Kv4.3, KChIP2) or IK1 (Kir2.1, Kir2.2) channel subunits in TAC (EPI and/or ENDO) LV were observed, consistent with the observed similarities in Ito,f and IK1 amplitudes in TAC EPI and ENDO LV myocytes. As previously demonstrated,18 the hypertrophic growth of cardiomyocytes with LVH is characterized by an increase in cell size without significant changes in cell number. In agreement with these previous reports,18 TAC-induced LVH was associated with global increases in LV RNA and protein expression. Because cardiomyocytes contribute more than 90% to the total mass of the myocardium,1 the increase in LVM, as well as in RNA and protein content, with LVH predominantly reflects cardiomyocyte enlargement. Taken together, therefore, the results here suggest that the reductions in Ito,f and IK1 densities in TAC LV reflect the fact that the expression of the subunits encoding these channels is not increasing as the cells are enlarging.
In contrast to Ito,f and IK1, mean IK,slow amplitude was markedly reduced in TAC EPI myocytes, suggesting down-regulation of functional IK,slow channels. Unexpectedly, however, Kv1.5 and Kv2.1 transcripts were increased with TAC. Although the lack of an anti-Kv1.5 antibody that can detect endogenous Kv1.5 in cardiomyocytes reliably precluded analyses of Kv1.5 protein expression, biochemical data presented here demonstrate increased total and cell surface Kv2.1 protein expression in TAC EPI and ENDO LV. If Kv1.5 protein expression increases in parallel with KCNA5, the loss of functional IK,slow channels must reflect altered expression of yet to be identified IK,slow accessory and/or regulatory subunits and/or altered posttranslational processing of the Kv1.5 and/or Kv2.1 proteins.
The experiments here also revealed that Iss amplitude was increased in TAC ENDO LV myocytes. Whereas the transcript and total protein expression levels were unchanged in TAC EPI and ENDO, the cell surface expression of TASK1 was markedly increased in TAC LV myocytes. These results are consistent with recent findings demonstrating a role for TASK1 in the generation of Iss in rat cardiomyocytes.26
Relationship to Previous Studies
The results presented here demonstrate that distinct mechanisms underlie functional K+ channel remodeling with LVH, with the main factor being cellular hypertrophy. Several previous studies have described reductions in K+ current densities with LVH or heart failure.5–11,29 Most of these studies reported 30% to 50% decreases in K+ current densities, with cell membrane capacitances increased by approximately the same percentage. Although not reported, it seems likely that K+ current amplitudes were also largely unaffected in these previous studies and that increased cell size was the primary determinant of the reductions in K+ current densities. Some of these previous studies also reported decreased expression of K+ channel subunits with LVH. It appears, however, that these RNA/protein expression data were not normalized to reflect the global RNA/protein increases associated with cellular hypertrophy. Had the cellular hypertrophy been taken into account in these previous LVH studies, it seems certain that the expression levels of K+ channel subunits would, similar to the present findings, be shown to be largely unchanged.
The recognition of the important role of cardiomyocyte enlargement on functional K+ channel expression with LVH will impact the way future investigations into K+ (particularly Ito,f and IK1) channel remodeling with LVH are approached. Indeed, the results presented here suggest that alterations in the functional expression of Ito,f and IK1 channels with LVH do not reflect transcriptional or translational downregulation of the subunits encoding these channels, as has been previously suggested.3,4,29 Rather, the results here suggest that although global transcriptional and translational machineries are activated with LVH,18 the expression of channel subunits do not increase corresponding to the increase in cell size. Therapeutic strategies aimed at reducing cellular hypertrophy or increasing the functional expression of repolarizing K+ channels would, therefore, appear to be promising approaches in the treatment of LVH-associated ventricular arrhythmias.
Supplemental Materials
Acknowledgments
We thank the Mouse Cardiovascular Phenotyping Core for surgical expertise and Drs Flavien Charpentier and Attila Kovacs for helpful discussion concerning interpretation of ECGs and echocardiograms.
Sources of Funding
This work was supported by National Heart, Lung, and Blood Institute grant HL-066388, the Heartland Affiliate of the American Heart Association (Postdoctoral Fellowship), and Agence Nationale de la Recherche grant ANR-05-PCOD-037-01.
Footnotes
The online version of this article, along with updated information and services, is located on the World Wide Web at: http://circres.ahajournals.org/cgi/content/full/102/11/1406
Disclosures
None.
References
- 1.Schoen FJ. The heart. In: Cotran RS, Kumar V, Collins T, editors. Robbin’s Pathologic Basis of Disease. Philadelphia, Pa: WB Saunders Co; 1999. pp. 543–599. [Google Scholar]
- 2.McMullen JR, Jennings GL. Differences between pathological and physiological cardiac hypertrophy: novel therapeutic strategies to treat heart failure. Clin Exp Pharmacol Physiol. 2007;34:255–262. doi: 10.1111/j.1440-1681.2007.04585.x. [DOI] [PubMed] [Google Scholar]
- 3.Nattel S, Maguy A, Le Bouter S, Yeh YH. Arrhythmogenic ion-channel remodeling in the heart: heart failure, myocardial infarction, and atrial fibrillation. Physiol Rev. 2007;87:425–456. doi: 10.1152/physrev.00014.2006. [DOI] [PubMed] [Google Scholar]
- 4.Armoundas AA, Wu R, Juang G, Marban E, Tomaselli GF. Electrical and structural remodeling of the failing ventricle. Pharmacol Ther. 2001;92:213–230. doi: 10.1016/s0163-7258(01)00171-1. [DOI] [PubMed] [Google Scholar]
- 5.Kaab S, Nuss HB, Chiamvimonvat N, O’Rourke B, Pak PH, Kass DA, Marban E, Tomaselli GF. Ionic mechanism of action potential prolongation in ventricular myocytes from dogs with pacing-induced heart failure. Circ Res. 1996;78:262–273. doi: 10.1161/01.res.78.2.262. [DOI] [PubMed] [Google Scholar]
- 6.Dong D, Duan Y, Guo J, Roach DE, Swirp SL, Wang L, Lees-Miller JP, Sheldon RS, Molkentin JD, Duff HJ. Overexpression of calcineurin in mouse causes sudden cardiac death associated with decreased density of K+ channels. Cardiovasc Res. 2003;57:320–332. doi: 10.1016/s0008-6363(02)00661-2. [DOI] [PubMed] [Google Scholar]
- 7.Rose J, Armoundas AA, Tian Y, DiSilvestre D, Burysek M, Halperin V, O’Rourke B, Kass DA, Marban E, Tomaselli GF. Molecular correlates of altered expression of potassium currents in failing rabbit myocardium. Am J Physiol Heart Circ Physiol. 2005;288:H2077–H2087. doi: 10.1152/ajpheart.00526.2003. [DOI] [PMC free article] [PubMed] [Google Scholar]
- 8.Wang Y, Cheng J, Chen G, Rob F, Haris Naseem R, Nguyen L, Johnstone J, Hill J. Remodeling of outward K+ currents in pressure-overload heart failure. J Cardiovasc Electrophysiol. 2007;18:869–875. doi: 10.1111/j.1540-8167.2007.00864.x. [DOI] [PubMed] [Google Scholar]
- 9.Volk T, Nguyen TH, Schultz JH, Faulhaber J, Ehmke H. Regional alterations of repolarizing K+ currents among the left ventricular free wall of rats with ascending aortic stenosis. J Physiol. 2001;530:443–455. doi: 10.1111/j.1469-7793.2001.0443k.x. [DOI] [PMC free article] [PubMed] [Google Scholar]
- 10.Nabauer M, Beuckelmann DJ, Uberfuhr P, Steinbeck G. Regional differences in current density and rate-dependent properties of the transient outward current in subepicardial and subendocardial myocytes of human left ventricle. Circulation. 1996;93:168–177. doi: 10.1161/01.cir.93.1.168. [DOI] [PubMed] [Google Scholar]
- 11.Zicha S, Xiao L, Stafford S, Cha TJ, Han W, Varro A, Nattel S. Transmural expression of transient outward potassium current subunits in normal and failing canine and human hearts. J Physiol. 2004;561:735–748. doi: 10.1113/jphysiol.2004.075861. [DOI] [PMC free article] [PubMed] [Google Scholar]
- 12.Zhang S, Weinheimer C, Courtois M, Kovacs A, Zhang CE, Cheng AM, Wang Y, Muslin AJ. The role of the Grb2-p38 MAPK signaling pathway in cardiac hypertrophy and fibrosis. J Clin Invest. 2003;111:833–841. doi: 10.1172/JCI16290. [DOI] [PMC free article] [PubMed] [Google Scholar]
- 13.Chiu HC, Kovacs A, Blanton RM, Han X, Courtois M, Weinheimer CJ, Yamada KA, Brunet S, Xu H, Nerbonne JM, Welch MJ, Fettig NM, Sharp TL, Sambandam N, Olson KM, Ory DS, Schaffer JE. Transgenic expression of fatty acid transport protein 1 in the heart causes lipotoxic cardiomyopathy. Circ Res. 2005;96:225–233. doi: 10.1161/01.RES.0000154079.20681.B9. [DOI] [PubMed] [Google Scholar]
- 14.London B, Guo W, Pan X, Lee JS, Shusterman V, Rocco CJ, Logothetis DA, Nerbonne JM, Hill JA. Targeted replacement of KV1.5 in the mouse leads to loss of the 4-aminopyridine-sensitive component of I(K,slow) and resistance to drug-induced qt prolongation. Circ Res. 2001;88:940–946. doi: 10.1161/hh0901.090929. [DOI] [PubMed] [Google Scholar]
- 15.Brunet S, Aimond F, Li H, Guo W, Eldstrom J, Fedida D, Yamada KA, Nerbonne JM. Heterogeneous expression of repolarizing, voltage-gated K+ currents in adult mouse ventricles. J Physiol. 2004;559:103–120. doi: 10.1113/jphysiol.2004.063347. [DOI] [PMC free article] [PubMed] [Google Scholar]
- 16.Marionneau C, Couette B, Liu J, Li H, Mangoni ME, Nargeot J, Lei M, Escande D, Demolombe S. Specific pattern of ionic channel gene expression associated with pacemaker activity in the mouse heart. J Physiol. 2005;562:223–234. doi: 10.1113/jphysiol.2004.074047. [DOI] [PMC free article] [PubMed] [Google Scholar]
- 17.de Kok JB, Roelofs RW, Giesendorf BA, Pennings JL, Waas ET, Feuth T, Swinkels DW, Span PN. Normalization of gene expression measurements in tumor tissues: comparison of 13 endogenous control genes. Lab Invest. 2005;85:154–159. doi: 10.1038/labinvest.3700208. [DOI] [PubMed] [Google Scholar]
- 18.Hannan RD, Jenkins A, Jenkins AK, Brandenburger Y. Cardiac hypertrophy:a matter of translation. Clin Exp Pharmacol Physiol. 2003;30:517–527. doi: 10.1046/j.1440-1681.2003.03873.x. [DOI] [PubMed] [Google Scholar]
- 19.Guo W, Jung WE, Marionneau C, Aimond F, Xu H, Yamada KA, Schwarz TL, Demolombe S, Nerbonne JM. Targeted deletion of Kv4.2 eliminates I(to,f) and results in electrical and molecular remodeling, with no evidence of ventricular hypertrophy or myocardial dysfunction. Circ Res. 2005;97:1342–1350. doi: 10.1161/01.RES.0000196559.63223.aa. [DOI] [PubMed] [Google Scholar]
- 20.Liu G, Iden JB, Kovithavongs K, Gulamhusein R, Duff HJ, Kavanagh KM. In vivo temporal and spatial distribution of depolarization and repolarization and the illusive murine T wave. J Physiol. 2004;555:267–279. doi: 10.1113/jphysiol.2003.054064. [DOI] [PMC free article] [PubMed] [Google Scholar]
- 21.London B, Baker LC, Petkova-Kirova P, Nerbonne JM, Choi BR, Salama G. Dispersion of repolarization and refractoriness are determinants of arrhythmia phenotype in transgenic mice with long QT. J Physiol. 2007;578:115–129. doi: 10.1113/jphysiol.2006.122622. [DOI] [PMC free article] [PubMed] [Google Scholar]
- 22.Xu H, Barry DM, Li H, Brunet S, Guo W, Nerbonne JM. Attenuation of the slow component of delayed rectification, action potential prolongation,and triggered activity in mice expressing a dominant-negative Kv2 alpha subunit. Circ Res. 1999;85:623–633. doi: 10.1161/01.res.85.7.623. [DOI] [PubMed] [Google Scholar]
- 23.Zaritsky JJ, Redell JB, Tempel BL, Schwarz TL. The consequences of disrupting cardiac inwardly rectifying K(+) current (I(K1)) as revealed by the targeted deletion of the murine Kir2.1 and Kir2.2 genes. J Physiol. 2001;533:697–710. doi: 10.1111/j.1469-7793.2001.t01-1-00697.x. [DOI] [PMC free article] [PubMed] [Google Scholar]
- 24.Guo W, Li H, Aimond F, Johns DC, Rhodes KJ, Trimmer JS, Nerbonne JM. Role of heteromultimers in the generation of myocardial transient outward K+ currents. Circ Res. 2002;90:586–593. doi: 10.1161/01.res.0000012664.05949.e0. [DOI] [PubMed] [Google Scholar]
- 25.Nerbonne JM, Kass RS. Molecular physiology of cardiac repolarization. Physiol Rev. 2005;85:1205–1253. doi: 10.1152/physrev.00002.2005. [DOI] [PubMed] [Google Scholar]
- 26.Putzke C, Wemhoner K, Sachse FB, Rinne S, Schlichthorl G, Li XT, Jae L, Eckhardt I, Wischmeyer E, Wulf H, Preisig-Muller R, Daut J, Decher N. The acid-sensitive potassium channel TASK-1 in rat cardiac muscle. Cardiovasc Res. 2007;75:59–68. doi: 10.1016/j.cardiores.2007.02.025. [DOI] [PubMed] [Google Scholar]
- 27.Godreau D, Vranckx R, Maguy A, Rucker-Martin C, Goyenvalle C, Abdelshafy S, Tessier S, Couetil JP, Hatem SN. Expression, regulation and role of the MAGUK protein SAP-97 in human atrial myocardium. Cardiovasc Res. 2002;56:433–442. doi: 10.1016/s0008-6363(02)00602-8. [DOI] [PubMed] [Google Scholar]
- 28.Hill JA, Karimi M, Kutschke W, Davisson RL, Zimmerman K, Wang Z, Kerber RE, Weiss RM. Cardiac hypertrophy is not a required compensatory response to short-term pressure overload. Circulation. 2000;101:2863–2869. doi: 10.1161/01.cir.101.24.2863. [DOI] [PubMed] [Google Scholar]
- 29.Kaab S, Dixon J, Duc J, Ashen D, Nabauer M, Beuckelmann DJ, Steinbeck G, McKinnon D, Tomaselli GF. Molecular basis of transient outward potassium current downregulation in human heart failure: a decrease in Kv4.3 mRNA correlates with a reduction in current density. Circulation. 1998;98:1383–1393. doi: 10.1161/01.cir.98.14.1383. [DOI] [PubMed] [Google Scholar]
- 30.Kelly D, Mackenzie L, Hunter P, Smaill B, Saint DA. Gene expression of stretch-activated channels and mechanoelectric feedback in the heart. Clin Exp Pharmacol Physiol. 2006;33:642–648. doi: 10.1111/j.1440-1681.2006.04392.x. [DOI] [PubMed] [Google Scholar]
Associated Data
This section collects any data citations, data availability statements, or supplementary materials included in this article.


