

Abstract
Objective
To compare alternative measures of nurse staffing and assess the relative strengths and limitations of each measure.
Data Sources/Study Setting
Primary and secondary data from 2000 and 2002 on hospital nurse staffing from the American Hospital Association, California Office of Statewide Health Planning and Development, California Nursing Outcomes Coalition, and the California Workforce Initiative Survey.
Study Design
Hospital-level and unit-level data were compared using summary statistics, t-tests, and correlations.
Data Collection/Extraction Methods
Data sources were matched for each hospital. When possible, hospital units or types of units were matched within each hospital. Productive nursing hours and direct patient care hours were converted to full-time equivalent employment and to nurse-to-patient ratios to compare nurse staffing as measured by different surveys.
Principal Findings
The greatest differences in staffing measurement arise when unit-level data are compared with hospital-level aggregated data reported in large administrative databases. There is greater dispersion in the data obtained from publicly available, administrative data sources than in unit-level data; however, the unit-level data sources are limited to a select set of hospitals and are not available to many researchers.
Conclusions
Unit-level data collection may be more precise. Differences between databases may account for differences in research findings.
Keywords: Nurse staffing, hospital surveys, measurement
Numerous research reports have examined patterns of nurse staffing (Aiken, Sochalski, and Anderson 1996; Unruh, Fottler, and Talbott 2003; Aydin et al. 2004) and the relationship between nurse staffing and patient outcomes (Aiken et al. 2002; Needleman et al. 2002; Lang et al. 2004; Donaldson et al. 2005). These studies often reach different conclusions about historical changes in nurse staffing and the relationship of nurse staffing to patient outcomes. For example, two publications in the 1990s offered opposing findings about whether nurse staffing had declined in California, using different data sources (Anderson and Kohn 1996;Spetz 1998). Discrepancies also are found in the literature on the relationship between nurse staffing and patient outcomes. While many studies that use hospital-level data have found that higher levels of nurse staffing are associated with improved patient outcomes and lower mortality rates (Aiken et al. 2002; Needleman et al. 2002), most studies that examine data at the level of the hospital unit have found a weaker relationship or no relationship at all (e.g., Donaldson et al. 2005). It is unknown whether these different findings are the result of the use of varying measures of nurse staffing, differences in the importance of overall hospital staffing versus unit-level staffing, measurement error, or some other factor.
Why do these studies obtain such different results? One possibility lies in different methods of measuring nurse staffing. Datasets used to measure nurse staffing can provide data by hospital, type of hospital unit, or specific unit. Nurse staffing can be measured as full-time equivalent employment (FTEE), nursing hours per patient day, share of registered nurses in total nursing staff, nurse-to-patient ratios, or other metrics. This paper compares nurse staffing measurements in two commonly used datasets—the American Hospital Association (AHA) Annual Survey of Hospitals and California's Office of Statewide Health Planning and Development (OSHPD) Hospital Annual Disclosure Report—as well as unit-level data collected by the California Nursing Outcomes Coalition (CalNOC) and the California Workforce Initiative (CWI). In 2006, Jiang, Stocks, and Wong analyzed disparities between AHA and OSHPD data, concluding that the OSHPD data on nurse staffing appeared more complete and, thus, more closely associated with patient outcomes. In this report, we examine principal differences between the AHA and OSHPD datasets as well as unit-level CalNOC and CWI data, compare the levels of nurse staffing measured by each, and discuss the ramifications of using alternative data sources and measures for nurse staffing and outcomes research.
BACKGROUND
Nursing personnel comprises registered nurses (RNs), licensed practical/vocational nurses (LPNs/LVNs), and nursing aides/unlicensed assistive personnel (NAs/UAP). In most hospitals, staff assignments are for a particular shift on a specific patient care unit. The most disaggregated level of data would be that of the individual patient: the number of hours of nursing care provided to each patient. However, hospitals do not record the amount of care each patient receives because hospitals are not reimbursed specifically for the amount of nursing care delivered to each patient. The burden of such measurement would not be offset by any financial gain. Thus, for a hospital, the most disaggregated level of nurse staffing measurement available is usually the patient care unit. Patient care units can be aggregated by type of care they provide; for example, a hospital might have five medical–surgical care units that can be grouped together. Finally, all hospital units can be aggregated to the level of the hospital.
At each level of aggregation (unit, type of unit, hospital), nurse staffing can be measured in several ways. Most hospitals record the number of hours worked by nursing staff, because payroll processing requires this information. These hours are called “productive hours” and exclude paid time off for illness, vacation, or continuing education. Some hospitals record how many of these productive hours are associated with direct patient care assignments, thus excluding nursing time spent in supervisory roles, care coordination, or other non-direct patient-care activities. However, not all recordkeeping systems delineate between patient care and non-patient-care time, and thus “productive hours” reported might include non-patient-care hours.
Many researchers and health care leaders want to measure nurse staffing according to the workload of each nurse, although “workload” does not have an agreed-upon definition. Most hospitals can easily report the average number of productive nursing hours per patient day (“hours per patient day” or HPPD), because they keep data on nursing hours and patient days. However, many health care leaders prefer to conceptualize workload as a nurse-to-patient ratio, such as “one nurse for every five patients.” Although the way this measure is stated implies that a single nurse has responsibility for a set group of patients, this might not be the case. The nurse might work on a team of three nurses for 15 patients. More importantly, the nurse's patients change as they are admitted and discharged during a shift; thus, a nurse might care for 10 patients during a shift, with the five patients present at the start of the shift being replaced by five other patients later in the shift.
In theory, the nurse-to-patient ratio can be computed from productive direct patient care nursing hours. If each patient day comprises 24 hours, then:
This conversion can be problematic for two reasons. First, each patient day might not average 24 hours. A patient for an elective surgery might arrive early on the admission day and depart late on the discharge day, adding a few hours more than 24 per day. The average day could be shorter than 24 hours, as well; patients might tend to be admitted late in the day and be discharged early, leading to average days of <24 hours. Recent research using a sample of hospitals from Pennsylvania found that patient days are, on average, about 10 percent longer than 24 hours (Unruh, Fottler, and Talbott 2003). The second problem with the conversion is that productive nursing hours reported by hospitals may not be limited to direct patient care, and thus the imputed nurse-to-patient ratio will be excessively high.
A third measure of nurse staffing found in many datasets and studies is FTEE. This measure is intended to quantify the number of nurses working at a hospital. There are two ways to calculate FTEE. One method is to add the number of full-time nurses, defined as nurses working more than some threshold of hours, to a fraction of the number of part-time nurses. Ideally, the share of a full-time nurse that a part-time nurse represents is proportionate to the number of hours per week that the part-time nurse works. Most datasets assume that a part-time nurse is equivalent to one-half of a full-time nurse, even though many part-time nurses work more (or less) than 20 hours per week.
Another method for measuring FTEE involves converting productive nursing hours. A FTEE nurse is assumed to work a potential of 52 weeks per year at 40 hours per week, resulting in 2,080 potential hours per year. However, some of these potential hours will be used for vacation, sick leave, and continuing education; thus, the hours per year are fewer than 2,080. Labor researchers and budgeting experts usually assume that between 75 and 86 percent of potential hours are productive (Office of the City Auditor 1995; Eldridge 2004); assuming 85 percent are productive results in an annual rate of 1,768 hours per year (Spetz et al. 2000). FTEE is thus computed as
As with nursing hours, FTEE can be compared with the number of patient days to measure workload.
The three types of nursing personnel—RNs, LPNs, and NAs—can be included in any measure of nurse staffing. Some researchers group all three classifications together to consider total nurse staffing. Others disaggregate these types of nurses. Different methods of measuring nurse staffing can produce variation in the results of statistical analyses.
DATASETS
To explore different methods of measuring nurse staffing, we explicitly compare four datasets: the AHA Annual Survey of Hospitals, the California OSHPD Annual Disclosure Reports, the CalNOC data, and a survey conducted in 2000 for the CWI. These datasets are summarized in Table 1 and described below.
Table 1.
Sources of Data on Hospital Staffing
| Data Source | Sample | Observation Level | Nurse Staffing Measures |
|---|---|---|---|
| American Hospital Association Annual Survey of Hospitals | All hospitals in the United States, since 1946 | Full hospital, including all ancillary, long-term care, and other units | Number of full-time RNs |
| Number of full-time LPNs | |||
| Number of part-time RNs | |||
| Number of part-time LPNs | |||
| Full-time equivalent RNs (calculated) | |||
| Full-time equivalent LPNs (calculated) | |||
| California Office of Statewide Health Planning and Development Annual Hospital Disclosure Reports | All non-federal hospitals in California since 1975–1976; limited reporting by Kaiser hospitals | Type of unit, including daily, ancillary, and ambulatory services | Productive hours worked by RNs, LVNs, aides/orderlies, and other employees classifications |
| California Nursing Outcomes Coalition | Convenience sample of hospitals in California since 1998, representing a range of hospital size, service mix, and location | Specific units for medical-surgical, intensive care, and step-down | Productive hours worked by RNs, LVNs, unlicensed assistive personnel |
| California Workforce Initiative Survey | 115 hospitals that responded to a survey sent to all California acute-care hospitals in 2000 | One “representative” medical-surgical unit in the hospital | Nursing hours Nurse-to-patient ratios |
LPN, licensed practical nurses; LVN, licensed vocational nurses; RN, registered nurses.
AHA Annual Survey of Hospitals
The AHA has collected the Annual Survey of Hospitals since 1946. The AHA surveys all hospitals in the United States and the response rate averages 85–95 percent annually (AHA 1999), resulting in approximately 6,000 hospital observations per year. Staffing is measured as the numbers of full-time and part-time RNs, and LPNs. These staffing data are reported for the entire hospital and include personnel working in ambulatory, long-term care, and ancillary departments.
The AHA computes and reports FTEE for each hospital, defining full-time as working 35 hours or more per week, and part-time as working <35 hours per week (AHA 1999). FTEE is computed by adding the number of full-time personnel to half the number of part-time personnel (AHA 1999). This measure potentially overestimates or underestimates the use of staff. For example, a nurse who works 20 hours per week and one who works 34 hours per week would each be counted as one-half of an FTEE, while a nurse who works 35 hours per week and one who works 40 hours per week would each count as one FTEE.
The staffing data reported by the AHA can be compared with information about the volume of patient care services. Total discharges and patient days are reported, although these data do not include discharges or patient days from a hospital's nursery acute unit. Hospitals also provide the numbers of discharges and days for hospital and nursing home departments separately. These measures of the volume of hospital services do not match the staffing data well, however, because the staffing data include personnel working in all departments, including ambulatory and ancillary services. Most researchers adjust for this discrepancy by multiplying patient days by a factor that measures ambulatory and/or ancillary patient volume. The AHA data reports “adjusted admissions” and “adjusted patient days,” which are computed:
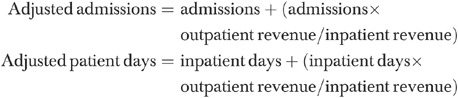 |
This method of accounting for staffing allocated to ambulatory care suffers from the assumptions that there is a proportional relationship between nurse staffing and hospital revenues, and that there is a similar relationship between nurse staffing per dollar of revenue in both outpatient and inpatient settings (Needleman et al. 2001). Needleman et al. (2001) used a regression-based adjustment, but this approach requires access to a database that provides accurate inpatient and outpatient volumes and staffing to develop the underlying regression equation.
California OSHPD Annual Disclosure Reports
California's OSHPD collects annual hospital financial, utilization, and payroll data in its Annual Disclosure Report, collected since the 1975–1976 fiscal year. Every hospital except federal hospitals is required to complete the survey annually for its own fiscal year data, and the survey responses are audited for consistency. Some hospitals are not required to complete every page of the survey; for example, state hospitals are not mandated to provide staffing data, and Kaiser hospitals did not submit staffing data until the early 2000s.
OSHPD's Hospital Disclosure Report measures employment in terms of productive hours for each of RNs, LPNs, unlicensed aides/orderlies, management and supervision, administrative and clerical, and other labor categories. Hours are reported for each revenue unit separately, with revenue units including daily services aggregated to the “divisional level” (medical–surgical inpatient, intensive care, pediatric inpatient, rehabilitation, long-term care, etc.), ancillary services (laboratory, physical therapy, operating rooms, etc.), and ambulatory services (outpatient surgery, clinics, etc.). Most hospitals use their payroll system, not their actual unit-level staffing grid, to complete the survey, and thus the data are subject to errors that might exist in any payroll system. For example, hospitals might not consistently measure hours worked by nurses normally assigned to one unit but “floated” to another. The number of patient days or services provided in each revenue unit is reported, enabling calculation of hours per patient day, hours per patient discharge, and/or hours per service provided. Unit types can be aggregated or examined separately (e.g., HPPD for medical–surgical acute care only).
CalNOC Database
The CalNOC is a voluntary initiative to build and sustain a database on nurse staffing and quality outcomes, and to conduct research on the relationship between nurse staffing and patient outcomes to improve decision making (Aydin et al. 2004). All acute care hospitals in California are invited to join CalNOC for a participation fee, resulting in a convenience sample with the number of participating hospitals increasing over time. Participation in the CalNOC project has grown to include 180 hospitals in 2006, representing 47 percent of all general acute-care hospitals in California. There also are a small number of hospitals participating from outside California, from hospital systems that have hospitals outside the state. Attrition is low, with only eight hospitals withdrawing since 1998. Small and for-profit hospitals are under-represented in the CalNOC data; 15 percent of CalNOC participants have fewer than 100 licensed beds, compared with 24 percent statewide.
CalNOC collects monthly data at the patient care unit level for adult medical, surgical, medical–surgical, critical care, step-down, and 24-hour observation units. Data are submitted by each hospital to CalNOC quarterly using coding specifications, tutorials and workshop training provided by CalNOC. Pediatric and postacute (acute rehabilitation and hospital-based skilled nursing) units were added to the CalNOC dataset in 2005. CalNOC data elements include hours of nursing care (including contracted staff hours and sitter hours), patient days, and selected patient outcomes (patient falls, restraint use prevalence, medication administration accuracy, and catheter-associated blood stream infections). Hours of nursing care are measured as productive hours worked by RNs, LVNs, and other nursing staff, and CalNOC computes skill mix, hours of care per patient day, and RN-to-patient ratios from these data. CalNOC's coding instructions to hospitals specify that only direct-patient-care hours should be reported. CalNOC also collects information about the educational preparation, professional certification, and years of experience of RN staff.
CWI Survey
The CWI, a program of the UCSF Center for the Health Professions, conducted a survey in 2000 to learn about nurse staffing in preparation for California's minimum nurse-to-patient ratios. A 16-item survey was mailed to all 410 acute care hospitals in California with a follow-up mailing to non-responders one month after the original mailing. Responses were received from 115 hospitals for a return rate of 28 percent, and the sample was generally representative of hospitals in California (Seago et al. 2003).
The survey requested that hospitals provide data for a representative medical–surgical unit in the hospital. Survey questions focused on nursing hours worked on that unit, discharges and patient days on the unit, nurse-to-patient ratios, number of vacancies, and average time to recruit a RN to the unit. Both hours per patient day and the nurse-to-patient ratio were reported directly by unit managers, enabling a direct comparison of these methods of measuring nurse staffing.
METHODS USED IN THE COMPARISON OF STAFFING MEASURES
To understand how alternative measures of nurse staffing vary, we merged the four datasets to directly compare hospital-level data. We focused our analysis on short-term acute general hospitals, excluding children's and specialty hospitals. We used data from 2000 for most of the analysis, because the CWI survey was a one-time survey conducted in that year. The CalNOC comparison was conducted using data from 2002, because that was the most recent CalNOC data available for matching at the time of the analysis, with the largest number of hospitals providing data.
We began by linking the 2000 OSHPD and AHA datasets, matching 349 hospitals. The AHA-OSHPD comparison focused on total hospital employment, because the AHA survey does not permit disaggregation by type of service.
The OSHPD survey was linked to the CWI survey. The CWI data included two children's hospitals, one specialty hospital, and a federal hospital, which were excluded from this comparison. We thus matched 111 hospitals from the CWI survey with OSHPD data. We limited the OSHPD data to medical–surgical units, to match the type of unit reported in the CWI survey.
Finally, we linked the Year 28 OSHPD data (hospital fiscal years spanning 2001 and 2002) with the 2002 CalNOC data, matching 106 hospitals. Hospitals report unit-by-unit data to CalNOC, which we merged to create totals for types of units. The two categories examined here are medical–surgical units and intensive care units. CalNOC also receives data about step-down units, but OSHPD does not report data for this category. The OSHPD category of “Definitive Observation” was considered as a match to CalNOC's “step-down” definition, but exploratory analyses found large discrepancies in reported patient days and nurse staffing between the OSHPD and CalNOC data. Thus, we excluded step-down units from this analysis.
To compare the datasets, we first calculated equivalent measures of nurse staffing, which are described below for each comparison. We then compared the means and frequency distributions for these measures, using t-tests to determine whether differences were statistically significant. Pearson correlations and Spearman (rank) correlations were computed for each comparison. Key results are presented below. Additional statistics and charts are available in the online supplementary appendix.
RESULTS
AHA and OSHPD Data on Aggregate Hospital Staffing
AHA reports full-time-equivalent employment of RNs and LPNs, while OSHPD reports productive hours. We computed FTEE for the OSHPD data using the formula above. As seen in Figure 1, there is a difference in the distribution of total RN FTEs in each dataset; the difference in the means is not statistically significant, with the AHA data producing slightly lower average RN FTEs than the OSHPD data (231.4 versus 234.9, p=.47). The Pearson and Spearman correlations between RN staffing in these datasets were quite high, with both at 0.93. Thus, the AHA and OSHPD data provide similar measures of RN staffing, once the OSHPD data have been converted to FTEs. There is less concordance between the AHA and OSHPD data in the measurement of LPN staffing. The mean LPN FTEs in the AHA data are higher than in the OSHPD data (28.6 versus 27.0, p=.16). The Pearson correlation between these datasets is 0.69.
Figure 1. Histogram of AHA and OSHPD FTEE RNs.

AHA and OSHPD both provide total inpatient days. The Pearson correlation between these is quite high (0.96), but the AHA data measures a lower average number of inpatient days (46,416 versus 48,204, p=.004). We examined the adjusted patient days measure offered by AHA, finding that they are 47 percent greater, on average, than unadjusted patient days (68,360). The Pearson correlation between AHA adjusted patient days and OSHPD inpatient days (0.95) is slightly lower than for unadjusted AHA patient days.
To compare the relationship between RN staffing and patient volume, we computed RN hours per patient day for both datasets. For the AHA data, we had to first compute productive hours from the FTEs reported by AHA before dividing by patient days. Figure 2 presents a histogram of these ratios. The computed RN hours per patient day are higher on average in the AHA data (9.53 versus 8.84, p=.003). The Pearson correlation between the AHA and OSHPD datasets for RN hours per patient day is modest, at 0.62. When AHA adjusted patient days are used in the calculation, the AHA hours per patient day are much lower than with unadjusted patient days (5.81), and the Pearson correlation is lower (0.57).
Figure 2. Histogram of RN Hours per Patient Day, OSHPD and AHA Data.

CalNOC and OSHPD Data on Unit-Level Staffing
Table 2 summarizes the critical care and medical–surgical nurse staffing and patient days data reported by CalNOC and OSHPD. OSHPD reports a greater number of RN and LPN hours as well as patient days, and all differences are statistically significant. The greater number of nursing hours reported by OSHPD is consistent with OSHPD's productive hours including non-direct-patient-care hours, which may include RNs in special roles such as clinical specialists or infection control managers. The correlations between RN hours, LPN hours, and patient days are relatively high, ranging from 0.73 to 0.92. The correlations are higher for critical care than for medical–surgical care.
Table 2.
Summary of the CalNOC and OSHPD Data, 2002
| RN Hours | LPN Hours | Patient Days | Total Hours per Patient Day | RN Hours per Patient Day | |
|---|---|---|---|---|---|
| Intensive-care units | |||||
| CalNOC mean | 76,279.3 | 713.2 | 5,057 | 15.86 | 14.89 |
| OSHPD mean | 101,093.5 | 1,409.0 | 6,312 | 17.39 | 16.59 |
| CalNOC median | 52,148.0 | 17.0 | 3,777 | 15.70 | 14.66 |
| OSHPD median | 80,336.5 | 163 | 4,952 | 17.15 | 16.39 |
| CalNOC std. dev. | 71,634.4 | 1,754.0 | 4,295 | 3.43 | 3.45 |
| OSHPD std. dev. | 83,398.1 | 2,396.1 | 5,091 | 3.96 | 3.96 |
| Pearson correlation | 0.841 | 0.911 | 0.820 | 0.204 | 0.296 |
| Spearman correlation | 0.794 | 0.851 | 0.842 | 0.155 | 0.282 |
| Medical-surgical units | |||||
| CalNOC Mean | 114,046 | 15,368 | 24,407 | 7.94 | 4.51 |
| OSHPD Mean | 167,328 | 20,404 | 31,352 | 8.58 | 5.38 |
| CalNOC Median | 97,296 | 10,862 | 21,689 | 7.90 | 4.44 |
| OSHPD Median | 134,095 | 14,578 | 26,001 | 8.36 | 5.48 |
| CalNOC std. dev. | 102,337 | 14,139 | 18,414 | 1.45 | 0.99 |
| OSHPD std. dev. | 131,629 | 19,838 | 22,432 | 1.99 | 1.37 |
| Pearson correlation | 0.806 | 0.737 | 0.809 | 0.219 | 0.324 |
| Spearman correlation | 0.724 | 0.827 | 0.786 | 0.222 | 0.408 |
CalNOC, California Nursing Outcomes Coalition; OSHPD, Office of Statewide Health Planning and Development; LPN, licensed practical nurses; RN, registered nurses; std. dev., standard deviation.
The last two columns of Table 2 report summary statistics for total nursing hours per patient day and RN hours per patient day. OSHPD hours per patient day are higher than those in the CalNOC data, and the differences are statistically significant. The Pearson correlations between the OSHPD and CalNOC critical care hours per patient day measures are low, at 0.20 for total hours and 0.30 for RN hours; the Spearman correlations are even lower. The Pearson correlations between the CalNOC and OSHPD medical–surgical hours per patient day also are low, at 0.22 for total hours per patient day and 0.32 for RN hours per patient day. For both types of care, the OSHPD data are more dispersed than the CalNOC data for the matched hospitals, suggesting that there might be greater measurement error in the OSHPD dataset.
CWI and OSHPD Data on Medical–Surgical Unit Staffing
We were able to compare 83 hospitals; 22 hospitals did not report RN hours in the CWI survey. First, we computed RN hours per patient day; the OSHPD hours per patient day are for all medical–surgical units, while the CWI figures are for a single medical–surgical unit. The hours per patient day reported in the CWI survey are lower than those in the OSHPD data, averaging 4.89 in the CWI data versus 4.97 in the OSHPD data, although this difference is not statistically significant (p=.81). The Pearson correlation between these measures is 0.58.
Second, we examined patient-to-nurse ratios, which are used in regulatory policy and offer a simple way to think about the amount of nursing care available to patients. Eighty hospitals are included in this comparison. With the OSHPD and CWI data, we computed patients per RN, using the formula presented above. The CWI computation results in more patients per nurse than the OSHPD data, averaging 6.39 in CWI and 5.33 in OSHPD, and this difference is statistically significant (p=.041). We compared the computed ratios with patients per RN as directly reported in the CWI survey. The reported ratio is greater than the computed ratio for 70 percent of the respondents, averaging 6.9 patients per RN, although the difference between the two CWI measures is not statistically significant (p=.33). The correlations between all three ratios are modest to moderate. The Pearson correlation between the two CWI ratios is 0.28, while the Spearman correlation is 0.49. The higher Spearman correlation indicates that there is greater correlation in the relative rankings of hospitals than in the values of the staffing ratios. The Pearson correlation between the computed CWI ratio and the OSHPD ratio is 0.29 (Spearman=0.41), while the Pearson correlation between the reported CWI ratio and the reported OSHPD ratio is 0.64 (Spearman=0.56).
Conclusions And Recommendations For Research
We found differences in nurse staffing levels across datasets and specific methods of measuring nurse staffing, some of which were minor and some of which were notable. The greatest differences arise when unit-level data reported directly by nurse managers is compared with hospital-level aggregated payroll, accounting, or staffing data reported in administrative databases. While both data sources purport to provide a measure of direct care staffing levels, they reflect different data sources and data collection methods.
Correlations between the AHA and OSHPD datasets for inpatient days and RN employment were high overall, at least 0.9. The means of these measures were similar. The means of RN and LPN employment were not statistically significantly different, while computed hours per patient day were statistically different in the OSHPD and AHA datasets. Most hospitals provide the staffing data to OSHPD and AHA from payroll systems, which might contain several types of measurement error. First, these systems do not delineate direct patient care from nondirect care in productive staff or hours, and thus overestimate the amount of direct nursing care received by each patient. Second, these data might not accurately reflect movements of nurses across units if they are cross-trained or if they “float.” Third, the payroll systems from which the data are derived might contain other errors in staff classification that do not affect the integrity of the payroll system but do affect the quality of the data received. For example, a nurse might change the unit to which s/he is assigned, without a change in pay, and this change may not be reflected in the payroll data in a timely fashion.
There was greater discrepancy between the OSHPD and CalNOC data, and between the OSHPD and CWI data. These differences may be explained in part by whether non-direct but productive patient care hours are reported. However, there are other differences between these datasets. The CalNOC and CWI data are reported directly by nurse managers and chief nursing officers. CalNOC member hospitals are provided with guidance about how the data elements should be measured.
The CalNOC data are less widely dispersed than the OSHPD data for the matched set of hospitals, suggesting that the CalNOC data might contain less measurement error. Nursing hours were on average higher in the OSHPD data than in CalNOC, likely because OSHPD data include nurse staff time spent on activities other than patient care. As a result, the distribution of nurse staffing per patient day is different between these datasets, with the CalNOC data producing somewhat lower hours per patient day than the OSHPD data. The correlations between estimates of hours per patient day are low, at 0.22 for total nursing hours and 0.32 for RN hours.
The CWI data illustrate the difficulty of relating hours per patient day to the patient-to-nurse ratio. The correlation between these measures is moderate at best, even when reported by the same person in a single survey. There are several reasons discrepancies might arise between these measurements. First, standard measures of patient days do not take into account the flow of patients within a day. The patient-to-nurse ratio might better capture fluctuations in patient loads, and might explain why the patient-to-nurse ratio is higher when directly reported than when computed. However, because patient-to-nurse ratios vary during and across shifts they are difficult to measure in a standardized dataset. The patient-to-nurse ratio may be best suited to smaller studies in which shift-to-shift unit-level primary data collection is feasible; its validity and accuracy in hospital-level or aggregated data is questionable.
Some researchers have argued that hours per patient day is the most precise measure of the amount of nursing care provided to patients (Budreau et al. 1999). However, hours per patient day do not accurately measure the impact of admissions, discharges, and transfers on the workload of nurses. Unruh and Fottler (2006) have demonstrated that nurse staffing measures that do not adjust for patient turnover underestimate nursing workload and overstate RN staffing levels. While prospective unit-level databases such as CalNOC often include measures of admissions, discharges, and transfers, administrative databases do not include such measures.
While we would like to conclude by recommending a single measurement strategy for studies of nurse staffing, such a recommendation is not possible. Researchers often are limited by data availability, and thus the ideal measures of nurse staffing might not be obtained for every study. Although OSHPD data appear more dispersed than CalNOC data, potentially indicating more measurement error, and the AHA and OSHPD data do not limit their staffing data to direct patient care, the OSHPD and AHA datasets are longitudinal and easily obtained. These datasets can be linked to secondary data on patient outcomes, such as the Nationwide Inpatient Sample and the OSHPD Patient Discharge Data (e.g., Needleman et al. 2001; Mark et al. 2004). Thus, despite their limitations, these datasets should and will continue to be used in research. Researchers should be cognizant of the limitations of these datasets and should consider indices to adjust for the impact of patient turnover on nursing workload.
There is potential for greater use of unit-level databases collected specifically to analyze nurse staffing and quality of care. The CalNOC project is one such effort. Others include the American Nurses Association's National Database of Nursing Quality Indicators (NDNQI), the Department of Veterans Affairs’ VA Nursing Outcomes Database (VANOD), and the Military Nursing Outcomes Database (MilNOD). There are two primary limitations of these data projects at this time. First, the CalNOC and NDNQI databases depend on voluntary submissions from hospitals, which may affect the representativeness of the data. As noted above, small and for-profit hospitals are under-represented in the CalNOC data. Hospitals that choose to participate in these data collection efforts may be more interested in quality measurement and improvement, and thus the databases represent better-staffed hospitals. If the data do not represent the full spectrum of staffing patterns, research findings are limited. Second, these data are not readily available to researchers. CalNOC has begun to develop protocols for permitting other researchers to access the data, and CalNOC measures are now being used in the California Hospital Assessment and Reporting Taskforce (CHART) public reporting project. As data access barriers are addressed, these databases are likely to be more widely used, providing more information for our understanding of nurse staffing patterns and the relationship between nursing and patient outcomes.
While it would be laudable to bridge the gap between the measure of nurse staffing used in decision making and policy—patient-to-nurse ratios—and the more-reliable hours per patient day, a firm linkage between these measures cannot be established at this time. More importantly, it is unlikely that the disconnect between these measures can be corrected in large, multi-hospital, multi-year databases. Whether this problem has important policy and decision-making ramifications at this time is unknown. It is important to recognize that significant and substantive differences were found between these commonly used and typically considered equivalent measures. Efforts to synthesize studies using these widely varied measures need to be undertaken with caution, noting that findings using one type of measure may not be generalizable across all types of measures.
Acknowledgments
Joint Acknowledgment/Disclosure Statement: The research underlying this paper was supported by the Gordon & Betty Moore Foundation, the California Endowment, and the California HealthCare Foundation.
Disclosures: Drs. Donaldson, Aydin, and Brown are key personnel involved in the CalNOC. They have a professional interest in the Coalition but do not have any financial gain associated with the Coalition.
Supplementary material
The following supplementary material for this article is available online:
Fig. S1. Histogram of Critical Care Total Nursing Hours per Patient Day, CalNOC and OSHPD, 2002
Fig. S2. Scatterplot of Critical Care Total Nursing Hours per Patient Day, CalNOC and OSHPD, 2002.
Fig. S3. Histogramof Medical–Surgical Total Nursing Hours per Patient Day, CalNOC and OSHPD, 2002.
Fig. S4. Scatterplot of Medical–Surgical Total Nursing Hours per Patient Day, CalNOC and OSHPD, 2002.
Fig. S5. Scatterplot of Medical–Surgical RN Hours per Patient Day, CWI and OSHPD, 2000.
Table S1. Summary of the AHA and OSHPD Data, 2000.
Table S2. Summary Data Comparing CWI and OSHPD Medical–Surgical Data, 2000.
Appendix SA1: Author matrix
This material is available as part of the online article from http://www.blackwell-synergy.com/doi/abs/10.1111/j.1475-6773.2008.00850.x (this link will take you to the article abstract).
Please note: Blackwell Publishing is not responsible for the content or functionality of any supplementary materials supplied by the authors. Any queries (other than missing material) should be directed to the corresponding author for the article.
References
- Aiken LH, Clarke SF, Sloane DM, Sochalski J, Silber JH. Hospital Nurse Staffing and Patient Mortality, Nurse Burnout, and Job Dissatisfaction. Journal of the American Medical Association. 2002;288(16):1987–93. doi: 10.1001/jama.288.16.1987. [DOI] [PubMed] [Google Scholar]
- Aiken LH, Sochalski J, Anderson GF. Downsizing the Hospital Nursing Workforce. Health Affairs. 1996;15(4):88–92. doi: 10.1377/hlthaff.15.4.88. [DOI] [PubMed] [Google Scholar]
- American Hospital Association (AHA) The AHA Annual Survey Database Fiscal Year 1997 Documentation. Chicago: Health Forum; 1999. [Google Scholar]
- Anderson GF, Kohn LT. Hospital Employment Trends in California, 1982–1994. Health Affairs. 1996;15(1):152–8. doi: 10.1377/hlthaff.15.1.152. [DOI] [PubMed] [Google Scholar]
- Aydin CE, Bolton LB, Donaldson N, Brown DS, Buffum M, Elashoff JD, Sandhu M. Creating and Analyzing a Statewide Nursing Quality Measurement Database. Journal of Nursing Scholarship. 2004;36(4):371–8. doi: 10.1111/j.1547-5069.2004.04066.x. [DOI] [PubMed] [Google Scholar]
- Budreau G, Balakrishnan R, Titler M, Hafner M. Caregiver-Patient Ratio: Capturing Census and Staffing Variability. Nursing Economics. 1999;17(6):317–24. [PubMed] [Google Scholar]
- Donaldson N, Bolton LB, Aydin C, Brown D, Elashoff J, Sandhu M. Impact of California's Licensed Nurse–Patient Ratios on Unit-Level Nurse Staffing and Patient Outcomes. Policy, Politics, and Nursing Practice. 2005;6(3):1–12. doi: 10.1177/1527154405280107. [DOI] [PubMed] [Google Scholar]
- Eldridge LP. Hours Measures for Productivity Measurement and National Accounting. Paris: National Institute for Statistics and Economic Studies; 2004. [Accessed on December 10, 2007]. Paris Group Meeting, Lisbon, 2004. at http://www.insee.fr/en/nom_def_met/colloques/citygroup/pdf/US%203%20ParisGroup2004%20less%20AT.pdf. [Google Scholar]
- Jiang JH, Stocks C, Wong CJ. Disparities between Two Common Data Sources on Hospital Nurse Staffing. Journal of Nursing Scholarship. 2006;39(2):187–93. doi: 10.1111/j.1547-5069.2006.00099.x. [DOI] [PubMed] [Google Scholar]
- Lang TA, Hodge M, Olson V, Romano PS, Kravitz RL. Nurse–Patient Ratios: Systematic Review on the Effects of Nurse Staffing on Patient, Nurse Employee, and Hospital Outcomes. Journal of Nursing Administration. 2004;34(7–8):326–37. doi: 10.1097/00005110-200407000-00005. [DOI] [PubMed] [Google Scholar]
- Mark BA, Harless DW, McCue M, Xu Y. A Longitudinal Examination of Hospital Registered Nurse Staffing and Quality of Care. Health Services Research. 2004;39(2):279–300. doi: 10.1111/j.1475-6773.2004.00228.x. Erratum in: Health Services Research (2004), 39(5): 1629. [DOI] [PMC free article] [PubMed] [Google Scholar]
- Needleman J, Buerhaus PI, Mattke S, Stewart M, Zelevinsky K. Nurse Staffing and Patient Outcomes in Hospitals. Washington, DC: US Department of Health and Human Services, Health Resources and Service Administration, Bureau of Health Professions; 2001. [Google Scholar]
- Needleman J, Buerhaus PI, Mattke S, Stewart M, Zelevinsky K. Nurse-Staffing Levels and The Quality of Care in Hospitals. New England Journal of Medicine. 2002;346:1719–22. doi: 10.1056/NEJMsa012247. [DOI] [PubMed] [Google Scholar]
- Office of the City Auditor, City of San Jose. An Audit of the San Jose Police Department – Communications Division's Staffing and Scheduling. San Jose, CA: City of San Jose; 1995. [Google Scholar]
- Seago JA, Spetz J, Coffman J, Rosenoff E, O'Neil E. Minimum Nurse to Patient Ratios: The California Workforce Initiative Survey. Nursing Economics. 2003;21(2):65–70. [PubMed] [Google Scholar]
- Spetz J. Hospital Employment of Nursing Personnel: Has There Really Been a Decline? Journal of Nursing Administration. 1998;28(3):20–7. doi: 10.1097/00005110-199803000-00006. [DOI] [PubMed] [Google Scholar]
- Spetz J, Seago JA, Coffman J, Rosenoff E, O'Neil E. Minimum Nurse Staffing Ratios in California Acute Care Hospitals. San Francisco: California HealthCare Foundation; 2000. [Google Scholar]
- Unruh LY, Fottler MD. Patient Turnover and Nursing Staff Adequacy. Health Services Research. 2006;41(2):599–612. doi: 10.1111/j.1475-6773.2005.00496.x. [DOI] [PMC free article] [PubMed] [Google Scholar]
- Unruh LY, Fottler MD, Talbott LL. Improving Nurse Staffing Measures: Discharge Day Measurement in “Adjusted Patient Days of Care. Inquiry. 2003;40(3):295–304. doi: 10.5034/inquiryjrnl_40.3.295. [DOI] [PubMed] [Google Scholar]
Associated Data
This section collects any data citations, data availability statements, or supplementary materials included in this article.