

Abstract
Perilesion depolarisations, whether transient anoxic depolarisation (AD) or spreading depression (SD), occur in stroke models and in patients with acute brain ischaemia, but their contribution to lesion progression remains unclear. As these phenomena correspond to waves of cellular depolarisation, we have developed a technique for their live imaging with a fluorescent voltage-sensitive (VS) dye (RH-1838). Method development and validation were performed in two different preparations: chicken retina, to avoid any vascular interference; and cranial window exposing the cortical surface of anaesthetised rats. Spreading depression was produced by high-K medium, and AD by complete terminal ischaemia in rats. After dye loading, the preparation was illuminated at its excitation wavelength and fluorescence changes were recorded sequentially with a charge-coupled device camera. No light was recorded when the VS dye was omitted, ruling out the contribution of any endogenous fluorophore. With both preparations, the changes in VS dye fluorescence with SD were analogous to those of the DC (direct current) potential recorded with glass electrodes. Although some blood quenching of the emitted light was identified, the VS dye signatures of SD had a good signal-to-noise ratio and were reproducible. The changes in VS dye fluorescence associated with AD were more complex because of additional interferents, especially transient brain swelling with subsequent shrinkage. However, the kinetics of the AD-associated changes in VS dye fluorescence was also analogous to that of the DC potential. In conclusion, this method provides the imaging equivalent of electrical extracellular DC potential recording, with the SD and AD negative shifts translating directly to fluorescence increase.
Keywords: anoxic depolarisation, chicken retina, cortical spreading depression, fluorescence, live imaging, voltage-sensitive dye
Introduction
Studies with models showed that recurrent spreading depression (SD, waves of cellular depolarisation that propagate slowly across grey matter) occurs in the vicinity of the ischaemic core and promotes lesion progression (Mies et al, 1993; Obrenovitch, 1995; Selman et al, 2004; Strong et al, 2007). Perilesion SD was also demonstrated in patients with acute brain lesions subsequent to haemorrhagic ischaemia or head trauma (Strong et al, 2002; Dreier et al, 2006). Accordingly, it is clinically relevant and timely to understand how SD contributes to lesion progression, and this question may be answered with stroke models and live imaging methods to visualise the ischaemic core and SD on the cortical surface.
The characterisation of SD waves traditionally relies on the recording of extracellular direct current (DC) potential from the cerebral cortex and other preparations, which is an accurate and suitable approach, but lacks spatiotemporal resolution. More recently, attempts have been made to visualise cortical perilesion SD by imaging associated changes in blood flow (Strong et al, 2006), NADH (Strong et al, 1996; Hashimoto et al, 2000), or oxygenation (Ba et al, 2002; Dunn et al, 2003) in brain tissue . But these methods are indirect and the kinetics of the recorded changes are complex and different from that of the initial phenomenon (Fabricius et al, 1995; Obrenovitch et al, 2004). The purpose of this study was to develop a novel technique, based on live imaging of a voltage-sensitive (VS) dye, to image cortical depolarisations (i.e., SD and anoxic depolarisation (AD)) directly. We have selected the fluorescent blue dye, RH-1838, which has favourable excitation and emission wavelength, binds to cellular membranes, and whose fluorescence increases with reduced cellular membrane potential (Grinvald and Hildesheim, 2004). Development and validation of the method were performed using a closed cranial window exposing the cortex of anaesthetised rats. To help the identification of any potential vascular interference, the rat cortex VS dye signals were compared with those from a chicken retina preparation, which is devoid of any vascular compartment. We show that this method provides the imaging equivalent of electrical extracellular DC potential recording, with the characteristic DC potential negative shifts associated with AD and SD translating directly to fluorescence increase.
Materials and methods
In Vitro Chicken Retina Experiments
Chicken retina preparation
Male domestic chickens (Isabrown, 7 to 28 days old) were killed by cervical dislocation, decapitated, and the left eye dissected rapidly. The eye was then cut at the equator, the vitreous humour sucked away, and the posterior eyecup transferred to a tissue chamber. The preparation was superfused (1 mL/min flow rate) with standard Ringer solution (100 mmol/L NaCl, 6 mmol/L KCl, 1 mmol/L MgSO4, 30 mmol/L NaHCO3, 1 mmol/L NaH2PO4, 1 mmol/L CaCl2, and 20 mmol/L glucose, bubbled with 95% O2 and 5% CO2). The temperature of the chamber was continuously monitored and kept at 32°C. Spreading depression was elicited every 15 mins by rapid ejection of 1 μL of 0.1 mol/L KCl, through a stainless-steel microcannula connected to a syringe pump (CMA/100, CMA/Microdialysis, Solna, Sweden), towards the same retina site near the edge of the eyecup.
Electrophysiological recording of spreading depression
A glass capillary electrode (10 μm tip diameter) filled with 0.1 mol/L KCl was inserted into the inner plexiform layer of the retina. The extracellular DC potential was recorded by amplifying the potential between this electrode and a reference (Ag/AgCl) incorporated into the bottom of the tissue chamber, using a high-impedance input preamplifier (NL 834) and associated filters and amplifiers (NL 125, NL 106; Neurolog System, Digitimer Ltd, Welwyn Garden City, UK). The resulting signal was continuously acquired, displayed, and stored using a personal computer equipped with an analog/digital (A/D) converter (DASH16, Metrabyte, Keithley Instruments Ltd, Reading, UK), running a dedicated application program written in ASYST (MacMillan Software Co., Keithley Instruments Ltd).
Imaging of changes in the retinal intrinsic optical signal (IOS) associated with spreading depression
The retina was illuminated using a white cold light source (Highlight 3001, Olympus UK Ltd, Southall, UK), with the light delivered through an optic fiber guide orientated at 45° relative to the perfusion medium surface. The reflected light was recorded with a CCD (charge-coupled device) monochrome camera (Qimaging, QICAM model QIC-F-M-12; 12-bit digital output; Media Cybernetics UK, Marlow, UK) attached to a stereomicroscope (×3.2 magnification; MZ12.5, Leica Microsystems UK Ltd, Milton Keynes, UK). Image sequences were taken at 2 frame/sec over 3 mins, with an exposure time of 200 ms (1×1 binning; 650 gain). Image acquisition and analysis were performed with Image-ProPlus software (version 5.0; Media Cybernetics UK). For each sequence, an area of interest (AOI) parallel to the SD wave front was delineated manually and, for each picture within the sequence, the grey levels of the pixels constituting the AOI were averaged. The changes in this value were then plotted against time (i.e., 180 data points over 3 mins). All corresponding data are given as mean±s.d.
Retinal spreading depression imaging with a fluorescent, voltage-sensitive dye
The VS dye (RH-1838, Optical Imaging Ltd, Rehovot, Israel) was dissolved in standard Ringer solution and its concentration was adjusted in such a way that, after 20× dilution, the optical density measured at 580 nm with a spectrophotometer (Helios Gamma, Spectronic Analytical Instruments, Leeds, UK) was between 0.110 and 0.130. The dye solution was stored at −20°, and used repeatedly for up to five experiments. The retina held in the tissue chamber was superfused with the VS dye solution for 15 mins at 1 mL/min. This was followed by a 15-min washout with standard Ringer solution, before initiation of the first SD. During SD imaging, the preparation was illuminated continuously with a high-power LED spotlight (625 nm peak wavelength; SLS-0307-A, Mightex, Pleasanton, CA, USA) driven by a computer-controlled power supply (Sirius LED controller SLC-SA04-U; Mightex). The emitted fluorescence passed through an emission filter (>670 nm; 695AF55, Omega Optical, Brattleboro, VT, USA) before reaching a highly sensitive, monochrome CCD camera (Pantera 1M30, Dalsa, Gröbenzell, Germany) attached to a stereomicroscope (×2 magnification, MZ12.5, Leica). Image sequences were taken at 2 frame/sec for 3 mins, with an exposure time of 498 ms (1×1 binning; maximum analog gain, 4,095; 4× digital output gain mode). Each 180-frame sequence was analysed with image-Pro Plus as follows: (i) in each picture constituting the sequence, the pixel grey levels were averaged within an AOI and delineated manually and parallel to the SD wave front (Figure 2A inset); (ii) these values were plotted against time, hence providing the kinetics of changes in fluorescence intensity within the AOI; (iii) the corresponding trace was corrected by subtracting a linear drift whose slope and intercept were calculated from the averaged grey levels in the AOI for the first and last frames of the given sequence. For comparison with the DC potential and IOSs (Figure 2), the data were treated further as follows: all traces (i.e., VS dye, DC potential, and IOS data) were converted to percentage of the maximum change evoked by the corresponding SD, and to allow the calculation and plotting of averaged traces, the data from individual experiments were synchronised in such a way that the maximum rate of change reflecting depolarisation occurred at the same time point (see Figure 2). All corresponding data are given as mean±s.d.
Figure 2.
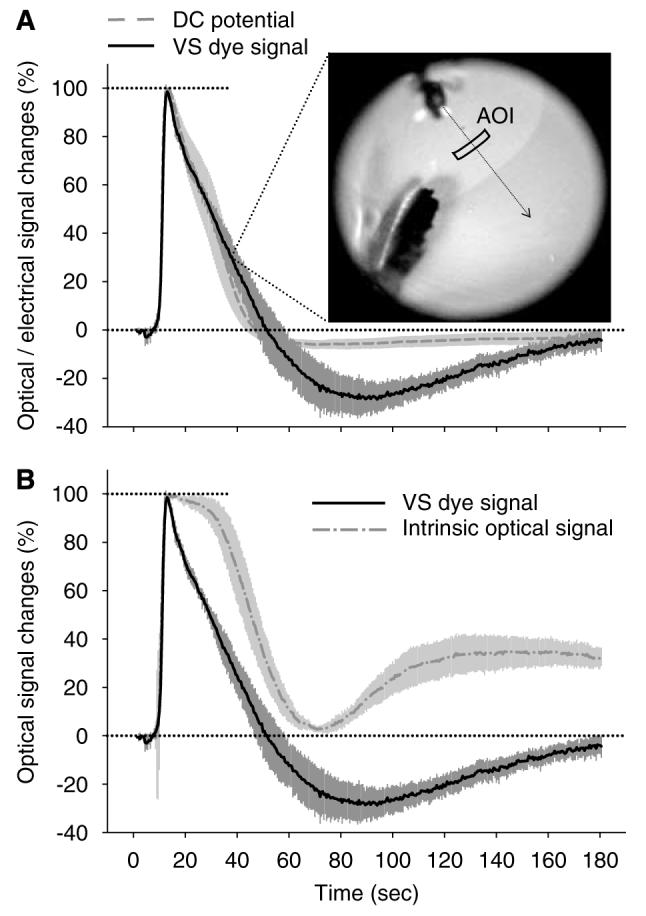
Click here to view a video of this figure (web version only). Kinetics of changes in VS dye fluorescence associated with retinal SD, and its comparison with corresponding changes in extracellular DC potential (A, electrical signal) and IOS (B). In panel A, the inset is a representative, unprocessed image of the VS dye fluorescence captured as an SD wave propagated across the retina; it also shows the AOI used to generate the corresponding kinetics of change in fluorescence intensity. In panels A and B, each trace is the average of several signals obtained from separate experiments (n=5 for VS dye signal; n=6 for DC potential and IOS), plotted as mean±s.d. after their standardisation, conversion to percentage of the maximum change evoked by the corresponding SD, and synchronisation (see section Retina SD imaging with a fluorescent, voltage-sensitive dye). In accordance with previous reports, the DC signal was inverted in such a way that negative shift points upward.
Closed Cranial Window in Anaesthetised Rats
Surgical preparation
All animal procedures were authorised by the University Ethical Review Panel, and performed in accordance with the British Home Office Animals (Scientific Procedures) Act 1986. Adult male Spague–Dawley rats (260 to 380 g; Harlan UK Ltd, Bicester, UK) were anaesthetised with 1.5% to 2.0% halothane in N2O:O2 (2:1) and allowed to breathe spontaneously throughout the experiment. Body temperature was kept between 37.1°C and 37.4°C using a heating pad, feedback-controlled by a rectal probe. In the brain imaging experiments, the left femoral vein was cannulated and the intravenous line used for the injection of 1-mL air embolus to end each experiment. This procedure stopped cardiac output instantly, thereby inducing a well-standardised and reproducible terminal, global ischaemia. In the other experiments (i.e., recording of DC potential with or without laser Doppler flowmetry (LDF)), the terminal, global ischaemia was induced by halothane overdose. Once the animal was placed in a stereotactic frame, a high-precision electrical drill (Technobox 810, Bien-Air Dental SA, Bienne, Switzerland) was used to remove the entire right parietal bone. Accordingly, the surface of exposed cortex, and thereby the volume of the cortical chamber, was well standardised throughout the study. Overheating of the bone during drilling was avoided by constant irrigation of the bur with saline. A doughnut-shaped ring of acrylic dental cement was built around the craniotomy, incorporating the perfusion inlet and outlet, and a glass capillary connected to a syringe pump (CMA/100, CMA/Microdialysis). The latter was used to elicit SD by ejection of 1 μL of 1 mol/L KCl onto the posterior cortical surface. The chamber was filled with artificial cerebrospinal fluid (aCSF: 126.6 mmol/L NaCl, 3 mmol/L KCl, 1.5 mmol/L CaCl2, 1.2 mmol/L MgCl2, 24.5 mmol/L NaHCO3−, 6.7 mmol/L urea, and 3.7 mmol/L glucose, bubbled with 95% O2 and 5% CO2), the dura carefully removed, and the cranial window closed by gluing a piece of glass cut from a microscopic coverslip (17×11 mm) to the dental cement ring with fast cure epoxy glue (Permabond, Eastleigh, UK). The glass coverslip had a 1-mm-diameter hole, drilled 2 to 3 mm anterior to the SD triggering capillary tip, through which recording devices could be inserted (see sections Electrophysiological recording of spreading depression and Monitoring of cortical blood flow below) (Figure 1). The pressure within the chamber was kept at 4.5 mm Hg by elevating the tip of the outlet tube 6 cm above the brain surface. Unless otherwise stated, the cranial window was continuously perfused at 25 μL/min with aCSF using a peristaltic pump (Gilson Minipuls 3, Anachem Ltd, Luton, UK). Spreading depression waves were triggered every 15 to 21 mins.
Figure 1.
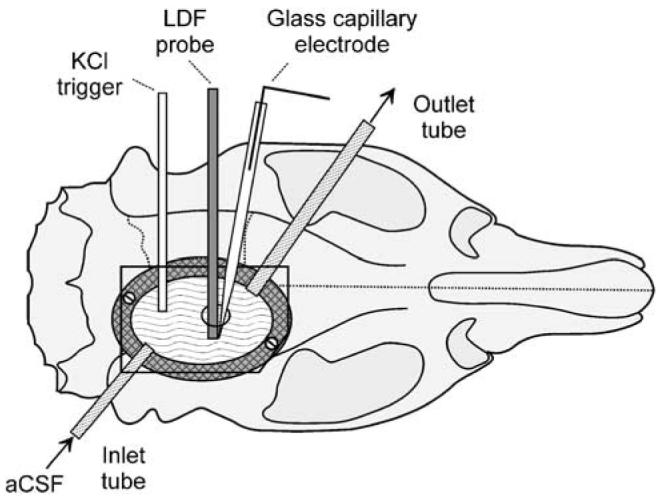
Diagram of the closed cranial window prepared in anaesthetised rats for the imaging of KCl-induced spreading depression using a fluorescent VS dye. Note the hole in the upper glass window, used for the recording of the extracellular DC potential and/or LDF. aCSF, artificial cerebrospinal fluid; LDF, laser-Doppler flowmetry.
Electrophysiological recording of spreading depression
A glass capillary electrode (20 μm tip diameter), filled with aCSF and held in a micromanipulator tilted longitudinally at an angle of 22.5°, was inserted through the hole of the glass window. Great care was taken with regard to the depth of implantation (1.2 to 1.4 mm below the cortical surface), as the DC potential signature of SD varies with the recording depth (Richter and Lehmenkühler, 1993). Once in place, the glass capillary was sealed to the glass coverslip with dental cement. The Ag/AgCl reference electrode was implanted under the skin of the animal's neck. The DC potential was recorded as described previously for the chicken retina.
Cortical spreading depression imaging with a fluorescent, voltage-sensitive dye
The VS dye solution, prepared as previously described for the chicken retina, was perfused and recirculated through the cranial chamber for 2 h at 80 μL/min. A 35-min washout with aCSF preceded brain imaging. VS dye SD imaging was as described for the retina, except that the camera was fitted with a macro lens (×2 magnification, CCS SE-16SMS; Firstsight Vision, Tongham, UK), and the imaging technique optimised with the following changes: (i) an excitation filter (620 to 640 nm bandpass; 3RD620-640, Omega Optical Inc.) was fitted in front of the LED spot light; (ii) the exposure time was reduced to 100 ms, and the illumination of the preparation was restricted to this time by using the same external trigger to synchronise camera exposure with illumination; and (iii) the duration of each image sequence was increased from 3 to 10 mins, the latter corresponding to 1,200 pictures taken at 2 frame/sec. Consecutive 10 mins, 1,200-image sequences were captured by alternative imaging of the cortical surface with or without SD elicitation. Altogether, four SD waves, the terminal ischaemia AD, and five unstimulated sequences, preceding each SD/AD sequence, were acquired. A last image sequence recorded the changes in fluorescence after the AD sequence (post-mortem sequence).
Image analysis of cortical SD was essentially as described above for the chicken retina (Figure 3). The first and second SD (SD1 and SD2, respectively) and the AD were comprehensively analysed in each experiment. Our analysis focused on SD1 and SD2 because the corresponding recordings of DC potential and LDF showed slightly different kinetics, especially during the recovery phase (Figure 4). Data for the third and fourth SD are not shown as they were very similar to SD2. Corresponding data are given as mean±s.d. Analysis of variance (ANOVA), with a least significant difference (LSD) post hoc test (confidence level determined at P < 0.05) (SPSS software), was used for the comparison of SD1 with SD2, SD with AD, and VS dye signal with the DC potential, when applicable.
Figure 3.

Click here to view a video of this figure (web version only). Picture of the cortical region under study taken shortly after loading of the tissue with the fluorescent VS dye (A), and a representative image sequence of the first KCl-induced SD obtained by recording the changes in dye fluorescence during 60 secs after SD elicitation (B1–7). The tip of the glass capillary for KCl-induced SD elicitation was positioned in the upper left corner of the field of view, which was the same for all pictures. As picture A was unprocessed, it shows the true fluorescence signal as it was captured by the camera and displayed on the computer screen. Pictures B1–7 were modified by background subtraction (background taken as average of the first three and last three images of the sequence), followed by contrast enhancement to cover the full grey level range (12-bit, 0 to 4,095). These pictures show the AOI drawn manually from image B4 as a polygon parallel to the SD wave front, and used to generate the kinetics of changes in fluorescence associated with SD (see Figure 4). The grey levels used for computation of these kinetics were taken from unprocessed, original images.
Figure 4.
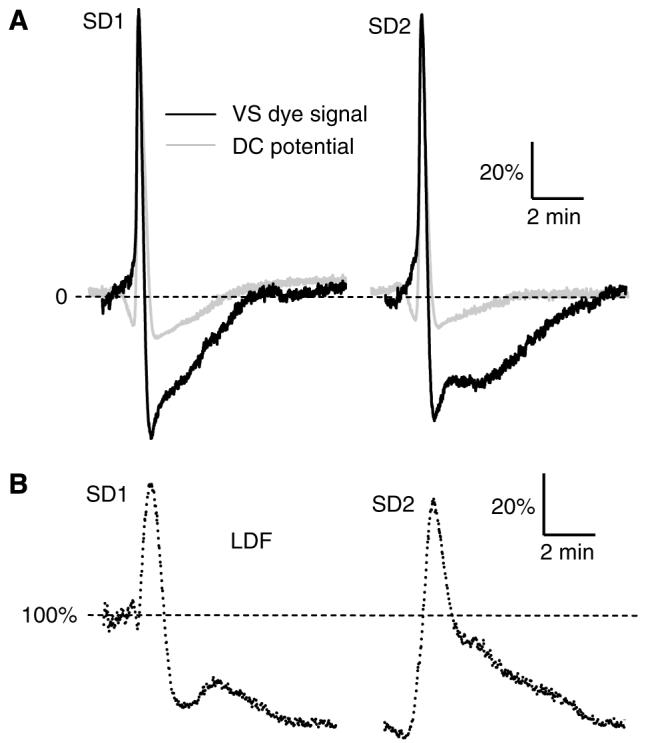
Kinetics of changes in VS dye fluorescence associated with cortical SD in rats (A, black trace), and its comparison with corresponding changes in extracellular DC potential (A, light-grey trace) and lCBF recorded by LDF (B). In accordance with previous reports, the DC signal was inverted in such a way that negative shifts point upwards. Each trace was averaged from several signals obtained from separate experiments (n = 6 for each signal) after their standardisation (i.e., data recorded during the first 3 secs offset to 0; correction of the VS dye signal for drift in fluorescent intensity; expression of the recorded sequences as percentage of their maximal peak amplitude) and synchronisation. For the synchronisation of the DC potential and VS dye signal, the points for maximal rate of depolarisation were aligned. The LDF traces (B) were synchronised between each other by aligning the points of maximal rate of LDF signal increase. The resulting averaged LDF trace was then synchronised to the VS dye signal, taking into account the rate of SD propagation and the distance between the LDF probe tip and the AOI used to generate the VS dye kinetics.
Monitoring of cortical blood flow
Changes in local cerebral blood flow (lCBF) associated with SD were recorded by LDF, together with either the extracellular DC potential (two experiments) or VS dye fluorescence (four experiments). The LDF needle probe (Probe 411 connected to PeriFlux 5000; Perimed UK Ltd, Bury St Edmunds, UK), tilted longitudinally at an angle of 20°, was lowered through the hole in the glass coverslip in such a way that its tip was positioned right above the cortical surface, avoiding any large pial vessels. Once in place, it was sealed as described above for the DC potential glass capillary, using as little dental cement as possible to maximise the coverslip surface available for cortical imaging. The LDF signal was digitized and acquired, together with the DC potential when applicable, essentially as described above in the section Electrophysiological recording of SD. Calculations and statistical analysis were performed as described above in the section Cortical SD imaging with a fluorescent voltage-sensitive dye.
Results
Electrical and Optical Signals Associated with Retinal Spreading Depression
As previously reported (Dahlem and Müller, 1997; Martins-Ferreira et al, 2000), KCl-induced retinal SD was associated with a transient negative shift of the DC potential (maximum amplitude = −17.9±2.3 mV, n = 6) and a transient increase of the IOS (intensity of reflected light). The latter change was quite marked, as it was clearly visible with the naked eye (maximum amplitude = 366.7±80.4 Gy level, n=6; i.e., 9.0% of the 0 to 4,095 QICAM camera range). For both signals, the amplitude and kinetics of changes for repeated SD were reproducible within each experiment. With regard to the VS dye signal, as expected from the dye characteristics (i.e., fluorescence of RH-1838 incorporated into cellular membranes increases with depolarisation), SD was detected as a transient increase in the dye fluorescence (maximum amplitude = 99.5±31.8 Gy level, n = 5; i.e., 2.4% of the 0 to 4,095 DALSA camera range) (Figure 2A, inset). The kinetics of changes in VS dye fluorescence for repeated SD were also reproducible within each experiment, except for the peak amplitude, which was progressively smaller due to a gradual decrease of baseline fluorescence during the course of the experiment. In our conditions (630±20 nm excitation; > 670 nm emission), no signal was detectable when the VS dye was omitted (data not shown), indicating the absence of interfering endogenous fluorescence.
Expressing the kinetics of DC potential and optical signals as percentage of the respective maximum deflection associated with SD, with subsequent synchronisation of the resulting traces (see Materials and methods), revealed that all signals had virtually identical kinetics for the depolarisation phase (Figure 2). In contrast, the repolarisation and subsequent return to baseline showed different kinetics. Even though the rate of repolarisation of the DC and VS dye signals appeared very similar, a marked post-SD ‘hyperpolarisation’ was a specific feature only for the VS dye fluorescence signal (Figure 2A). In comparison with the DC potential and VS dye signal, the IOS displayed a delayed ‘repolarisation’, followed by a brief return to baseline, preceding a progressive positive shift that persisted 31% to 33% above baseline, until the end of the 3-min observation period (Figure 2B).
Closed Cranial Window in Anaesthetised Rats
Spreading depression
Three distinctive cortical events were analysed in detail in the rat experiments: the KCl-elicited SD1 and SD2 (Figure 3), and AD subsequent to terminal, complete ischaemia at the end of each experiment (Figure 5). The rates of SD propagation, computed from the VS dye data, were 2.72±0.43 and 3.36±0.20 mm/min (n = 6) for SD1 and SD2, respectively, which agrees with the previous determinations performed with multiple DC potential electrodes implanted in the neocortex of anaesthetised rats (McLachlan, 1992). Quantitative features of SD1 and SD2, calculated from VS dye and DC potential data, are tabulated in Table 1.
Figure 5.
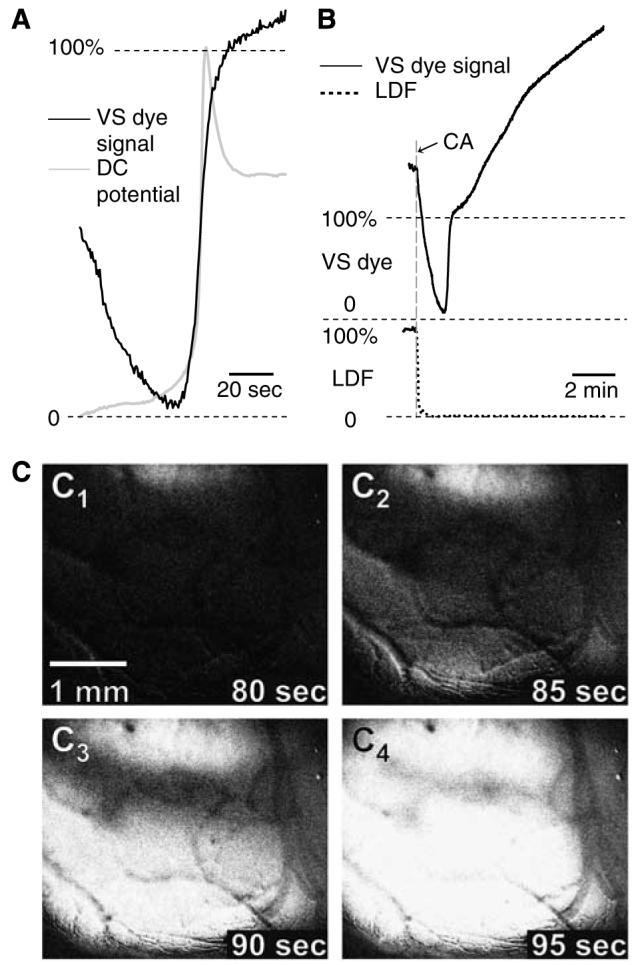
Kinetics of changes in VS dye fluorescence associated with AD in rats (A and B, black trace), and its comparison with corresponding changes in extracellular DC potential (A, light grey trace) and lCBF (B, dotted line). (C) The images C1–4 were taken from a representative sequence of cardiac arrest-induced AD, obtained by recording the changes in VS dye fluorescence from 80 to 95 secs after cardiac arrest (CA). Note the different timescales in (A) and (B): In (A), only a 90-sec time frame is displayed to allow better visualization of the AD kinetics; panel B shows the evolution of the VS dye signal during 10 mins to reveal the sustained post-mortem increase in VS dye fluorescence. In accordance with previous reports, the DC signal was inverted in such a way that negative shifts point upwards. Each trace was averaged from several signals obtained from separate experiments (n = 6 for VS dye signal, n = 5 for DC potential, and n = 4 for LDF) after their standardisation (i.e., data recorded during the first 3 secs offset to 0; correction of the VS dye signal for fluorescence drift, using the 10-min image sequence that was captured immediately before terminal ischaemia; expression of the recorded sequences as percentage of their maximal peak amplitude) and synchronisation (see Figure 4 legend for details). Given the sudden drop in the VS dye signal immediately after cardiac arrest, the 0% and 100% for this variable were defined as the beginning and peak amplitude of the AD signature, respectively, in panels A and B.
Table 1.
Quantitative features of the DC potential and VS dye signal of SD1 and SD2 in the rat closed cranial window preparation
| Feature | SD no. | DC potential | VS dye signal | ||
|---|---|---|---|---|---|
| Duration (secs) | SD1 | 18.8±6.2 | 14.4±1.6 |
|
|
| SD2 | 17.5±6.1 | 16.5±3.0 | |||
| Max. rate of depolarisation (%/sec) | SD1 | 38.2±13.5 | 20.5±6.6* | ||
| SD2 | 28.6±9.0 | 18.4±3.4* | |||
| Max. rate of repolarisation (%/sec) | SD1 | −6.5±2.1 | −9.2±1.9* | ||
| SD2 | −6.9±2.1 | −9.5±2.6 | |||
| Post-SD hyperpolarisation (%) | SD1 | −17.6±6.1 | −55.6±13.3** | ||
| SD2 | −14.8±7.8 | −50.4±18.3** | |||
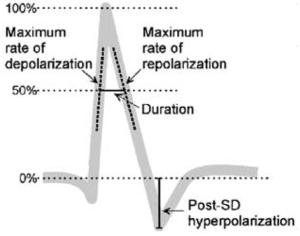
All data are expressed relative to SD amplitude (see inset), except for SD duration given in seconds.
Data are mean±s.d. Analysis of variance (ANOVA) was used for the comparison of VS dye signal with the DC potential
P<0.05
P<0.01
Comparison between SD1 and SD2
The changes in DC potential, VS dye fluorescence, and LDF, recorded for SD1 and SD2, displayed obvious similarities, including (i) rate of depolarisation for both DC potential and VS dye signals (Figure 4A), (ii) peak amplitude for DC potential (SD1, 18.7±1.8 mV; SD2, 19.0±2.7 mV, n=6, P > 0.50) and VS dye fluorescence (SD1, 89.0±11.2 Gy level; SD2, 92.4±15.8 Gy level, n=6, P > 0.50), and (iii) maximum hyperaemia as measured by LDF and expressed as percentage of basal level (SD1, 142.9%±25.9%; SD2, 137.6%±25.5%; n=6; P > 0.50; Figure 4B). However, some differences were also observed. The amplitude of the post-SD ‘hyperpolarisation’ appeared slightly more pronounced with SD1 than SD2, both for the DC potential (SD1, 2.5±1.2 mV; SD2, 1.9±1.3 mV; n=6; P < 0.47) and VS dye fluorescence (SD1, 48.3±7.1 Gy level; SD2, 44.6±10.5 Gy level; n=6; P < 0.49), but the difference was not statistically significant. After SD1, LDF indicated a long-lasting hypoperfusion (63.6%±15.0%, n = 6), which did not return to baseline by the time SD2 was initiated. In addition, recovery from hyperaemia was steep after SD1, but more progressive after SD2 (Figure 4B).
Comparison between DC potential and VS dye signal
Plotting the signals after synchronisation and their expression as percentage of maximum deflection (see Retina section for details) showed that the kinetics of changes in the DC potential and VS dye signal associated with SD were quite similar, especially with regard to the depolarisation phase, and for both SD1 and SD2 (Figure 4A). The most conspicuous difference between the two SD signatures was related to the post-SD ‘hyperpolarisation’, which was much more pronounced for the VS dye signal than the DC potential (SD1, 55.6%±13.3% VS dye signal versus 17.6%±6.1% DC potential, n=6, P < 0.001; SD2, 50.4%±18.3% VS dye signal versus 14.8%±7.8% DC potential, n=6, P < 0.001). The VS dye signal then returned to baseline more gradually than the DC potential, in particular for SD2 (Figure 4A). Another difference between the two SD signatures was the consistent pre-SD ‘hyperpolarisation’ that was visible on the DC potential, but which did not occur on the corresponding VS dye signal. The quantitative analyses of specific features of the DC potential and VS dye SD signatures revealed a slower maximum rate of depolarisation and a more rapid maximum rate of repolarisation with the VS dye, whereas the shorter SD duration of the VS dye signature did not reach statistical significance (Table 1).
Potential interference of SD-associated hyperaemia with the VS dye signal
To examine the possibility of blood/haemoglobin interference with the VS dye fluorescence, the kinetics of SD-induced changes in local cerebral blood flow (LCBF) (i.e., LDF signal) were also analysed (Figure 4B). Our LDF data confirmed those previously reported; that is, SD was associated with a marked transient hyperaemia, followed by sustained hypoperfusion (Fabricius et al, 1995). The method that was used to synchronise LDF and VS dye signals involved measurement of (i) the distance between the VS dye AOI (used to generate the kinetics of changes in fluorescence from the image sequence) and the region where LDF was recorded (1.32±0.31 mm, n = 6) and (ii) the rate of SD propagation (SD1: 3.20±0.69 mm/min; SD2: 3.28±0.31 mm/min; n = 6). With this synchronisation method, the peak of VS dye fluorescence indicative of SD coincided approximately with the maximal hyperaemia. But this may not reflect the true temporal relationship for the following reasons: (i) the distance from VS dye AOI to LDF probe tip could not be determined accurately, because the latter was occasionally masked from the field of view by the dental cement used to seal the probe to the cranial window; (ii) our calculation did not take into account the tilt of the LDF probe illuminating the cortical surface, away from the AOI (i.e., effective LDF recording site was probably closer to the VS dye AOI); and (iii) the LDF recording site was probably wider and more diffuse than the VS dye AOI. Accordingly, it is likely that the maximal hyperaemia occurred slightly later than shown in Figure 4B.
Anoxic depolarisation
Terminal, global ischaemia resulted in a complex pattern of changes in the VS dye signal, with at least three different phases (Figure 5): (i) a steep drop of the recorded VS dye fluorescence, whose onset coincided with the sudden arrest of blood supply produced by the intravenous air embolus and confirmed by the LDF recording (Figure 5B). It is relevant to mention that a marked swelling of the brain occurred during this phase (with the cortical surface going out of focus; Figure 6B1–3), presumably reflecting a sudden increase in cerebrovascular volume; (ii) a brief and sharp increase in fluorescence, indicative of AD; and (iii) further increase of the recorded VS dye fluorescence, up to a level that greatly exceeded the fluorescence intensity measured immediately before cardiac arrest (maximum change relative to baseline: 132.5%±82.2%, n = 6).
Figure 6.

VS dye signatures of SD (A), and AD subsequent to complete ischaemia (B), with associated drifts of the recorded fluorescence. The images B1–3 were taken from a representative sequence acquired to visualise AD; they show the transient brain swelling immediately after cardiac arrest (B2, where the oval field of view becomes out of focus) followed by post-mortem brain shrinkage (B3, where the field of view is back in focus). Changes in VS dye fluorescence intensity were recorded during consecutive 10-min image sequences, with each experimental event (i.e., SD or terminal ischaemia) preceded and followed by 10 mins of image capture when no procedure was applied to the preparation. Each trace is the average of several signals obtained from separate experiments (n = 6). All the data are expressed as changes in fluorescence intensity (ΔF/F), using as common baseline the fluorescence measured during the first 3 secs (i.e., average of six frames) of the first data sequence (i.e., pre-SD drift of SD1), and then synchronised (i.e., alignment of maximal rate of depolarisation time points). In this figure, no further offset correction was applied to the plots, to make visible the progressive decrease of fluorescence as the experiment progressed. The drifts of fluorescence that occurred during SD sequence acquisition were assumed to be linear (see text for detail), and displayed as grey dashed line in panel A. In contrast to all the other drifts, note the sustained increase in fluorescence that was observed after death (panel B, AD and post-mortem drift).
Comparison of the normalised DC potential and VS dye signals revealed a similar rate of maximum depolarisation for the two measures (Figure 5A). However, the relative changes for SD and AD were different with the two methods: with the DC potential, the amplitude of AD was consistently smaller than that of SD1 (AD, 12.7±6.3 mV, n = 5 versus SD1, 18.7±1.8 mV, n =6, P < 0.05), whereas the VS dye denoted a higher amplitude of AD than SD (AD, 123.1±35.8 Gy level, n = 6 versus SD1, 89.0±11.2 Gy level, n = 6, P < 0.05). Comparison of AD with SD4 (i.e., the SD elicited immediately before induction of terminal ischaemia) confirmed this observation as SD4 consistently had the smallest absolute peak amplitude (75.8±19.4 Gy level), as a consequence of progressive VS dye bleaching.
Drifts of voltage-sensitive dye fluorescence intensity during the experimental procedure
Image sequences were also acquired before and after each SD and AD, when no procedure was applied to the preparation, to record the changes in fluorescence, reflecting illumination-related bleaching of the VS dye, or any other change in the recorded VS dye signal that may suggest other interfering phenomenon, such as altered interactions between cellular membrane and the dye (e.g., dissociation of membrane-bound dye). As some of these ‘control’ image sequences suggested the contribution of unidentified biologic component(s) to the changes in fluorescence recorded under these conditions (see below), throughout this report these changes are referred to as ‘drifts’ in the VS dye signal intensity. Analysis of the averaged signals from six experiments showed that the pre-SD and post-SD drifts had negative slopes (Figure 6), with the drifts becoming gradually steeper in the course of an experiment (pre-SD1, −4.13±4.36 Gy level/min; post-SD1/pre-SD2, −5.18±0.82 Gy level/min; post-SD2, −5.72.70±1.04 Gy level/min). The calculated drifts during SD had a steeper slope than the drifts immediately preceding or following it (SD1, −5.76±3.00 Gy level/min; SD2, −8.50±1.84 Gy level/min), suggesting a faster reduction in the measured VS dye fluorescence during the periods with SD elicitation. In contrast, the starting grey level of each drift was virtually identical to the final grey level of the preceding SD image sequence. The 10-min drift recorded directly before terminal ischaemia (i.e., after SD4) was similar to the previous drifts (slope: −6.27±0.38 Gy level/min), but the post-mortem drift was markedly different (Figure 6B) in that its slope was reversed to positive (5.89±5.27 Gy level/min).
Discussion
Imaging of Spreading Depression Using a Fluorescent, Voltage-Sensitive Dye
Taken together, our data show that fluorescent VS dyes (such as RH-1838) can be used for direct, live imaging of SD. The VS dye fluorescence signatures of SD are reproducible, have appropriate time and spatial resolution, and a very good signal-to-noise ratio as they are already visible on the captured images without any need for contrast enhancement. The most important feature of the SD VS dye signal is its good analogy with the corresponding DC potential changes, indicating that this new method provides the two-dimensional equivalent of the characteristic DC potential negative shifts displayed on electrical SD recordings. However, some discrepancies between DC potential and VS dye SD signatures were also found (see Table 1), and they were to be expected because of the inherent differences in the nature and biologic genesis of the two variables. For example, the DC potential is a punctual, extracellular recording, generally considered to provide an index of the polarisation of cells surrounding the tip of the glass electrode. But this signal is not equivalent to the averaged membrane potential of the surrounding cells, and whether neurons and glia contribute to the same extent to the DC signal remains unclear (Sugaya et al, 1975). In contrast, the VS dye signal probably includes the contribution of brain cells distributed along a thicker cortical region, and the fact that the dye is incorporated within the membrane implies that the VS dye signal may be more closely related to averaged cellular membrane potential.
Our data suggest that few interferents (i.e., modifications of the recorded fluorescence that are independent of membrane potential changes) contribute to the signal, and that their magnitude and/or timing relative to the transient cellular depolarisation make them acceptable.
(1) No fluorescence could be detected (either with retina or rat cortex) when the tissue was not loaded with the VS dye, indicating the absence of interference from endogenous compounds that may fluoresce at the same excitation and emission wavelengths as RH-1838.
(2) The images of the rat cortex after VS dye loading point to an interference from blood, as the pial vasculature is quite visible in these pictures (Figure 3A). Indeed, dark blood vessels against a bright background indicate that blood component(s) (presumably erythrocytes/haemoglobin) quenched the fluorescent light emitted within the underlying tissue. Blood quenching was likely to be more pronounced during the SD-associated hyperaemia, as the latter implies increased cerebrovascular volume (vasodilation) and/or change in haemoglobin oxidation. This interference could well be maximal during the post-SD ‘hyperpolarisation’ (see section Anoxic depolarisation). Blood quenching of the dye fluorescence may also influence the phase of progressive recovery of the signal after SD as, in comparison with SD1 changes, the more gradual recovery of the VS dye signal after SD2 corresponded to the more gradual return of LDF to baseline (Figure 4).
(3) On the VS dye signature of cortical SD, the post-SD ‘hyperpolarisation’ appeared consistently more pronounced than on DC potential recordings (Figure 4A). It is likely that blood quenching of the dye fluorescence contributed to this difference. However, this difference was also a feature (albeit to a lesser extent) of the data obtained with the chicken retina where any vascular interaction can be ruled out (Figure 2). Therefore, the more pronounced postdepolarisation ‘hyperpolarisation’ detected with the VS dye may reflect a genuine difference between extracellular DC potential and transmembrane potential (VS dye fluorescence) changes associated with SD, exacerbated by blood quenching in cortical window preparations.
(4) Bleaching of the fluorescence by intense illumination of the VS dye at its excitatory wavelength (Grinvald et al, 1982) was confirmed in our experiments (i.e., drift recordings; Figure 6). As the corresponding progressive reduction of fluorescence was linear over 10 mins, and assuming that the voltage-sensitive component of the recorded signal had recovered from SD at the end of this time frame, we chose to correct the VS dye SD data by subtraction of a linear data set calculated from the initial and last images constituting each 10-min sequence (Figure 6). This mathematical transformation of the SD data, which appeared rational, revealed that the slope of the correcting linear data set was steeper than the drifts that preceded or followed the capture of the SD sequence (Figure 6). This more pronounced drift during SD suggests the occurrence of another interfering phenomenon when the SD stressor is applied to the preparation, possibly linked to changes in the interaction between VS dye and cellular membrane (e.g., increased dissociation of the membrane-bound dye) or in the VS dye metabolism/degradation (e.g., increased free radical generation during SD; Read and Parsons, 2000). It is possible that this interference also contributed to the more pronounced post-SD ‘hyperpolarisation’ than to DC potential recordings.
In comparison with intact skull preparations, opening of a large cranial window may alter some aspects of SD (e.g., its genesis, propagation, or subsequent tissue recovery). One cannot rule out that the continuous superfusion of the cortical surface with oxygenated and buffered aCSF may interfere with SD, for example, by promoting the recovery of the tissue from individual SD, with consequent shortening of the post-SD refractory period. However, this interference would apply to the monitoring of any physiologic variable through the closed cranial window and, therefore, is not specific to this novel VS dye technique.
Imaging of Anoxic Depolarisation Using a Fluorescent, Voltage-Sensitive Dye
The image sequences captured to visualise AD showed that this method is also capable of providing pertinent two-dimensional records of this phenomenon, with appropriate time and spatial resolution. With our experimental conditions, AD was visualised as a progressive increase in fluorescence, starting over one or two cortical areas and rapidly invading the whole exposed cortex (Figure 5C1–4). These observations contrast with the pattern of changes obtained by recording the light transmitted across mouse hemi-brain slices, which suggested a more pronounced ‘spreading action’ of AD subsequent to glucose/oxygen deprivation (Joshi and Andrew, 2001).
In comparison to SD, VS dye imaging of AD subsequent to terminal, global ischaemia provided signatures with more complex kinetics, suggesting that additional interferents contributed to the overall optical signal in these conditions. On the basis of our observations, we propose the following interpretations:
(1) In the AD image sequences, the pictures captured immediately after sudden complete ischaemia revealed an immediate brain swelling, perceived as a remarkable upward movement of the exposed cortical surface through the cranial window (i.e., the only brain region capable of expanding). This event occurred at such a speed that it could only reflect instant, generalised cerebrovascular dilation. At these time points, the cortical surface within the field of view of the camera went out of focus (Figure 6B2), and the focus of the camera shifted towards deeper tissue layers, presumably less impregnated with the VS dye. Therefore, brain swelling by itself appears as a likely contributor to the rapid decrease in fluorescence recorded during this early phase, which preceded the occurrence of AD (Figure 6B). It is clear that vasodilation-associated increased blood quenching of fluorescence (discussed above for SD) was also an interferent at that time, contributing to an overall darker cortical surface.
(2) From a darker cortical surface, AD then appeared as one or two waves of increased fluorescence, reflecting the VS dye response to progressive and invading cellular depolarisation (Figure 6).
(3) Unexpectedly, the intensity of the recorded fluorescence kept increasing in a way that was difficult to interpret as an indication of further cellular depolarisation. At least two phenomena may contribute to the sustained, post-mortem increase of recorded fluorescence: (i) the generalised vasodilation that occurs immediately after cardiac arrest is only transient, with the arteries contracting post mortem; further brain shrinkage may also result from a reduction of the extra-cellular volume with global ischaemia (Kumura et al, 2003); our data clearly indicate that the initial brain swelling is reversed, as the cortical surface was back into focus at the end of the 10-min image sequences acquired to record AD (Figure 6, B3); and (ii) marked post-mortem changes in the brain tissue biochemistry may alter the amount/density of the VS dye incorporated to cellular membrane, and/or the dye fluorescence intensity.
The contribution of post-mortem interferents that increase the recorded fluorescence may explain our observation that the AD signature was larger than the SD signature with the VS dye, whereas the opposite was found with the absolute DC potential amplitudes.
Comparison with Previous Imaging of Spreading Depression and Anoxic Depolarisation
The propagating nature of SD has consistently prompted investigators to attempt the imaging of this clinically relevant phenomenon ‘live’ in experimental models. So far, in vivo strategies have relied on the imaging of variables that are altered as a consequence of SD. These include the following (i) lCBF (Lauritzen and Fabricius, 1995; Dunn et al, 2001, 2003; Strong et al, 2006), because SD results in complex lCBF changes that propagate with the corresponding wave of cellular depolarisation (Piper et al, 1991; Fabricius et al, 1995; Obrenovitch et al, 2004); (ii) regional cerebral blood volume, a perfusion-related variable (Dunn et al, 2003; Chen et al, 2006b); (iii) haemoglobin oxidation, an indicator of oxygen supply versus demand (Ba et al, 2002; Dunn et al, 2003); and (iv) NADH tissue fluorescence (Strong et al, 1996; Hashimoto et al, 2000), used as a sensitive indicator of the cellular redox state in vivo that is transiently altered by SD (Takano et al, 2007). However, all these methods are inherently indirect, and the biologic significance of the data may be difficult to interpret with confidence, especially when dealing with perilesion depolarisations (i.e., SD or transient AD developing within heterogeneously ischaemic brain regions). In contrast, we have shown that VS dye fluorescence imaging provides the imaging equivalent of electrical extra-cellular DC potential, with the characteristic DC potential negative shifts associated with SD or AD translating directly to fluorescence increase.
It is clear that VS dye imaging shares some of the technical difficulties that are associated with other imaging techniques of this type (e.g., applications of the technique are restricted to upper brain regions). However, with regard to SD and AD detection, the novelty and strength of VS dye imaging is that the recorded signal relates directly to the phenomenon under study (i.e., synchronous cellular depolarisation).
Potential Applications
So far, VS dyes have been used primarily for the visualisation of the functional organisation of visual, auditory, and somatosensory cortices (Chen et al, 2006a; Nishimura et al, 2007; Ferezou et al, 2006; see Grinvald and Hildesheim, 2004 for review). These tools were also used successfully for the study of propagating neurologic phenomena in vivo: identification of the initiation site of epilepti-form activity and its subsequent propagation (Ma et al, 2004; Redecker et al, 2005); and generation and propagation of inhibitory, depolarizing GABA responses (DeFazio and Hablitz, 2005; Chen et al, 2005).
On the basis of our study, VS dye imaging has the ability to solve potentially important problems related to SD, including (i) spatiotemporal changes in the SD wave duration and shape as it progresses across the cerebral cortex, (ii) differences of propagation efficiencies along different axes of SD progression (Godukhin and Obrenovitch, 2001), and (iii) how SD waves alter the diameter of pial blood vessels as they propagate through the underlying cortex.
We are also confident that VS dye imaging constitutes a novel and pertinent experimental strategy to investigate the pathogenesis of ischaemic damage, especially the dynamics of infarct progression in stroke models, because it should be capable of identifying the occurrence of AD and SD in the ischaemic core and penumbral regions. If we follow the original definition of penumbra (region where blood flow is reduced to a level insufficient to sustain brain function, but with enough residual blood supply to maintain cellular ionic homeostasis; Astrup et al, 1981), then one would expect VS dye imaging to differentiate between ischaemic core (featured by AD) and penumbra (no AD). Accordingly, VS dye imaging should be able to detect SD propagation within the penumbra. What VS dye imaging will not be able to discriminate is the ischaemic penumbra from adjacent regions with preserved, functional blood flow. For that, it should be possible to supplement the imaging of VS dye fluorescence with that of other relevant variables, such as tissue pH (Chen et al, 2005) and lCBF (e.g., by laser speckle imaging).
Supplementary Material
VS dye imaging of K+ -induced spreading depression in the chicken retina
VS dye imaging of cortical spreading depression (CSD)
Acknowledgements
This work would not have been possible without the contribution from D Brown, G Pearson, A Kershaw, and LV Brier (Workshop, Bradford School of Life Sciences).
This study was supported by a grant from the Wellcome Trust (079430/A/06/Z).
References
- Astrup J, Siesjö BK, Symon L. Thresholds in cerebral ischemia—the ischemic penumbra. Stroke. 1981;12:723–5. doi: 10.1161/01.str.12.6.723. [DOI] [PubMed] [Google Scholar]
- Ba AM, Guiou M, Pouratian N, Muthialu A, Rex DE, Cannestra AF, Chen JW, Toga AW. Multiwave-length optical intrinsic signal imaging of cortical spreading depression. J Neurophysiol. 2002;88:2726–35. doi: 10.1152/jn.00729.2001. [DOI] [PubMed] [Google Scholar]
- Chen G, Gao W, Reinert KC, Popa LS, Hendrix CM, Ross ME, Ebner TJ. Involvement of kv1 potassium channels in spreading acidification and depression in the cerebellar cortex. J Neurophysiol. 2005;94:1287–98. doi: 10.1152/jn.00224.2005. [DOI] [PubMed] [Google Scholar]
- Chen S, Li P, Luo W, Gong H, Zeng S, Luo Q. Time-varying spreading depression waves in rat cortex revealed by optical intrinsic signal imaging. Neurosci Lett. 2006b;396:132–6. doi: 10.1016/j.neulet.2005.11.025. [DOI] [PubMed] [Google Scholar]
- Chen Y, Geisler WS, Seidemann E. Optimal decoding of correlated neural population responses in the primate visual cortex. Nat Neurosci. 2006a;9:1412–20. doi: 10.1038/nn1792. [DOI] [PMC free article] [PubMed] [Google Scholar]
- Dahlem MA, Müller SC. Self-induced splitting of spiral-shaped spreading depression waves in chicken retina. Exp Brain Res. 1997;115:319–24. doi: 10.1007/pl00005700. [DOI] [PubMed] [Google Scholar]
- DeFazio RA, Hablitz JJ. Horizontal spread of activity in neocortical inhibitory networks. Brain Res Dev Brain Res. 2005;157:83–92. doi: 10.1016/j.devbrainres.2005.03.008. [DOI] [PubMed] [Google Scholar]
- Dreier JP, Woitzik J, Fabricius M, Bhatia R, Major S, Drenckhahn C, Lehmann TN, Sarrafzadeh A, Willumsen L, Hartings JA, Sakowitz OW, Seemann JH, Thieme A, Lauritzen M, Strong AJ. Delayed ischaemic neurological deficits after subarachnoid haemorrhage are associated with clusters of spreading depolarisations. Brain. 2006;129:3224–37. doi: 10.1093/brain/awl297. [DOI] [PubMed] [Google Scholar]
- Dunn AK, Bolay H, Moskowitz MA, Boas DA. Dynamic imaging of cerebral blood flow using laser speckle. J Cereb Blood Flow Metab. 2001;21:195–201. doi: 10.1097/00004647-200103000-00002. [DOI] [PubMed] [Google Scholar]
- Dunn AK, Devor A, Bolay H, Andermann ML, Moskowitz MA, Dale AM, Boas DA. Simultaneous imaging of total cerebral hemoglobin concentration, oxygenation, and blood flow during functional activation. Opt Lett. 2003;28:28–30. doi: 10.1364/ol.28.000028. [DOI] [PubMed] [Google Scholar]
- Fabricius M, Akgoren N, Lauritzen M. Arginine–nitric oxide pathway and cerebrovascular regulation in cortical spreading depression. Am J Physiol. 1995;269:H23–9. doi: 10.1152/ajpheart.1995.269.1.H23. [DOI] [PubMed] [Google Scholar]
- Ferezou I, Bolea S, Petersen CC. Visualizing the cortical representation of whisker touch: voltage-sensitive dye imaging in freely moving mice. Neuron. 2006;50:617–29. doi: 10.1016/j.neuron.2006.03.043. [DOI] [PubMed] [Google Scholar]
- Godukhin OV, Obrenovitch TP. Asymmetric propagation of spreading depression along the anteroposterior axis of the cerebral cortex in mice. J Neurophysiol. 2001;86:2109–11. doi: 10.1152/jn.2001.86.4.2109. [DOI] [PubMed] [Google Scholar]
- Grinvald A, Hildesheim R. VSDI: a new era in functional imaging of cortical dynamics. Nat Rev Neurosci. 2004;5:874–85. doi: 10.1038/nrn1536. [DOI] [PubMed] [Google Scholar]
- Grinvald A, Hildesheim R, Farber IC, Anglister L. Improved fluorescent probes for the measurement of rapid changes in membrane potential. Biophys J. 1982;39:301–8. doi: 10.1016/S0006-3495(82)84520-7. [DOI] [PMC free article] [PubMed] [Google Scholar]
- Hashimoto M, Takeda Y, Sato T, Kawahara H, Nagano O, Hirakawa M. Dynamic changes of NADH fluorescence images and NADH content during spreading depression in the cerebral cortex of gerbils. Brain Res. 2000;872:294–300. doi: 10.1016/s0006-8993(00)02509-9. [DOI] [PubMed] [Google Scholar]
- Joshi I, Andrew RD. Imaging anoxic depolarisation during ischemia-like conditions in the mouse hemi-brain slice. J Neurophysiol. 2001;85:414–24. doi: 10.1152/jn.2001.85.1.414. [DOI] [PubMed] [Google Scholar]
- Kumura E, Dohmen C, Graf R, Yoshimine T, Heiss WD. Significant shrinkage of extracellular space during global cerebral ischemia: differences in grey and white matter ischemia. Acta Neurochir Suppl. 2003;86:67–70. doi: 10.1007/978-3-7091-0651-8_15. [DOI] [PubMed] [Google Scholar]
- Lauritzen M, Fabricius M. Real time laser-Doppler perfusion imaging of cortical spreading depression in rat neocortex. Neuroreport. 1995;6:1271–3. doi: 10.1097/00001756-199506090-00010. [DOI] [PubMed] [Google Scholar]
- Ma HT, Wu CH, Wu JY. Initiation of spontaneous epileptiform events in the rat neocortex in vivo. J Neurophysiol. 2004;91:934–45. doi: 10.1152/jn.00274.2003. [DOI] [PMC free article] [PubMed] [Google Scholar]
- Martins-Ferreira H, Nedergaard M, Nicholson C. Perspectives on spreading depression. Brain Res Brain Res Rev. 2000;32:215–34. doi: 10.1016/s0165-0173(99)00083-1. [DOI] [PubMed] [Google Scholar]
- McLachlan RS. Suppression of spreading depression of Leao in neocortex by an N-methyl-D-aspartate receptor antagonist. Can J Neurol Sci. 1992;19:487–91. [PubMed] [Google Scholar]
- Mies G, Iijima T, Hossmann K-A. Correlation between peri-infarct DC shift and ischaemic neuronal damage in rat. NeuroReport. 1993;4:709–11. doi: 10.1097/00001756-199306000-00027. [DOI] [PubMed] [Google Scholar]
- Nishimura M, Shirasawa H, Kaizo H, Song WJ. New field with tonotopic organization in guinea pig auditory cortex. J Neurophysiol. 2007;97:927–32. doi: 10.1152/jn.00689.2006. [DOI] [PubMed] [Google Scholar]
- Obrenovitch TP. The ischaemic penumbra: twenty years on. Cerebrovasc Brain Metab Rev. 1995;7:297–323. [PubMed] [Google Scholar]
- Obrenovitch TP, Wang M, Urenjak J, Butler MJ, Dreier JP. The role(s) of nitric oxide during cortical spreading depression. In: Krieglstein J, Klumpp S, editors. Pharmacology of Cerebral Ischemia. Stuttgart: Medpharm; 2004. pp. 157–66. [Google Scholar]
- Piper RD, Lambert GA, Duckworth JW. Cortical blood flow changes during spreading depression in cats. Am J Physiol. 1991;261:H96–102. doi: 10.1152/ajpheart.1991.261.1.H96. [DOI] [PubMed] [Google Scholar]
- Read SJ, Parsons AA. Sumatriptan modifies cortical free radical release during cortical spreading depression. A novel antimigraine action for sumatriptan? Brain Res. 2000;870:44–53. doi: 10.1016/s0006-8993(00)02400-8. [DOI] [PubMed] [Google Scholar]
- Redecker C, Hagemann G, Kohling R, Straub H, Witte OW, Speckmann EJ. Optical imaging of epileptiform activity in experimentally induced cortical malformations. Exp Neurol. 2005;192:288–98. doi: 10.1016/j.expneurol.2004.11.018. [DOI] [PubMed] [Google Scholar]
- Richter F, Lehmenkühler A. Spreading depression can be restricted to distinct depths of the rat cerebral cortex. Neurosci Lett. 1993;152:65–8. doi: 10.1016/0304-3940(93)90484-3. [DOI] [PubMed] [Google Scholar]
- Selman WR, Lust WD, Pundik S, Zhou Y, Ratcheson RA. Compromised metabolic recovery following spontaneous spreading depression in the penumbra. Brain Res. 2004;999:167–74. doi: 10.1016/j.brainres.2003.11.016. [DOI] [PubMed] [Google Scholar]
- Strong AJ, Anderson PJ, Watts HR, Virley DJ, Lloyd A, Irving EA, Nagafuji T, Ninomiya M, Nakamura H, Dunn AK, Graf R. Peri-infarct depolarisations lead to loss of perfusion in ischaemic gyrencephalic cerebral cortex. Brain. 2007;130:995–1008. doi: 10.1093/brain/awl392. [DOI] [PubMed] [Google Scholar]
- Strong AJ, Bezzina EL, Anderson PJ, Boutelle MG, Hopwood SE, Dunn AK. Evaluation of laser speckle flowmetry for imaging cortical perfusion in experimental stroke studies: quantitation of perfusion and detection of peri-infarcts. J Cereb Blood Flow Metab. 2006;26:645–53. doi: 10.1038/sj.jcbfm.9600240. [DOI] [PubMed] [Google Scholar]
- Strong AJ, Fabricius M, Boutelle MG, Hibbins SJ, Hopwood SE, Jones R, Parkin MC, Lauritzen M. Spreading and synchronous depressions of cortical activity in acutely injured human brain. Stroke. 2002;33:2738–43. doi: 10.1161/01.str.0000043073.69602.09. [DOI] [PubMed] [Google Scholar]
- Strong AJ, Harland SP, Meldrum BS, Whittington DJ. The use of in vivo fluorescence image sequences to indicate the occurrence and propagation of transient focal depolarisations in cerebral ischemia. J Cereb Blood Flow Metab. 1996;16:367–77. doi: 10.1097/00004647-199605000-00003. [DOI] [PubMed] [Google Scholar]
- Sugaya E, Takato M, Noda Y. Neuronal and glial activity during spreading depression in cerebral cortex of cat. J Neurophysiol. 1975;38:822–41. doi: 10.1152/jn.1975.38.4.822. [DOI] [PubMed] [Google Scholar]
- Takano T, Tian GF, Peng W, Lou N, Lovatt D, Hansen AJ, Kasischke KA, Nedergaard M. Cortical spreading depression causes and coincides with tissue hypoxia. Nat Neurosci. 2007;10:754–62. doi: 10.1038/nn1902. [DOI] [PubMed] [Google Scholar]
Associated Data
This section collects any data citations, data availability statements, or supplementary materials included in this article.
Supplementary Materials
VS dye imaging of K+ -induced spreading depression in the chicken retina
VS dye imaging of cortical spreading depression (CSD)