

Abstract
Leptin-deficient ob/ob mice are resistant to dextran sulfate sodium (DSS)-induced colitis and Concanavalin A (Con A)-induced hepatitis. However, the signal transduction pathways involved have not been identified. The present study investigated the effect of leptin-induced STAT3 signaling in the DSS and Con A models. Mice carrying a leptin receptor (LEPR) gene mutant for Y1138 (s/s mice), with abrogated leptin-induced STAT3 signaling, were compared with wild-type (WT) and LEPR-deficient db/db mice. Administration of DSS to s/s mice resulted in a clinical score and colon shortening of intermediate severity compared with disease induced in WT and db/db mice—the latter group having the lowest disease severity. A comparable degree of inflammatory infiltrate and epithelial damage was observed in the colon of WT and s/s mice, and these parameters were reduced in db/db mice. Levels of IFN-γ, IL-6, IL-10, and TNF-α were comparable in the colon of s/s and db/db mice, and a similar trend was observed for CXCL2. s/s and WT mice developed severe liver disease in response to Con A, whereas db/db mice were protected. However, Con A-induced serum IL-6 and TNF-α levels in s/s mice mimicked levels observed in db/db rather than WT mice. In conclusion, lack of leptin-induced STAT3 signaling is associated with reduced cytokine production following DSS and Con A administration, but it appears to sensitize mice to the effects of proinflammatory mediators.
Keywords: cytokines, colon, liver
INTRODUCTION
Leptin is produced and secreted predominantly by adipocytes and is therefore classified as an adipokine [1]. Most well known for its control of appetite, leptin is also involved in the regulation of metabolic, endocrine, and immune functions [1, 2]. The importance of leptin in maintaining cellularity and function of the immune system has been characterized extensively, particularly in models of autoimmunity and inflammation [3, 4].
Leptin exerts its effects by binding to the long form of the leptin receptor (LEPR), the only isoform that is capable of intracellular signaling through activation of tyrosine residues [5]. Having structural and functional similarities with members of the long-chain helical cytokines, such as IL-6 and IL-12, leptin is considered a proinflammatory cytokine, and its receptor is related to class I cytokine receptors, the common signal-transducing component for the IL-6-related family of cytokines [2, 6, 7]. Activation of LEPR results in autophosphorylation of Janus kinase (JAK) 2, which leads to phosphorylation of tyrosine residues 985, 1077, and 1138 in LEPR. When activated, each of the three tyrosine phosphorylation sites recruits specific downstream signaling proteins, which mediate leptin’s signaling [3, 8]. P-Y985 recruits tyrosine phosphatase Src homology 2 domain-containing tyrosine phosphatase 2 (SHP-2), which induces ERK1/2 [3, 9]. In addition, suppressor of cytokine signaling (SOCS) 3 binds to P-Y985, contributing to attenuation of LEPR signaling [10, 11]. P-Y1077 contributes to downstream signaling through transcriptional activation of signal transducer and activator of transcription (STAT) 5 [10]. P-Y1138 recruits STAT3, a cytokine-regulated transcription factor involved in immune function, resulting in its phosphorylation and nuclear translocation [8].
In addition to being obese, leptin (ob/ob)- and LEPR (db/db)-deficient mice have alterations in immune and inflammatory responses [12]. In particular, ob/ob mice exhibit reduced disease severity in the experimental model of intestinal inflammation induced by dextran sulfate sodium (DSS) and in Concanavalin A (Con A)-induced autoimmune hepatitis [13, 14]. However, the signal transduction pathways associating lack of leptin to protection in these two different models are not fully understood. In an attempt to clarify these mechanisms, we used knock-in mice that have a mutation in the Y1138 residue of LEPR (s/s mice), which disrupts leptin-induced STAT3 signaling but allows leptin to signal through Y985 and Y1077 effectively [15]. Similar to db/db mice, s/s mice are hyperphagic and develop early- onset obesity with hepatic steatosis, secondary to lack of STAT3-mediated leptin signaling in hypothalamic neurons [15].
To evaluate the involvement of leptin-mediated STAT3 signaling in regulating inflammation, we compared the response of s/s mice with that of their lean wild-type (WT) littermates and of db/db mice, which are completely unable to signal through LEPR, in the models of DSS-induced colitis and Con A-induced hepatitis.
MATERIALS AND METHODS
Mice
Care of mice followed institutional guidelines under a protocol approved by the Institutional Animal Care and Use Committee at the University of Illinois at Chicago (Chicago, IL, USA). All mice used in these experiments were on a C57BL6 background. s/s mice were generated as described previously [15]. Ten-week-old male and female s/s mice and their lean WT littermates fed a regular chow were used for the experiments. Mice were genotyped by real-time PCR using specific primers [8] and the TaqMan system (Applied Biosystems, Foster City, CA, USA). Age- and sex- matched db/db mice were obtained from The Jackson Laboratory (Bar Harbor, ME, USA). As reported previously, s/s and db/db mice were markedly obese as a result of severe hyperphagia, secondary to lack of STAT3-mediated leptin signaling in the hypothalamus [15].
Induction and evaluation of colitis
Mice were given 3% DSS (MW 40 kDa; MP Biochemicals, Solon, OH, USA), dissolved in drinking water ad libitum for 5 days, followed by 5 days of normal drinking water, resulting in a 10-day experimental period [13]. Control mice were given normal drinking water without DSS. A clinical score (0–12) described previously, which takes into account body weight loss, diarrhea, and blood in the stools, was assessed daily to quantify clinical disease [16]. Postmortem, the entire colon was excised from the cecum to the anus, and colon length was recorded as a marker of inflammation [17]. A 0.05- to 1-cm segment of the transverse colon was fixed in 10% buffered formalin overnight for histological analysis. Paraffin sections (5 μm) were stained with H&E. A histological score, consisting of inflammatory cell infiltrate (0–3) and epithelial damage (0–3), was evaluated in a blinded manner by a pathologist as described previously [18].
Cytokine and chemokine measurement in DSS-induced colitis
Duplicate segments of the transverse colon were excised, cut longitudinally, and washed in PBS containing 1% penicillin and streptomycin. The pieces of colon were placed in 24-well culture plates containing 1 ml RPMI with 1% penicillin and streptomycin and incubated at 37°C for 24 h. Colon culture supernatants were then harvested and assayed for cytokines and chemokines by ELISA kits from BD Bioscience (San Jose, CA, USA) and eBioscience (San Diego, CA, USA). Protein concentration of the supernatant was quantified using the Bio-Rad protein assay (Bio-Rad Laboratories, Hercules, CA, USA). Cytokine expression was measured in the colon by real-time RT-PCR using specific primers for IFN-γ, IL-6, IL-10, TNF-α, and CXCL2 and the TaqMan system (Applied Bioscience).
Induction of hepatitis
Con A (Sigma Chemical Co., St. Louis, MO, USA) was reconstituted in pyrogen-free PBS at 2 mg/ml. Mice were injected i.v. in the tail vein with 200 μg Con A. Control mice received an equal amount of PBS. Blood was obtained from the retro-orbital plexus at 1.5 h and 24 h after Con A administration, and serum was prepared. Serum levels of alanine aminotransferase (ALT) were determined using a colorimetric endpoint method (TECO Diagnostics, Anaheim, CA, USA). Serum levels of TNF-α and IL-6 were measured using ELISA kits from eBioscience. A histological score was blindly calculated on liver sections as follows: 0–3 for inflammatory infiltrate; 0–3 for extent of necrosis; 0–3 for extent of steatosis; and 0 = no involvement; 1 = mild; 2 = moderate; and 3 = severe for each of the three parameters.
Statistical analysis
Statistical significance was determined by ANOVA using Fisher’s least significant difference. Error bars represent the sem (±sem). Statistical analyses were performed using XLStat software (Addinsoft, Brooklyn, NY, USA). Differences were considered significant for P< 0.05.
RESULTS
DSS-induced colitis in s/s mice
To investigate whether leptin-induced STAT3 signaling regulates colonic inflammation, we compared the response of s/s mice with that of their WT littermates and of LEPR-deficient db/db mice in the DSS model of colitis. Throughout the 10-day experiment, a clinical score was calculated to quantify disease severity by weight loss, diarrhea, and blood in stools. Beginning on Day 3 of DSS administration, WT and s/s mice started to show signs of disease activity (Fig. 1). Similar to data reported previously, obtained in ob/ob mice [13], db/db mice started to show minor signs of disease on Day 4 and began recovery after Day 5. The clinical score of db/db mice was significantly lower compared with that of WT mice beginning on Day 5 and throughout the remaining experiment. The clinical score of s/s mice was intermediate between that of WT and db/db mice and is significantly lower than the score of WT mice beginning on Day 5 but significantly higher than that of db/db mice beginning on Day 6 until completion of the experiment on Day 10 (Fig. 1).
Fig. 1.

Disease activity score in WT, s/s, and db/db mice receiving DSS. WT (♦), s/s (shaded □amp;), and db/db (▵) mice received DSS from Day 1 until Day 5. Disease activity score was calculated daily as described in Materials and Methods. Beginning on Day 5 and until Day 10, disease score in s/s mice was significantly lower than in WT mice (P<0.05 at each day). Beginning on Day 6 and until Day 10, disease score in s/s mice was significantly higher compared with db/db mice (P<0.05 at each day). Beginning on Day 5 and until Day 10, disease score in db/db mice was significantly lower than in WT mice (P<0.05 at each day). Data are mean ± sem; n = 6–9 mice per group.
Colon shortening is a typical sign of inflammation in DSS-induced colitis and correlates with disease severity [17]. DSS-treated WT mice exhibited a 28.9% reduction in colon length, and colon shortening in db/db mice was only 1.3%, similar to data obtained previously in ob/ob mice [13]. A 13.8% reduction in colon length was observed in DSS-treated s/s mice (Table 1), confirming the intermediate phenotype of these mice.
TABLE 1.
DSS-Induced Colon Shortening in WT, s/s, and db/db Mice
| Mice | Water | DSS |
|---|---|---|
| WT | 6.9 ± 0.19 | 4.9 ± 0.12a |
| s/s | 7.2 ± 0.25 | 6.2 ± 0.22b,c |
| db/db | 7.6 ± 0.29 | 7.5 ± 0.26c,d |
Mice received regular drinking water or DSS as detailed in Materials and Methods. On Day 10, colons were removed, and their length was measured (cm).
P < 0.001 versus respective water;
P < 0.05;
P < 0.001 versus WT DSS;
P < 0.01 versus s/s DSS.
However, a different pattern was observed when histological analysis of colon sections was performed (Fig. 2). In fact, at the end of the 10-day DSS experiment, s/s mice had a histological score comparable with that of WT mice, whereas a significantly lower score—in terms of inflammatory infiltrate and epithelial damage—was present in db/db mice, in agreement with previous data obtained in ob/ob mice [13].
Fig. 2.

Histological analysis in WT, s/s, and db/db mice receiving DSS. (A) Histological score of WT (black bars), s/s (gray bars), and db/db (white bars) mice received DSS from Day 1 until Day 5. At Day 10, mice were killed, and the colon was obtained for histological analysis. (B) H&E staining in the colon of WT control mice and in the colon of WT, s/s, and db/db mice that received treatment with DSS. Data are mean ± sem; n = 6–9 mice per group. *, P < 0.05; ***, P < 0.001.
Cytokine levels in DSS-induced colitis in s/s mice
We have demonstrated previously a role for leptin in regulating colonic cytokine expression in the DSS model using ob/ob mice [13]. The effect of leptin-induced STAT3 signaling on cytokine production by colonic tissue after DSS was evaluated. Colon segments from each mouse were cultured overnight, and the spontaneous release of IFN-γ, IL-6, IL-10, TNF-α, and CXCL2 was determined by analyzing supernatants (Fig. 3). The total colon culture system was used to allow the evaluation of cytokines produced spontaneously by the entire intestine under inflammatory conditions [13]. As observed previously in ob/ob mice [13], db/db mice produced significantly lower levels of IFN-γ, IL-6, IL-10, TNF-α, and CXCL2 compared with WT mice when given DSS. Cytokine release from colonic tissue of s/s mice was not significantly different from that of db/db mice, with the sole exception of CXCL2, which, however, followed a similar trend as the other cytokines (Fig. 3).
Fig. 3.
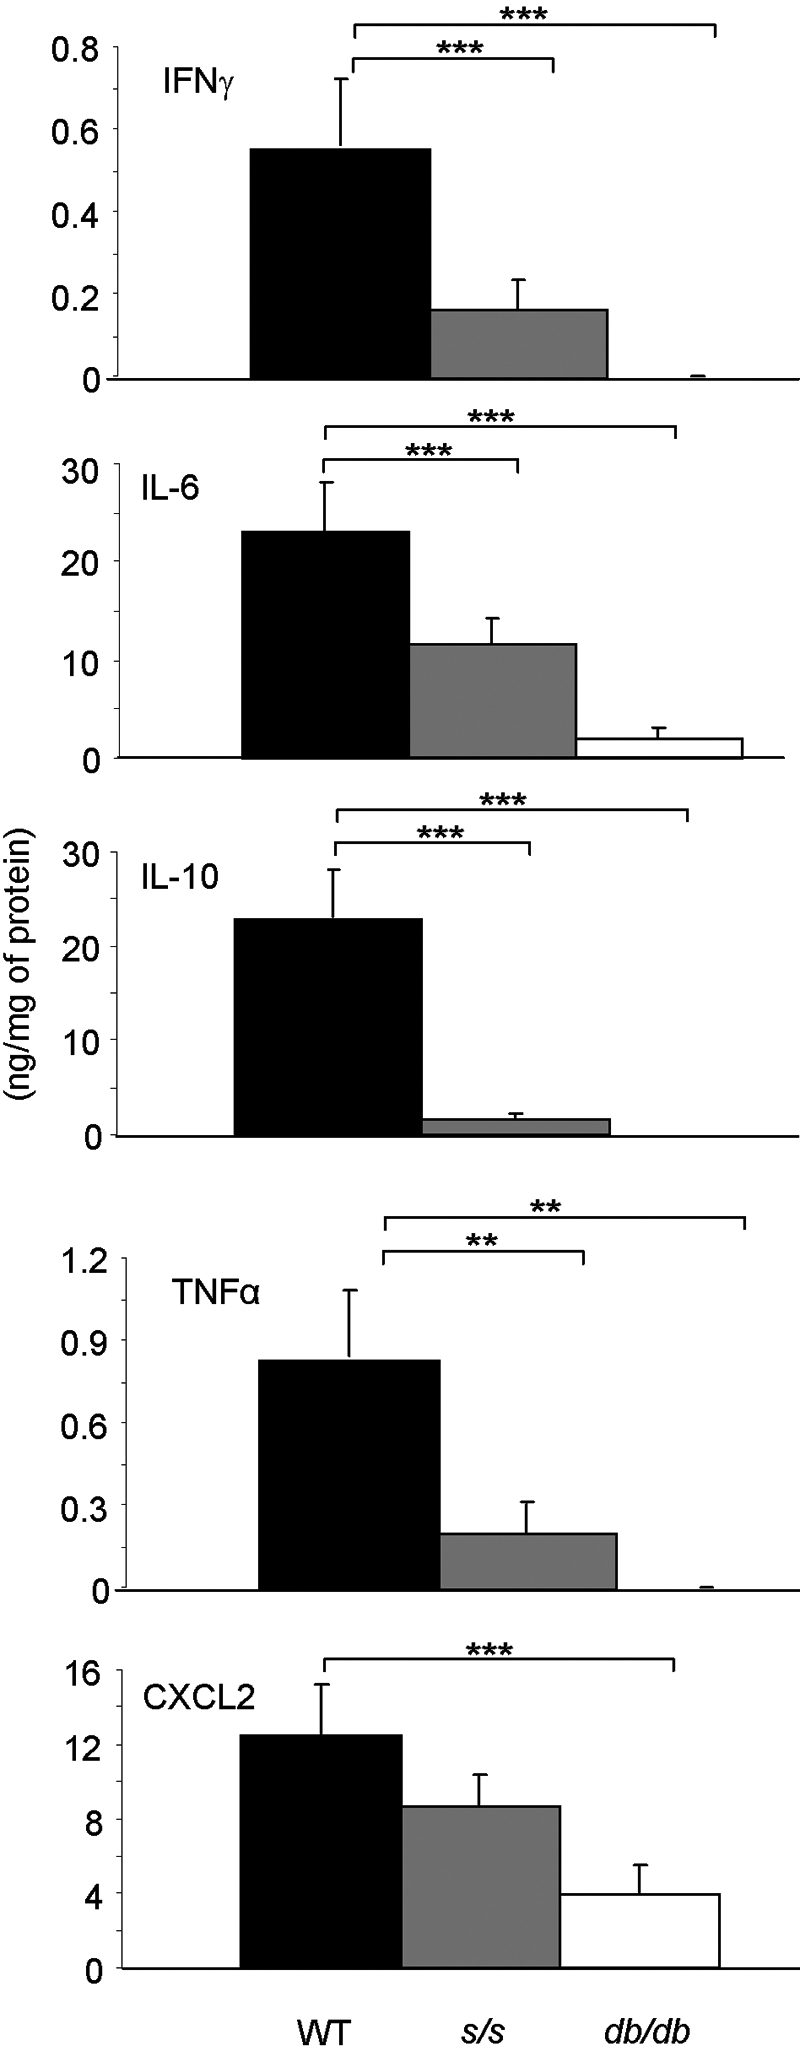
Cytokine and chemokine production by colon cultures in WT, s/s, and db/db mice receiving DSS. WT (black bars), s/s (gray bars), and db/db (white bars) mice received DSS from Day 1 until Day 5. At Day 10, mice were killed, and colon cultures were performed. Production of IFN-γ, IL-6, IL-10, TNF-α, and CXCL2 was measured by ELISA in culture supernatants. Data are mean ± sem; n = 6–9 mice per group. ***, P < 0.001; **, P< 0.01.
Expression of IFN-γ, IL-6, IL-10, TNF-α, and CXCL2 mRNA was measured by real-time RT-PCR and is displayed in Table 2. Expression of IFN-γ, IL-6, and TNF-α in the colon of db/db and s/s mice was significantly lower compared with WT colons, in agreement with that observed at the protein level. A similar trend was observed for IL-10 and CXCL2, although for these two cytokines, the difference did not reach statistical significance. Whereas at the protein level, IL-6 and TNF-α were comparable in the colon of s/s and db/db mice, mRNA expression of these cytokines was significantly lower in db/db mice compared with s/s mice. Thus, leptin-induced STAT3 signaling appears to be important for cytokine production in response to DSS.
TABLE 2.
DSS-Induced mRNA Cytokine Expression in the Colon
| Mice | IFN-γ | IL-6 | IL-10 | TNF-α | CXCL2 |
|---|---|---|---|---|---|
| WT | 46.9 ± 35.2 | 288.9 ± 5.1 | 1.2 ± 0.9 | 2.5 ± 0.1 | 16.3 ± 5.8 |
| s/s | 0.2 ± 0.08a | 255.0 ± 3.7b | 0.9 ± 0.3 | 2.1 ± 0.1c | 6.9 ± 3.8 |
| db/db | 1.0 ± 0.56a | 0.0 ± 0.0b,d | 0.1 ± 0.1 | 1.5 ± 0.0b,e | 3.9 ± 1.9 |
Mice received DSS as detailed in Materials and Methods. mRNA was extracted from a snap-frozen colon taken at Day 10 and analyzed for the expression of IFN-γ, IL-6, IL-10, TNF-α, and CXCL2. Data are expressed as fold induction compared with control WT mice that did not receive DSS.
P < 0.01;
P < 0.001;
P < 0.05 versus WT DSS;
P < 0.001,
P < 0.01 versus s/s DSS.
Con A-induced hepatitis in s/s mice
Previous reports have shown that leptin deficiency protects mice from Con A-induced hepatitis [7, 14]. To evaluate whether leptin-induced STAT3 signaling is involved in the decreased response of ob/ob mice to Con A, we induced hepatitis by injecting Con A in s/s, WT, and db/db mice. As anticipated based on previous data obtained in ob/ob mice [7, 14], serum ALT levels in WT mice were significantly higher (65%) compared with db/db mice at 24 h after Con A, the peak elevation time of serum ALT in this model [19, 20] (Fig. 4). Serum ALT levels in s/s mice were not significantly different from those of WT mice and were significantly higher compared with db/db mice. In agreement with ALT data, histological analysis of liver sections indicated a significantly lower necrosis score in db/db compared with WT and s/s mice injected with Con A (Fig. 5, B and D). However, a similar degree of inflammatory infiltrate was observed in all groups (Fig. 5, A and D). As a result of lack of leptin signaling in the brain of db/db mice and consequent massive obesity with insulin resistance, a high degree of hepatic steatosis is present in these animals compared with lean mice [21]. A similar degree of hepatic steatosis was present in vehicle-injected s/s and db/db mice, which are both obese compared with lean WT mice (Fig. 5, C and D). The extent of steatosis was reduced in s/s mice after Con A treatment but remained high in the db/db mice. We have shown previously that leptin deficiency, rather than obesity, is responsible for protection in Con A-induced hepatitis [14]. The present data thus suggest that leptin-induced STAT3 signaling is not the mechanism linking leptin deficiency to protection in the Con A-induced model.
Fig. 4.

Serum ALT levels in WT, s/s, and db/db mice receiving Con A. WT (black bars), s/s (gray bars), and db/db (white bars) mice received 200 μg Con A or saline. Serum ALT levels were measured 24 h after injection. Data are mean ± sem; n = 5 mice per group. **, P< 0.01; ***, P < 0.001.
Fig. 5.
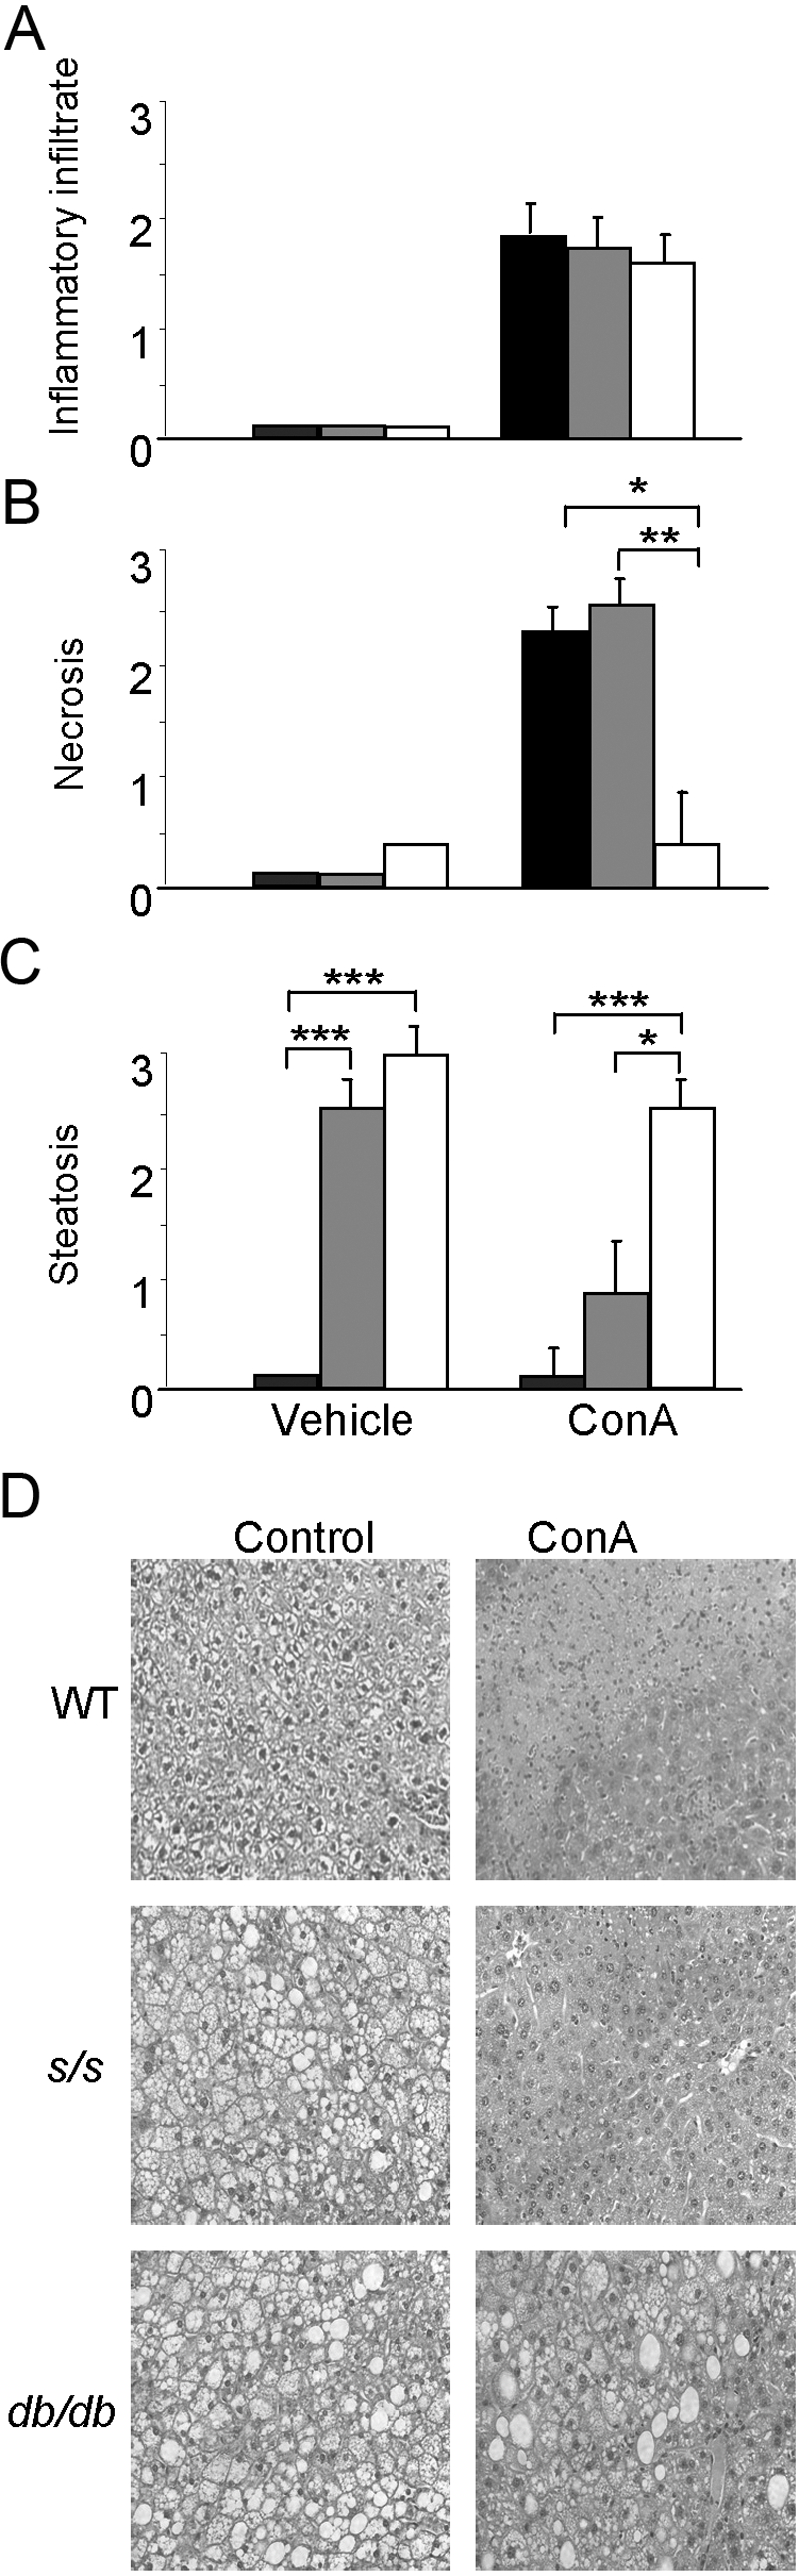
Histological analysis in WT, s/s, and db/db mice receiving Con A. WT (black bars), s/s (gray bars), and db/db (white bars) mice received 200 μg Con A or saline. At 24 h, mice were killed, and the liver was obtained for histological analysis. (A) Inflammatory infiltrate; (B) necrosis; (C) steatosis; (D) H&E staining in the liver of WT, s/s, and db/db mice before (Control) and after treatment with Con A. Data are mean ± sem; n = 5 mice per group. *, P > 0.05; **, P < 0.01; ***, P < 0.001.
Cytokine levels in Con A-induced hepatitis in s/s mice
db/db and s/s mice had significantly lower systemic levels of IL-6 and TNF-α compared with WT mice at 1.5 h post-Con A (Fig. 6A). In all three groups, TNF-α levels returned to baseline at 24 h, whereas IL-6 levels were still elevated in WT mice compared with s/s and db/db mice at 24 h (Fig. 6B). Levels of IFN-γ followed a similar trend and were significantly higher in WT compared with s/s and db/db mice (data not shown). Thus, s/s mice developed severe liver damage in response to Con A, despite producing low levels of cytokines.
Fig. 6.

Serum cytokine levels in WT, s/s, and db/db mice receiving Con A. WT (black bars), s/s (gray bars), and db/db (white bars) mice received 200 μg Con A or saline. (A) Serum TNF-α and IL-6 levels measured 1.5 h after injection. (B) Serum TNF-α and IL-6 levels measured 24 h after injection. Data are mean ± sem; n = 5 mice per group. **, P < 0.01; ***, P< 0.001.
DISCUSSION
We demonstrated previously that absence of leptin in ob/ob mice is protective against development of DSS-induced intestinal inflammation and Con A-induced hepatitis [13, 14]. Using s/s mice in the present report, we investigated the role of leptin-induced STAT3 signaling in these same models. Our data indicate that STAT3 activation by leptin is critical for modulation of cytokine production in response to DSS and Con A. However, the increased disease severity of s/s mice compared with db/db mice suggests that leptin-induced signaling pathways, independent of STAT3, are involved in disease pathogenesis in the DSS and Con A models.
Although signaling through STAT3 mediates leptin’s effects on food intake, hepatic glucose production, and gonadotropin secretion [22], control of adipose tissue lipogenesis and arterial neointima formation by leptin is STAT3-independent [23, 24]. The present report indicates that regulation of IFN-γ, IL-6, IL-10, and TNF-α by leptin in response to DSS and Con A is mediated largely by the STAT3 pathway, as levels of these cytokines in s/s mice were comparable with those observed in db/db mice. mRNA expression of IFN-γ, IL-6, and TNF-α in the colon was also lower in s/s compared with WT and thus, appears to be regulated, at least in part, by leptin-induced STAT3 signaling. Release of CXCL2, as well as expression of CXCL2 and IL-10, followed this trend as well.
Despite reduced production of cytokines that are known to mediate disease pathogenesis in the DSS and Con A models, severity of disease in s/s mice was significantly higher than in db/db mice in both models. In fact, both colonic and hepatic histological scores were comparable between WT and s/s mice and significantly lower in db/db mice in response to DSS or Con A. Furthermore, disease activity score and colon shortening in response to DSS as well as serum ALT levels in response to Con A were significantly higher in s/s compared with db/db mice. These observations, coupled with data indicating reduced cytokine production in s/s mice, suggest that the lack of leptin’s induced STAT3 signaling sensitizes mice to the deleterious effects of proinflammatory mediators. The STAT3 pathway is one of the major signaling pathways involved in translating cytokine signals into gene expression programs regulating proliferation and differentiation of immune cells [25]. The critical role of STAT3 signaling in alleviating inflammation is demonstrated by the outcome of selective deficiency of STAT3 in immune or endothelial cells, which leads to increased sensitivity to endotoxin challenge and development of spontaneous colitis in mice [26,27,28]. The STAT3 pathway is also critical in mediating the hepatic anti-inflammatory response in the model of Con A-induced hepatitis [29].
Among other targets, leptin-induced STAT3 phopshorylation induces transcription of SOCS3, which attenuates overall leptin signaling [30]. Lack of this negative, SOCS3-mediated feedback inhibition in s/s mice likely leads to prolonged LEPR stimulation through Y985 and Y1077, providing a possible explanation for increased sensitivity to the pathological effects of inflammatory mediators after DSS and Con A administration. Because of the general anti-inflammatory nature of STAT3- activated responses [31], it is likely that lack of leptin-induced STAT3 signaling may lead to overactivation of the PI-3K and MAPK pathways, known to mediate some of the proinflammatory activities of leptin [32].
In conclusion, data presented in this report indicate that leptin-induced STAT3 signaling is largely involved in regulating cytokine production by leptin in response to DSS and Con A. However, leptin-induced STAT3 signaling does not appear to be essential in disease pathogenesis of DSS-induced colitis or Con A- induced hepatitis and appears to sensitize mice to the deleterious effects of proinflammatory mediators.
Acknowledgments
This work was supported by National Institutes of Health grant DK061483 (to G. F.). The authors have no conflicts of interest to disclose.
References
- Fantuzzi G. Adipose tissue, adipokines, and inflammation. J Allergy Clin Immunol. 2005;115:911–919. doi: 10.1016/j.jaci.2005.02.023. [DOI] [PubMed] [Google Scholar]
- Tilg H, Moschen A R. Adipocytokines: mediators linking adipose tissue, inflammation and immunity. Nat Rev Immunol. 2006;6:772–783. doi: 10.1038/nri1937. [DOI] [PubMed] [Google Scholar]
- Hekerman P, Zeidler J, Korfmacher S, Bamberg-Lemper S, Knobelspies H, Zabeau L, Tavernier J, Becker W. Leptin induces inflammation-related genes in RINm5F insulinoma cells. BMC Mol Biol. 2007;8:41. doi: 10.1186/1471-2199-8-41. [DOI] [PMC free article] [PubMed] [Google Scholar]
- Fantuzzi G. Leptin: nourishment for the immune system. Eur J Immunol. 2006;36:3101–3104. doi: 10.1002/eji.200636770. [DOI] [PubMed] [Google Scholar]
- Tartaglia L A. The leptin receptor. J Biol Chem. 1997;272:6093–6096. doi: 10.1074/jbc.272.10.6093. [DOI] [PubMed] [Google Scholar]
- Baumann H, Morella K K, White D W, Dembski M, Bailon P S, Kim H, Lai C F, Tartaglia L A. The full-length leptin receptor has signaling capabilities of interleukin 6-type cytokine receptors. Proc Natl Acad Sci USA. 1996;93:8374–8378. doi: 10.1073/pnas.93.16.8374. [DOI] [PMC free article] [PubMed] [Google Scholar]
- Fantuzzi G, Sennello J A, Batra A, Fedke I, Lehr H A, Zeitz M, Siegmund B. Defining the role of T cell-derived leptin in the modulation of hepatic or intestinal inflammation in mice. Clin Exp Immunol. 2005;142:31–38. doi: 10.1111/j.1365-2249.2005.02898.x. [DOI] [PMC free article] [PubMed] [Google Scholar]
- Banks A S, Davis S M, Bates S H, Myers M G., Jr Activation of downstream signals by the long form of the leptin receptor. J Biol Chem. 2000;275:14563–14572. doi: 10.1074/jbc.275.19.14563. [DOI] [PubMed] [Google Scholar]
- Carpenter L R, Farruggella T J, Symes A, Karow M L, Yancopoulos G D, Stahl N. Enhancing leptin response by preventing SH2-containing phosphatase 2 interaction with Ob receptor. Proc Natl Acad Sci USA. 1998;95:6061–6066. doi: 10.1073/pnas.95.11.6061. [DOI] [PMC free article] [PubMed] [Google Scholar]
- Gong Y, Ishida-Takahashi R, Villanueva E C, Fingar D C, Munzberg H, Myers M G., Jr The long form of the leptin receptor regulates STAT5 and ribosomal protein S6 via alternate mechanisms. J Biol Chem. 2007;282:31019–31027. doi: 10.1074/jbc.M702838200. [DOI] [PubMed] [Google Scholar]
- Eyckerman S, Broekaert D, Verhee A, Vandekerckhove J, Tavernier J. Identification of the Y985 and Y1077 motifs as SOCS3 recruitment sites in the murine leptin receptor. FEBS Lett. 2000;486:33–37. doi: 10.1016/s0014-5793(00)02205-5. [DOI] [PubMed] [Google Scholar]
- Fantuzzi G, Faggioni R. Leptin in the regulation of immunity, inflammation, and hematopoiesis. J Leukoc Biol. 2000;68:437–446. [PubMed] [Google Scholar]
- Siegmund B, Lehr H A, Fantuzzi G. Leptin: a pivotal mediator of intestinal inflammation in mice. Gastroenterology. 2002;122:2011–2025. doi: 10.1053/gast.2002.33631. [DOI] [PubMed] [Google Scholar]
- Siegmund B, Lear-Kaul K C, Faggioni R, Fantuzzi G. Leptin deficiency, not obesity, protects mice from Con A-induced hepatitis. Eur J Immunol. 2002;32:552–560. doi: 10.1002/1521-4141(200202)32:2<552::AID-IMMU552>3.0.CO;2-H. [DOI] [PubMed] [Google Scholar]
- Bates S H, Stearns W H, Dundon T A, Schubert M, Tso A W, Wang Y, Banks A S, Lavery H J, Haq A K, Maratos-Flier E, Neel B G, Schwartz M W, Myers M G., Jr STAT3 signaling is required for leptin regulation of energy balance but not reproduction. Nature. 2003;421:856–859. doi: 10.1038/nature01388. [DOI] [PubMed] [Google Scholar]
- Siegmund B, Sennello J A, Jones-Carson J, Gamboni-Robertson F, Lehr H A, Batra A, Fedke I, Zeitz M, Fantuzzi G. Leptin receptor expression on T lymphocytes modulates chronic intestinal inflammation in mice. Gut. 2004;53:965–972. doi: 10.1136/gut.2003.027136. [DOI] [PMC free article] [PubMed] [Google Scholar]
- Okayasu I, Hatakeyama S, Yamada M, Ohkusa T, Inagaki Y, Nakaya R. A novel method in the induction of reliable experimental acute and chronic ulcerative colitis in mice. Gastroenterology. 1990;98:694–702. doi: 10.1016/0016-5085(90)90290-h. [DOI] [PubMed] [Google Scholar]
- Siegmund B, Rieder F, Albrich S, Wolf K, Bidlingmaier C, Firestein G S, Boyle D, Lehr H A, Loher F, Hartmann G, Endres S, Eigler A. Adenosine kinase inhibitor GP515 improves experimental colitis in mice. J Pharmacol Exp Ther. 2001;296:99–105. [PubMed] [Google Scholar]
- Pini M, Sennello J A, Chan L, Fantuzzi G. Adiponectin deficiency does not affect the inflammatory response to endotoxin or concanavalin A in mice. Endocrinology. 2006;147:5019–5022. doi: 10.1210/en.2006-0855. [DOI] [PubMed] [Google Scholar]
- Sennello J A, Fayad R, Morris A M, Eckel R H, Asilmaz E, Montez J, Friedman J M, Dinarello C A, Fantuzzi G. Regulation of T cell-mediated hepatic inflammation by adiponectin and leptin. Endocrinology. 2005;146:2157–2164. doi: 10.1210/en.2004-1572. [DOI] [PubMed] [Google Scholar]
- Cohen P, Zhao C, Cai X, Montez J M, Rohani S C, Feinstein P, Mombaerts P, Friedman J M. Selective deletion of leptin receptor in neurons leads to obesity. J Clin Invest. 2001;108:1113–1121. doi: 10.1172/JCI13914. [DOI] [PMC free article] [PubMed] [Google Scholar]
- Buettner C, Pocai A, Muse E D, Etgen A M, Myers M G, Jr, Rossetti L. Critical role of STAT3 in leptin’s metabolic actions. Cell Metab. 2006;4:49–60. doi: 10.1016/j.cmet.2006.04.014. [DOI] [PMC free article] [PubMed] [Google Scholar]
- Buettner C, Muse E D, Cheng A, Chen L, Scherer T, Pocai A, Su K, Cheng B, Li X, Harvey-White J, Schwartz G J, Kunos G, Rossetti L. Leptin controls adipose tissue lipogenesis via central, STAT3-independent mechanisms. Nat Med. 2008;14:667–675. doi: 10.1038/nm1775. [DOI] [PMC free article] [PubMed] [Google Scholar]
- Bodary P F, Shen Y, Ohman M, Bahrou K L, Vargas F B, Cudney S S, Wickenheiser K J, Myers M G, Jr, Eitzman D T. Leptin regulates neointima formation after arterial injury through mechanisms independent of blood pressure and the leptin receptor/STAT3 signaling pathways involved in energy balance. Arterioscler Thromb Vasc Biol. 2007;27:70–76. doi: 10.1161/01.ATV.0000252068.89775.ee. [DOI] [PubMed] [Google Scholar]
- Pfitzner E, Kliem S, Baus D, Litterst C M. The role of STATs in inflammation and inflammatory diseases. Curr Pharm Des. 2004;10:2839–2850. doi: 10.2174/1381612043383638. [DOI] [PubMed] [Google Scholar]
- Matsukawa A, Takeda K, Kudo S, Maeda T, Kagayama M, Akira S. Aberrant inflammation and lethality to septic peritonitis in mice lacking STAT3 in macrophages and neutrophils. J Immunol. 2003;171:6198–6205. doi: 10.4049/jimmunol.171.11.6198. [DOI] [PubMed] [Google Scholar]
- Takeda K, Clausen B E, Kaisho T, Tsujimura T, Terada N, Forster I, Akira S. Enhanced Th1 activity and development of chronic enterocolitis in mice devoid of Stat3 in macrophages and neutrophils. Immunity. 1999;10:39–49. doi: 10.1016/s1074-7613(00)80005-9. [DOI] [PubMed] [Google Scholar]
- Kano A, Wolfgang M J, Gao Q, Jacoby J, Chai G X, Hansen W, Iwamoto Y, Pober J S, Flavell R A, Fu X Y. Endothelial cells require STAT3 for protection against endotoxin-induced inflammation. J Exp Med. 2003;198:1517–1525. doi: 10.1084/jem.20030077. [DOI] [PMC free article] [PubMed] [Google Scholar]
- Radaeva S, Sun R, Pan H N, Hong F, Gao B. Interleukin 22 (IL-22) plays a protective role in T cell-mediated murine hepatitis: IL-22 is a survival factor for hepatocytes via STAT3 activation. Hepatology. 2004;39:1332–1342. doi: 10.1002/hep.20184. [DOI] [PubMed] [Google Scholar]
- Munzberg H, Myers M G., Jr Molecular and anatomical determinants of central leptin resistance. Nat Neurosci. 2005;8:566–570. doi: 10.1038/nn1454. [DOI] [PubMed] [Google Scholar]
- El Kasmi K C, Holst J, Coffre M, Mielke L, de Pauw A, Lhocine N, Smith A M, Rutschman R, Kaushal D, Shen Y, Suda T, Donnelly R P, Myers M G, Jr, Alexander W, Vignali D A, Watowich S S, Ernst M, Hilton D J, Murray P J. General nature of the STAT3- activated anti-inflammatory response. J Immunol. 2006;177:7880–7888. doi: 10.4049/jimmunol.177.11.7880. [DOI] [PubMed] [Google Scholar]
- Lam Q L, Lu L. Role of leptin in immunity. Cell Mol Immunol. 2007;4:1–13. [PubMed] [Google Scholar]