

Abstract
The use of automated watering systems for providing drinking water to rodents has become commonplace in the research setting. Little is known regarding bacterial biofilm growth within the water piping attached to the racks (manifolds). The purposes of this project were to determine whether the mouse oral flora contributed to the aerobic bacterial component of the rack biofilm, quantify bacterial growth in rack manifolds over 6 mo, assess our rack sanitation practices, and quantify bacterial biofilm development within sections of the manifold. By using standard methods of bacterial identification, the aerobic oral flora of 8 strains and stocks of mice were determined on their arrival at our animal facility. Ten rack manifolds were sampled before, during, and after sanitation and monthly for 6 mo. Manifolds were evaluated for aerobic bacterial growth by culture on R2A and trypticase soy agar, in addition to bacterial ATP quantification by bioluminescence. In addition, 6 racks were sampled at 32 accessible sites for evaluation of biofilm distribution within the watering manifold. The identified aerobic bacteria in the oral flora were inconsistent with the bacteria from the manifold, suggesting that the mice do not contribute to the biofilm bacteria. Bacterial growth in manifolds increased while they were in service, with exponential growth of the biofilm from months 3 to 6 and a significant decrease after sanitization. Bacterial biofilm distribution was not significantly different across location quartiles of the rack manifold, but bacterial levels differed between the shelf pipe and connecting elbow pipes.
Abbreviations: RLU, relative light units; SM agar, standard methods agar; TSA, trypticase soy agar
Automated watering systems are commonly used in the research setting to provide safe drinking water to a variety of laboratory animal species. Advantages of automated watering include reduction in labor costs and injuries to animal care staff and consistency in providing fresh potable water to animals. Several strategies exist to ensure that the water provided through these systems is free of microbial, organic, and ionic contamination. Chlorination, acidification, ultrafiltration, reverse-osmosis filtration, treatment with ultraviolet light, distillation, and periodic flushing of the watering system have all been applied to ensure the highest possible water quality. Despite these efforts to maintain high-quality drinking water, automated watering systems are not sterile environments. Planktonic bacteria in watering systems have the propensity to form biofilm colonies on the inner surfaces of the piping.23-27,34,36 Biofilm is an aggregation of often mixed populations of microorganisms that excrete adhesive and protective matrices, enabling the biofilm to proliferate and resist disinfection. Biofilm can develop at any fluid–solid interface (for example, the teeth in your mouth, a river bed, or the pipes of a water distribution system). The microbial classification and development of biofilm in automated watering systems, and in particular rodent watering systems, have not been described previously.
Automated watering racks supply water to rodent cages through a piping system called the rack manifold. The current report focuses on biofilm development within the rack manifold because the inside surfaces of these pipes are not directly exposed to the sanitizing aspects of the rack washing process (that is, detergents and 180 °F rinse water), and this portion of the watering system is in closest proximity to the animals. In a pilot study to assess biofilm development at our facility, 18 rodent racks were sampled at 1 of 3 time points: 1 mo, 3 mo, or 6 mo after their last sanitation. Samples of the water stream (100 to 200 ml) from within the rack manifold were obtained by draining water from the end of the rack piping and filtering it (pore size, 0.2-μm) into a sterile container (Analytical Test Filter Funnel 145, Nalgene, Rochester, NY). Biofilm samples were obtained by detaching removable sections of the piping and placing a culture swab on the inner surface of the piping attached to the rack. The filters and swabs were transferred onto low-nutrient agar plates: R2A (Difco, Detroit, MI) and standard methods (SM) agar (General Laboratory Products, Bolingbrook, IL). R2A and SM agars are both nutrient-poor media; R2A agar is recommended for use in water-quality determinations and principally is used to isolate bacteria that are acclimated to low-nutrient environments.9,10,20,28 R2A agar plates were incubated at room temperature for 7 d. SM agar plates were incubated at 35 °C degrees for 2 d. Based on results from culture of the drain water alone, 7 of the 18 racks had bacterial contamination; however, 15 of the 18 racks were positive based on cultures of biofilm from inside the rack piping. In all instances in which the filtered water samples were positive, swab samples were also positive. The 3 racks that did not yield bacterial growth from biofilm samples were all at 1 mo after sanitation. In addition, maximal bacterial growth from the 1-mo samples (7 CFU) was much less than that from the 3-mo (369 CFU) and 6-mo (788 CFU) samples, based on colony counts from the SM agar plates.
The pilot investigation confirmed that bacterial biofilm was developing within automated racks after sanitation and that culture of drain water was not an accurate measure of bacterial contamination; the results also suggested that after sanitation, the bacterial population increased gradually over time. The pilot study also raised questions regarding the development of bacterial biofilm within our rodent automated watering systems, including source of bacteria, speciation of the bacteria, effectiveness of sanitation practices, and distribution of the biofilm within the rack manifold piping.
We therefore designed a 3-phase study to address these questions. We hypothesized that most of the biofilm bacteria originated from the source water and that the oral bacterial flora of the mice contributed minimally (if at all) to the biofilm. This scenario deemed the alternative hypothesis (that mouse oral flora contributed significantly to the biofilm) to be less feasible because it would require seeding and biofilm colonization with bacteria from the mouse oral cavity into the watering manifold against the flow of water and past the valve seal, a process that we felt was unlikely to occur. This alternative hypothesis was evaluated during Phase I of the study. Phase II of our study evaluated the development of bacterial biofilm in the watering system over 6 mo and the efficacy of our sanitation practices at bacterial biofilm reduction. Based on the pilot study, our hypothesis for Phase II was that biofilm bacterial levels would increase over time and that our sanitation practices would virtually eliminate viable biofilm bacteria. Phase III examined the distribution of biofilm in the rodent watering manifold, and we hypothesized that bacterial biofilm levels would increase as water moved through the rack manifold (that is, the upper shelves at the end of the manifold distribution would have more biofilm than would the lower shelves at the beginning). In addition, assessment of biofilm distribution likely would determine whether access sites to the lumen of the piping could be considered equivalent for statistical sampling purposes in future studies.
Materials and Methods
Phase I—comparison of oral and biofilm flora.
Forty mice (5 mice each of 8 different vendor and strain combinations) were evaluated for the oral flora aim of the study. These mice were of various ages and both sexes and comprised 6 different strain and stocks and 4 different vendors. Stocks and strains obtained from Charles River Laboratories (Wilmington, MA) included C57BL/6NCrl, BALB/cAnNCrl, and Crl:CD1(ICR). Harlan (Indianapolis, IN) provided C57BL/6NHsd and 129P2/OlaHsd strains of mice. FVB/NJ and B6.Cg-m+/+ Leprdb/J were procured from The Jackson Laboratory (Bar Harbor, ME). C57BL/6NTac mice were obtained from Taconic Farms (Albany, NY).
All mice were maintained in specific pathogen-free housing, which at our institution is defined as absence of pinworms and antibodies to Sendai virus, pneumonia virus of mice, mouse hepatitis virus, minute virus of mice, Theiler mouse encephalomyelitis virus, reovirus, Mycoplasma pulmonis, mouse parvovirus, rotavirus, lymphocytic choriomeningitis virus, mouse adenovirus, Ectromelia virus, K virus, and polyoma virus. The mice were housed in accordance with the Guide for the Care and Use of Laboratory Animals,25 and all husbandry practices were performed according to institutional standard operating procedures. All mice used in the study were housed under protocols approved by the University of Michigan Committee on Use and Care of Animals, which is the university's institutional animal care and use committee. The University of Michigan is accredited by AAALAC International.
On arrival at our facility, the vendor's transport container was opened under a HEPA-filtered hood using standard microisolation techniques. Each mouse was restrained and the oral cavity swabbed with a sterile polyester swab (Calgiswab, Fisher Scientific, Dallas, TX). Care was taken to swab buccal, lingual, and dental surfaces. The swab was placed into a sterile transport media container containing thioglycolate (Edge Biologicals, Memphis, TN) or brain–heart infusion (PML Microbiologicals, Wilsonville, OR). After sampling, mice were placed in a standard (7.75 × 12 × 6.5 in.) polycarbonate mouse box (Allentown Caging Equipment, Allentown, NJ) with filtered microisolation tops. The 5 mice from each vendor–strain combination were housed together for the duration of the study. Mice were housed in 2 buildings on campus and maintained on HEPA-filtered ventilated racks (Allentown Caging Equipment) with automated watering systems (Edstrom Industries, Waterford, WI). Mice were fed commercial rodent chow ad libitum (LabDiet 5001, PMI International, Brentwood, MO). Water provided to the mice was supplied by the City of Ann Arbor and is in compliance with the United States Environmental Protection Agency standards for drinking water.13 Ann Arbor municipal water is a combination of 15% ground water and 85% Huron River water. Upon delivery to the treatment plant, the water undergoes two 3-step treatment stages; the 3 steps in each stage are rapid mixing, flocculation (slow mixing), and settling (gravity-based removal of solids that form in the softening process). The first stage softens the water (remove ions) with the addition of lime. Afterwards, the pH is adjusted with carbon dioxide during the second stage.2 The water then is disinfected with ozone, alkalinized with sodium hydroxide, stabilized with sodium hexametaphosphate, and filtered through granular activated carbon.31 Final and residual disinfection is accomplished by adding monochloramine at 2.8 to 3.2 mg/l.31 Monochloramine is formed by mixing sodium hypochlorite and ammonia.3 Finally, hydrofluosilicic acid is added to achieve approximately 1 mg/l as fluoride ion, because this is the amount public health agencies recommend for optimal protection against tooth decay.4 At the University of Michigan, the municipal tap water is passed through an inhouse 5.0-μm filter (Edstrom Industries) before distribution to the animal housing rooms.
The 10 automated watering manifolds used for Phase II were sampled for bacterial speciation at months 0, 2, and 6 for the Phase I comparison with oral flora. Methods used to obtain biofilm samples from the rack manifolds are described in Phase II. Sample swabs from mouse oral flora were maintained in thioglycollate or brain–heart infusion broth for 24 h prior to plating on R2A and blood-enriched trypticase soy agar (TSA) plates (PML Microbiologicals, Wilsonville, OR). R2A agar plates were incubated at room temperature (22 °C) for 7 d. TSA plates were incubated at 37 °C for 5 d. Colonies from the R2A rack manifold samples were counted after 3 and 7 d of growth. Individual bacterial colonies from the TSA plates were gram-stained and identified with the use of bacterial identification strips (API Staph, API 20 Strep, API Coryne, API 20E, and API 20NE; bioMerieux, Marcy l'Etoile, France) according to the manufacturer's instructions. The gram-staining characteristics and the genus and species of each bacterial isolate were recorded for each mouse oral flora or rack biofilm sample. Partially identified bacteria (gram-staining characteristics or genus only) were noted also.
Phase II—biofilm development over 6 mo.
Automated watering manifolds from several rodent rooms containing various strains of mice for multiple investigators were sampled to quantify the resident biofilm bacterial flora over time. Ten ventilated mouse racks with automated watering (Allentown Caging) were studied; the manifolds on these racks are constructed of grade 316 stainless steel. Prior to placing the racks into service each was sanitized with a 16.5-min cycle including a 3-min 180 °F water rinse in a rack washer (Basil 9500, Steris Corporation, Mentor, OH). This sanitation was followed by a flush of the rack manifold piping with a 10- to 20-ppm chlorine solution for 2 min. The chlorine solution was allowed to drain and was further displaced by a 10-min flush with room water when the racks were placed into service. Biofilm samples were taken before washing (‘pre-wash’), after washing but before the chlorine flush (‘post-wash’), and after chlorine flush (‘post-flush’), to assess the effectiveness of our cage washing practices. Samples were then obtained monthly over 6 mo of service. After 6 mo, the racks were sanitized, and post-wash and post-flush samples again were obtained. To obtain the biofilm samples, the C-shaped pipe (‘elbow’) connecting the horizontal (‘shelf’) pipes was removed. A sterile microbiologic transport swab (FisherFinest Transport Swabs, Fisher Scientific) was introduced 10 cm into the elbow or shelf pipe, manually rotated around the pipe lumen for 15 s, and then placed in transport medium (sodium thioglycolate). Two samples were taken from each rack at each time point: 1 from the lumen of the elbow pipe, and 1 from the lumen of the respective shelf pipe. Elbow and shelf locations were randomized without replacement to control for any variables introduced by rack position and to prevent resampling at any site. The elbow and shelf samples from each junction were randomly submitted for heterotrophic bacterial plate counts and bacterial ATP levels. At months 0, 2, and 6, the samples were further used for bacterial speciation (see Phase I). One-tailed Wilcoxon signed-rank tests (SAS version 9.1, SAS Institute, Cary, NC, P = 0.05) were performed to identify significant increases in CFU and ATP from baseline (month 0, post-flush) to month 6 (pre-wash) samples.
Phase III—analysis of biofilm distribution within the automated watering manifolds.
Six individual ventilated automated watering racks were used for this phase of the study. Two racks each were evaluated after 4, 5, and 6 mo of service. The lumen of the automated watering manifold piping was sampled at every elbow and shelf site (n = 32) on the rack (Figure 1). These samples were assessed for bacterial ATP only; no heterotrophic plate counts or speciation were done during this phase. Statistical analyses included median and interquartile range, Wilcoxon signed-rank test, and repeated measures analysis of variance (SAS version 9.1, SAS Institute, Cary, NC). Significance was defined as a P value of less than or equal to 0.05. Mice housed on these racks belonged to other investigators at the institution and were on protocols approved by the University of Michigan Committee on Use and Care of Animals.
Figure 1.

Schematic of automated watering rack, with cages and shelves cut away for visualization of the watering manifold. The ‘elbow joint’ has been pulled from the manifold for visualization. In the magnified circle, the elbow (E) and shelf (S) locations of biofilm sampling are labeled.
Determination of bacterial ATP (phases II and III).
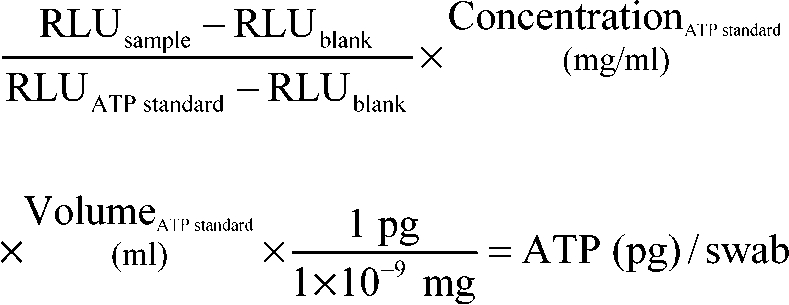
Bacterial ATP determination was completed with assistance of staff and faculty members from the University of Michigan School of Public Health. This assay uses a luciferin–luciferase reaction with microbial ATP to reliably quantify viable bacteria in a water or surface sample.8,15,17-19,21,33 A luminometer (New Horizons Diagnostics, Columbia, MD) measures the reaction in relative light units (RLU), which can be converted to picograms of ATP by using control samples. For phase II, the microbiologic transport containers for the swabs contained 0.5 ml of sterile saline and a sponge that surrounded the swab tip during transport. The sponge and swab were massaged for 30 s to promote release of the bacteria from the swab and then the swab was removed. The 0.5 ml of saline was removed from the transport container and forced through a 0.45-μm filter attached to a cuvette in a pre-assembled unit (Filtravette, New Horizons Diagnostics). Four drops of somatic releasing agent (New Horizons Diagnostics, Columbia, MD) was added to the bacteria-containing saline, which was pushed through the filter with positive pressure from a custom-designed syringe. Somatic releasing agent lyses somatic (nonbacterial) cells that may interfere with microbial ATP quantification. This step was performed in duplicate; then 2 drops of bacterial cell releasing agent were added to the filtered sample in the cuvette and gently mixed with 50 μL of luciferin–luciferase reagent (New Horizons Diagnostics). The sample then was inserted into the luminometer, which reported the ATP value in RLU. ATP standards (New Horizons Diagnostics) and sterile phosphate-buffered saline were tested to normalize the data. RLU was converted into ATP (pg) using the equation:
 |
For phase III, the method of biofilm sampling was altered to include the use of a hand drill to standardize sample acquisition. The sterile swab was fixed in the drill chuck and rotated inside the pipe lumen for 15 s on low speed. The swab was spun in 0.5 ml sterile saline for 15 s and the resulting solution used for ATP determination as previously described.
Evaluation of temperature of rack washer (phase III).
The results of ATP determination for phase III prompted the question of whether sanitation, as defined as temperature achieved during rack wash, varied for different regions of the automated watering manifold. Ten surface temperature-indicating tapes (Thermax 5 Level Clock Indicator, Thermographic Measurements, Glenview, IL) were applied to various locations and levels of an automated watering rack manifold (Figure 2). A region of the tape changes color based on the maximal temperature reached; tapes used had a scale of either 140 to 180 °F or 190 to 230 °F in 10 °F increments. Tapes were placed directly on the watering manifold piping where elbows and shelves adjoined and along the middle of shelves. The rack washer was engaged for a 16.5-min including a 3-min 180 °F water rinse. The 140 to 180 °F tapes were assessed in duplicate; the 190 to 230 °F tapes were assessed in triplicate.
Figure 2.

Schematic of automated watering manifold with location of temperature tapes (black circles).
Results
Phase I—comparison of oral and biofilm flora.
All 40 mouse oral swabs yielded aerobic bacterial growth on R2A and blood-enriched TSA agar; 64 total bacterial isolates were identified (Table 1). Staphylococcus spp. were found in 50% of the mice and comprised 31% (20 of 64) of the isolates identified. Escherichia coli, Enterococcus faecalis, and Enterococcus faecium represented 18.8%, 12.5%, and 9.4% of the total isolates, respectively. Overall the aerobic bacterial makeup of the mouse oral flora was 67.2% gram-positive (43 of 64 isolates) and 32.8% (21 of 64) gram-negative microbes. Aerobic bacterial isolates varied widely across vendors and strains; a description of the bacterial isolation by vendor and strain is included in Table 1.
Table 1.
Isolates identified by strain
| C57BL/6NCrl | BALB/cAnNCrl | Crl:CD1 (ICR) | C57BL/6NHsd | 129P2/OlaHsd | FVB/NJ | B6.Cg-m+/+ Leprdb/J | C57BL/6NTac | Total isolates | % of isolates | |
| Eschericia coli (G–) | 3/5 | 3/5 | 1/5 | 5/5 | 12 | 18.8 | ||||
| Probable Eschericia coli (G–) | 1/5 | 1 | 1.6 | |||||||
| Brevundimonas vesicularis (G–) | 3/5 | 3 | 4.7 | |||||||
| Proteus mirabilis (G–) | 2/5 | 2 | 3.1 | |||||||
| Probable Proteus spp. (G–) | 2/5 | 1/5 | 3 | 4.7 | ||||||
| Corynebacterium, Cellumonas, or Microbacterium spp. (G+) | 1/5 | 1 | 1.6 | |||||||
| Enterococcus faecalis (G+) | 1/5 | 5/5 | 6 | 9.4 | ||||||
| Enterococcus faecium (G+) | 4/5 | 4/5 | 8 | 12.5 | ||||||
| Probable Lactobacillus spp. (G+) | 1/5 | 5/5 | 6 | 9.4 | ||||||
| Staphylococcus aureus (G+) | 4/5 | 1/5 | 5 | 7.8 | ||||||
| Staphylococcus xylosus (G+) | 1/5 | 2/5 | 3 | 4.7 | ||||||
| Staphylococcus warnerii (G+) | 2/5 | 2 | 3.1 | |||||||
| Staphylococcus hominis (G+) | 1/5 | 1 | 1.6 | |||||||
| Unidentified Staphylococcus spp. (G+) | 1/5 | 2/5 | 1/5 | 5/5 | 9 | 14.1 | ||||
| Unidentified cocci (G+) | 1/5 | 1/5 | 2 | 3.1 | ||||||
| Total isolates from strain | 8 | 9 | 9 | 10 | 9 | 6 | 5 | 8 | 64 |
G+, gram-positive; G–, gram-negative
A total of 64 bacterial isolates were identified. The number of isolates/number of mice for each strain tested is shown. Staphylococcus spp. were identified in 50% of the mice. Escherichia coli was the most common aerobic bacteria, comprising 18.8% of total isolates. Mice from the same vendor and strain often had similar oral flora.
The automated watering manifold sampling resulted in 96 aerobic bacterial isolates. Identification of all isolates was not possible due to limited resources at the time of this study. The initial 10 samples (after sanitation and prior to use) yielded 27 different isolates on R2A agar, of which 9 (33%) were gram-positive and 2 (7%) were gram-negative (Figure 3). The remaining 16 (59%) of these isolates did not grow on TSA plates, so gram-staining characteristics were not determined. At 2 mo, the 10 samples of rack biofilm again yielded 27 isolates, of which 14 (52%) were gram-positive, 2 (7%) were gram-negative, 10 (37%) did not grow on TSA agar, and 1 (7%) could not be characterized by Gram staining. By month 6, 10 samples yielded 42 different aerobic bacterial isolates. The gram-positive bacterial component was 24 of 42 (57%), and 5 isolates (12%) were gram-negative; 7 isolates (17%) had no regrowth on TSA, and 6 (14%) had inconclusive Gram staining results.
Figure 3.

Gram-staining characteristics of biofilm isolates. Ten samples from each time point (initial [0 mo], 2 mo, 6 mo) were cultured on low-nutrient agar and transferred to TSA plates for identification. The diversity of the aerobic biofilm bacterial population increased over time.
A variety of Staphylococcus spp. were isolated from the mouse and biofilm, but no species were consistent between both sources (Table 2). The primary mouse oral flora isolates, Escherichia coli and Enterococcus faecium, were never found in the rack manifold while in service. Enterococcus faecalis was isolated from a single rack manifold sample taken during sanitation (post-wash). Coliform bacteria were never isolated from the rack biofilm.
Table 2.
Positively identified aerobic bacterial isolates
| Mouse oral flora | Biofilm |
| Enterococcus faecalis | Enterococcus faecalisa |
| Enterococcus faecium | Enterococcus avium |
| Escherichia coli | Brevundimonas vesicularis |
| Mannheimia haemolytica | Pseudomonas stutzeri |
| Staphylococcus aureus | Staphylococcus auriculans |
| Staphylococcus hominis | Staphylococcus capitis |
| Staphylococcus warnerii | Staphylococcus epidermidis |
| Staphylococcus xylosus | Staphylococcus saphrophyticus |
| Proteus mirabilis | Corynebacterium aquaticum |
| Arthrobacter spp. | |
| Micrococcus spp. | |
| Rhodococcus spp. |
A variety of Staphylococcus spp. were isolated from the mouse and biofilm, however, no species were consistent between both sources. The primary mouse oral flora isolates, Escherichia coli and Enterococcus faecium, were not isolated from a rack manifold while in service. Enterococcus faecalis was isolated from one rack manifold sample taken during sanitation (post-wash and pre-flush).
Sample obtained from the rack manifold during sanitation and not while in service in the animal room
Phase II—biofilm development over 6 mo.
The number of CFU per swab and picograms of bacterial ATP per swab were averaged for all 10 racks at each time point (Figure 4). Average CFU and ATP levels increased every month of the study and maintained a similar relationship at all time points. After the 3rd month of study, both mean CFU and ATP levels increased sharply over months 4, 5, and 6. The increase in CFU from baseline to 6 mo was statistically significant (P < 0.01); however the increase in ATP for the same time period failed to reach statistical significance. For all racks, cage washing and chlorine flushing (the post-wash and post-flush samples) reduced CFU and ATP levels to essentially 0 after 6 mo of study. However, the mean ATP levels at both post-flush time points were higher than their corresponding post-wash mean ATP levels (Figure 4).
Figure 4.

Mean CFU (after 7 d of culture) and ATP levels increased monthly during the study and maintained a similar relationship at all time points. Both CFU and ATP increased sharply after month 3. Sanitation practices (post-wash and post-flush) were effective at reducing viable biofilm.
CFU and ATP data from 4 sampling dates (1 sample from the 1-mo time point, 3 from the 2-mo point, 1 from the 3-mo point, and 2 from the 4-mo time point) were excluded from analysis. Racks sampled on these dates (all within May and June 2004) had exponentially higher ATP readings than did other racks at the same time points but sampled at different times of the year.
In addition, the source water obtained from the animal rooms during May and June 2004 had increased ATP readings; however, CFU values did not correlate with this transient increase in ATP. Exclusion of these data resulted in a reduction of 5% of the total data points.
Phase III—analysis of biofilm distribution within the automated watering manifolds.
Shelf sites had significantly more bacterial ATP (biofilm) than did elbow sites at months 4, 5, and 6 combined (0.213 versus 0.050 pg ATP/swab; P < 0.001; Figure 5), even though the paired sampling sites were only 10 cm apart. For this reason, elbows were excluded from the remaining statistical comparisons. Month 4 shelves had significantly less bacterial ATP than did month 5 and month 6 shelves (0.042, 0.400, and 0.505 pg ATP/swab, respectively; P < 0.001 for both comparisons).
Figure 5.

Bacterial ATP in elbows and shelves. The box represents the middle 50% of data points and the labeled line the median value. For months 4, 5, and 6 combined, shelf sites had significantly more bacterial ATP (biofilm) than did elbow sites (0.213 versus 0.050 pg ATP/swab; P < 0.001).
The sampling point data were also analyzed by quartile of the rack manifold to evaluate the accumulation of biofilm as water traversed the piping system. Only data from shelf locations were used for this aim of the study. Sites 1 through 4 were combined to represent the bottom 25% of the rack, sites 5 through 8 represented the bottom-middle 25% of the rack, sites 9 through 12 represented the top-middle 25% of the rack, and sites 13 through 16 represented the top 25% of the rack (Figure 6). Figure 7 shows the median ATP value for each quartile by rack. For statistical analysis, the median ATP value for each location quartile was calculated separately for each rack and used to assess the effect of location quartile on ATP. A repeated measures analysis of variance indicated there was no significant effect of location quartile on ATP value. In addition, no significant differences between quartiles of month 4, 5, and 6 racks were determined.
Figure 6.

Division of quartiles of the watering rack manifold. Sites 1 through 4, bottom quartile; sites 5 through 8, bottom-middle quartile; sites 9 through 12, top-middle quartile; sites 13 through 16, top quartile.
Figure 7.

Median ATP values for shelves by quartile. No significant differences were found between the rack quartiles, and no significant differences existed between racks of different months of service.
Evaluation of temperature of rack washer (phase III).
For both trials, all 140 to 180 °F temperature indicator tapes placed on the automated watering rack manifold changed color, indicating the temperature exceeded 180 °F in the rack washer. When the evaluation was repeated with the 190 to 230 °F tapes, the temperature exceeded 190 °F but not 200 °F at all manifold locations evaluated during the rack wash process for all 3 replicates.
Discussion
Phase I—comparison of oral and biofilm flora.
The mouse oral flora and the automated watering manifold contained distinctly different populations of aerobic bacteria. In this study, the aerobic mouse oral flora primarily was composed of Staphylococcus spp., Escherichia coli, Enterococcus faecalis, and Enterococcus faecium. These findings were consistent with aerobic isolates reported by others,11,29,30,32 except for an absence of Lactobacillus murinus. The unidentified gram-positive bacilli isolated from all 5 of the 129P2/OlaHsd mice and the single Crl:CD1(ICR) mouse may have been Lactobacillus spp. Lactobacillus from the mouse pharynx has been reported to grow on TSA, but increased incubation temperature (45 °C) and anaerobic techniques improve bacterial recovery.14,32
Not surprisingly, the aerobic bacterial species that were isolated were influenced greatly by the source and strain of the mice. Escherichia coli was isolated from Charles River and Harlan mice but not animals from The Jackson Laboratory or Taconic. Enterococcus faecium was isolated from 1 of 2 strains from Harlan and The Jackson Laboratory but was never isolated from Charles River or Taconic animals. These examples illustrate the findings of others, who determined that mouse oral flora is highly dependent on the vendor11,30 and mouse strain.11,35 This information should be taken into consideration to minimize research variables when consistency in oral flora is of high importance.
Overall, most of the bacteria isolated in the mouse oral cavity upon arrival at our facility were inconsistent with bacteria positively identified in the rack biofilm community. Enterococcus faecalis was the only bacterial species isolated from both the mouse oral cavity (FVB/NJ and B6.Cg-m+/+ Leprdb/J) and the rack biofilm; this organism was recovered only once from the rack manifold during the sanitation process (after washing and before chlorine flushing). In addition, the rack biofilm consisted of a large variety of staphylococci, none of which matched the many species of Staphylococcus isolated from the mice. This finding supports the hypothesis that aerobic bacterial species in the biofilm of rodent automated watering manifolds are derived from the source water, whereas the mouse oral flora contributes little to the aerobic biofilm bacterial population. However, we acknowledge that only aerobic bacteria were evaluated in the mouse oral flora and automated watering manifold and that a comparison of the anaerobic bacterial populations is needed to truly establish the source. The percentages of bacterial isolates that would not grow when transferred from R2A agar to TSA were 59%, 37%, and 17% for months 0, 2, and 6, respectively. This finding indicates that the biofilm bacteria that could survive at room temperature in a nutrient-poor (R2A agar) environment but not in a 37 °C incubator on nutrient-rich media (blood-enriched TSA plates). From this in vitro result we infer that these bacterial species are incapable of surviving in or on a mouse and therefore were derived from the water supply. In summary, these findings suggest that biofilm bacteria are derived from the source water and that the mouse bioflora contributes negligibly to biofilm development. Circumstantial evidence supporting source water as the origin of biofilm bacteria includes the absence of coliforms (the bacterial marker assessed by water treatment facilities), knowledge that water suitable for human consumption is not sterile water, and the fact that the only additional treatment measure used at our facility is a particulate filter that would readily allow bacterial passage. A conclusive study would require the ability to readily sample biofilm adhered to piping within the building system to see whether the isolates match the bacterial species found in the automated watering manifolds.
Phase II—biofilm development over 6 mo.
We addressed our rack sanitation practices by evaluating CFU and ATP before, during, and after the sanitation process. Sanitation was assessed prior to enrollment in the study and after completion of 6 mo of service. Our method of rack sanitation is a 2-stage process: initial rack washing including a 3-min 180 °F final rinse, followed by a 2-min flush of the watering manifold with a 10- to 20-ppm chlorine solution. Both CFU and ATP were reliable indicators of successful rack sanitation, as noted by the sharp decline in values for both indices (virtually to 0). Surprisingly, the mean ATP levels at both post-flush time points were lightly higher than their corresponding post-wash mean ATP levels. This increase might be attributed to the racks from a single building, which had increased ATP values after chlorine flush due to an improperly functioning chlorine flush station. A corresponding elevation in CFU was not noted at the post-flush time points. The bacteria that were resident within this chlorine flush station (and thus introduced into the manifold) likely could not grow on R2A agar but could still be detected by ATP bioluminescence. Bacterial quantification using CFU requires culture of the organism to obtain an estimate of the bacterial count in the original sample. ATP bioluminescence provides a rapid, nearly ‘real-time’ estimation of bacterial quantity that requires neither specific media nor specialized conditions for analysis.7
Several chemical and physical methods are available to remove and reduce biofilm in watering systems. In addition to using monochloramine-treated municipal water, our facility filters the water to 5.0 μm before it reaches the animal rooms. The 3-min hot-water rinse (180 °F) in our rack washer is the first step in sanitation after the rack has been in service. To effectively destroy all biofilm bacteria requires a temperature of 95 °C (203 °F) for a minimum of 100 min.5 This prolonged method of sanitation has both economic and logistic issues hindering its practicality. Water maintained at or above 80 °C (176 °F) will prevent the growth of most bacteria and is effective at reducing the viable biofilm bacteria.22 The malfunctioning chlorine flush station not withstanding, the administration of hyperchlorinated water through the watering manifold also contributes towards successful sanitation. Chlorine is one of several oxidizing biocides used in water systems to kill bacteria and destroy the polysaccharide matrix of the biofilm.22 Biofilm bacteria are 150 to 3000 times more resistant to chlorine16 and 500 times more resistant to antimicrobials6 than are their free-floating (planktonic) counterparts. A combination of factors, such as alterations in metabolic rate and impaired diffusion of biocides through the biofilm matrix, likely are responsible for the resistance of biofilm bacteria to routine sanitation.12 Despite these protective mechanisms, rack washing and chorine flush procedures were successful in dramatically reducing the amount of biofilm in the automated watering manifold at our facility.
As hypothesized, the amount of biofilm bacteria residing in the automated watering system increased with time. According to both heterotrophic plate counts and ATP concentrations, the mean bacterial load in the rodent automated watering racks gradually increased for the first 3 mo before a sharp increase in the respective measures over the subsequent 3 mo. The relationship is similar to the lag and log phases of microbial growth.1 In response to this finding, our institutional standard operating protocols for buildings with untreated municipal water have been amended to decrease the time between rack sanitations from 6 to 3 mo.
In the Results section, we noted that samples from May and June 2004 yielded significantly higher ATP values than those at other times of the year and that these increased values lacked any correlation with CFU data. These findings suggested that the increase was due to bacteria incapable of being cultured by our methodology. Investigating possible reasons for this increase, we consulted the staff of the Ann Arbor Water Treatment Plant, but the exact cause of the increased bacterial ATP levels could not be determined.
Phase III—analysis of biofilm distribution within the automated watering manifolds.
The results from Phase III rejected the hypothesis that levels of bacterial biofilm would increase as sampling progressed from the beginning to the end of the rack manifold (that is, in the direction of water flow). We had suspected a possible increase in biofilm because the drinking water for ‘downstream’ cages would be more stationary than for the cages at the beginning of the piping run, because fewer mice would be available to advance the water by consumption. On the basis of the shelf pipes only, there was no significant effect of rack location quartile on bacterial ATP, nor did month 4, 5, and 6 racks show significant differences in ATP values (Figure 7). Based on these results, we have decided to continue to treat all shelf sampling points as equivalent and to select sampling sites via random number generation.
The discovery that the elbow sites had significantly less biofilm bacteria than did the corresponding shelves 10 cm away raised the question of what was different between elbows and shelves in regard to location and flow dynamics. Although the elbows constitute the vertical connection between shelves, our sample site was within the horizontal segment of this connecting pipe. The discrepancy between elbow and shelf bacterial ATP values prompted evaluation of how sanitization occurs in the mechanical rack washer. We speculated that the hot-water rinse might not heat the rack manifold uniformly, leading to poorer sanitization of the internal regions of the manifold than the exposed elbows. This theory was disproved in part, because all sites evaluated in the rack manifold reached 190 °F but did not exceed 200 °F during the rinse cycle. However, the temperature tape system does not indicate for how long the tape locations on the rack were above 190 °F, just that they reached that temperature. Nor were we able to measure the amount of physical vibration that the more exposed elbows may have received during cage wash in contrast to the better secured shelf pipes. We now suspect that water-flow dynamics may have played a role in the difference; however, such an evaluation was beyond the scope of our study.
Regardless of the reason, the elbows are no longer a preferred site for biofilm sampling in the rack manifold. Although this decision may raise questions regarding the methods in the phase II study, in which both elbows and shelves were sampled, we randomly assigned the elbow and shelf samples for CFU or ATP evaluation. Because of this random assignment, the shape of the growth curve using the mean ATP and CFU values is still valid; in fact, the values likely are suppressed because of the inclusion of the elbow sample data. However, this randomization likely contributed to the nonsignificant result when analyzing the increase in ATP from baseline to 6 mo.
There are currently no published data on what is acceptable or unacceptable regarding biofilm or bacterial levels in automated watering systems. With the increasing numbers of genetically modified and immunodeficient mice in research institutions, the watering system should not be disregarded as a potential source of disease. Sanitation practices at the University of Michigan were successful in reducing viable biofilm bacteria in the automated watering rack, but the amount of aerobic bacteria in our rack manifolds increased exponentially after 3 mo of use. For this reason, we chose to change our rack sanitation schedule from every 6 mo to every 3 mo. The rate of biofilm development at other institutions will be influenced by the source water treatment, facility treatment, and rack manifold sanitation practices. As such, the change in sanitation practices that we adopted may not be appropriate, or even necessary, at other institutions, especially if they provide drinking water that has been treated at the animal facility in excess of the municipal level (for example, reverse osmosis, hyperchlorination). In addition, this study only evaluated stainless steel manifolds, and our findings may not apply to manifolds of other compositions. Further studies are aimed at exploring the risks that biofilm may pose to laboratory rodents.
In summary, our data support the findings of others that mouse oral flora varies between strains and vendors. Mice are unlikely contributors to the aerobic biofilm bacteria that develops in automated watering systems, and biofilm bacteria most likely are derived from the source water system and from supply lines that cannot be sanitized routinely. Investigation into the anaerobic bacterial component of the automated watering manifold biofilm still needs to be performed. ATP bioluminescence proved to be a rapid means of assessing bacterial levels in automated watering systems. Additional studies to determine the efficacy and cost efficiency of sanitization and water treatment strategies are needed to better determine best practices for provision of drinking water and cleaning of rack manifolds; studies of this type are underway in our laboratory.
Acknowledgments
Aspects of this clinical research project were presented at the American Association for Laboratory Animal Science (AALAS) conferences in Seattle, Washington, in October 2003; Tampa Bay, Florida, in November 2004; St Louis, Missouri, in October 2005; and Salt Lake City, Utah, in October 2006. The authors wish to thank Anna Colvig and Kay-Ann Schuck for microbiologic speciation and Whitney Engler for library research assistance. This work was supported by training grant T32-RR07008 (JMC and TRM) from the National Institutes of Health.
References
- 1.Bauman RW. 2007. Microbiology: with diseases by taxonomy. San Francisco: Pearson Benjamin Cummings [Google Scholar]
- 2.City of Ann Arbor. [Internet]. Water treatment. Ann Arbor (MI): City of Ann Arbor; [cited 2007 Sep 9]. Available from: http://www.ci.ann-arbor.mi.us/PublicServices/Water/WTP/int-treat.html.
- 3.City of Ann Arbor 2001. Annual report on drinking water. Ann Arbor (MI): City of Ann Arbor [Google Scholar]
- 4.City of Ann Arbor 2005. Annual report on drinking water. Ann Arbor (MI): City of Ann Arbor [Google Scholar]
- 5.Collentro WV. 1995. Microbial control in purified water systems—case histories. Ultrapure Water 12:30–38 [Google Scholar]
- 6.Costerton JW, Lewandowski Z, Caldwell DE, Korber DR, Lappin-Scott HM. 1995. Microbial biofilms. Annu Rev Microbiol 49:711–745 [DOI] [PubMed] [Google Scholar]
- 7.Deininger RA, Lee JY. 2001. Rapid determination of bacteria in drinking water using an ATP assay. Field Anal Chem Technol 5:185–189 [Google Scholar]
- 8.Delahaye E, Welte B, Levi Y, Leblon G, Montiel A. 2003. An ATP-based method for monitoring the microbiological drinking water quality in a distribution network. Water Res 37:3689–3696 [DOI] [PubMed] [Google Scholar]
- 9.Eaton AD, Franson MAHAmerican Public Health Association, American Water Works Association, Water Environment Federation 2005. Standard methods for the examination of water and wastewater. Washington (DC): American Public Health Association [Google Scholar]
- 10.Fiksdal L, Vik EA, Mills A, Staley T. 1982. Nonstandard methods for enumerating bacteria in drinking water. J Am Water Works Assoc 74:313–318 [Google Scholar]
- 11.Gadbois T, Marcotte H, Rodrigue L, Coulombe C, Goyette N, Lavoie MC. 1993. Distribution of the resident oral bacterial populations in different strains of mice. Microb Ecol Health Dis 6:245–251 [Google Scholar]
- 12.Gilbert P, Brown MRW. 1995. Mechanisms of the protection of bacterial biofilms from antimicrobial agents. In: Lappin-Scott HM, Costerton JW.Microbial biofilms Cambridge: Cambridge University Press [Google Scholar]
- 13.Environmental Protection Agency 2006. National primary drinking water regulations. 40 CFR 141 [Google Scholar]
- 14.Haist CJ, Cadillac JM, Dysko RC. 2004. Assessment of bacterial contamination of drinking water provided to mice. Contemp Top Lab Anim Sci 43:8–13 [PubMed] [Google Scholar]
- 15.Kristinsson KG. 1989. Adherence of staphylococci to intravascular catheters. J Med Microbiol 28:249–257 [DOI] [PubMed] [Google Scholar]
- 16.LeChevallier MW, Cawthon CD, Lee RG. 1988. Inactivation of biofilm bacteria. Appl Environ Microbiol 54:2492–2499 [DOI] [PMC free article] [PubMed] [Google Scholar]
- 17.Lee J, Deininger RA. 2004. A rapid screening method for the detection of viable spores in powder using bioluminescence. Luminescence 19:209–211 [DOI] [PubMed] [Google Scholar]
- 18.Lee J, Deininger RA. 2004. Detection of E. coli in beach water within 1 hour using immunomagnetic separation and ATP bioluminescence. Luminescence 19:31–36 [DOI] [PubMed] [Google Scholar]
- 19.Lee J, Deininger RA, Fleece RM. 2001. Rapid determination of bacteria in pools. J Environ Health 64:9–14 [PubMed] [Google Scholar]
- 20.Means EG, Hanami L, Ridgway HF, Olson BH. 1981. Evaluating mediums and plating techniques for enumerating bacteria in water distribution systems. J Am Water Works Assoc 73:585–590 [Google Scholar]
- 21.Min J, Lee J, Deininger RA. 2006. Simple and rapid method for detection of bacterial spores in powder useful for first responders. J Environ Health 68:34–37, 44, 46 [PubMed] [Google Scholar]
- 22.Mittelman MW. 1986. Biological fouling of purified-water systems: part 3, treatment. Microcontamination 4:30–40, 70 [Google Scholar]
- 23.Mittelman MW. 1995. Biofilm development in purified water systems. In: Lappin-Scott HM, Costerton JW, editors. Microbial biofilms Cambridge: Cambridge University Press [Google Scholar]
- 24.Momba MNB, Kfir R, Venter SN, Cloete TE. 2000. An overview of biofilm formation in distribution systems and its impact on the deterioration of water quality. Water SA 26:59–66 [Google Scholar]
- 25.National Research Council 1996. Guide for the care and use of laboratory animals. Washington (DC): National Academy Press [Google Scholar]
- 26.Pang CM, Hong P, Guo H, Liu WT. 2005. Biofilm formation characteristics of bacterial isolates retrieved from a reverse-osmosis membrane. Environ Sci Technol 39:7541–7550 [DOI] [PubMed] [Google Scholar]
- 27.Pedersen K. 1990. Biofilm development on stainless steel and PVC surfaces in drinking water. Water Res 24:239–243 [Google Scholar]
- 28.Reasoner DJ, Geldreich EE. 1985. A new medium for the enumeration and subculture of bacteria from potable water. Appl Environ Microbiol 49:1–7 [DOI] [PMC free article] [PubMed] [Google Scholar]
- 29.Rodrigue L, Barras MJ, Marcotte H, Lavoie MC. 1993. Bacterial colonization of the oral cavity of the BALB/c mouse. Microb Ecol 26:267–275 [DOI] [PubMed] [Google Scholar]
- 30.Rodrigue L, Lavoie MC. 1996. Comparison of the proportions of oral bacterial species in BALB/c mice from different suppliers. Lab Anim 30:108–113 [DOI] [PubMed] [Google Scholar]
- 31.Sanford L. 2007. Personal communication: Ann Arbor Water Treatment Services.
- 32.Trudel L, St-Amand L, Bareil M, Cardinal P, Lavoie MC. 1986. Bacteriology of the oral cavity of BALB/c mice. Can J Microbiol 32:673–678 [DOI] [PubMed] [Google Scholar]
- 33.Ukuku DO, Pilizota V, Sapers GM. 2001. Bioluminescence ATP assay for estimating total plate counts of surface microflora of whole cantaloupe and determining efficacy of washing treatments. J Food Prot 64:813–819 [DOI] [PubMed] [Google Scholar]
- 34.van der Kooij D, Veenendaal HR, Baars-Lorist C, van der Klift DW, Drost YC. 1995. Biofilm formation on surfaces of glass and Teflon exposed to treated water. Water Res 29:1655–1662 [Google Scholar]
- 35.Wolff LF, Krupp MJ, Liljemark WF. 1985. Microbial changes associated with advancing periodontitis in STR/N mice. J Periodontal Res 20:378–385 [DOI] [PubMed] [Google Scholar]
- 36.Zacheus OM, Iivanainen EK, Nissinen TK, Lehtola MJ, Martikainen PJ. 2000. Bacterial biofilm formation on polyvinyl chloride, polyethylene and stainless steel exposed to ozonated water. Water Res 34:63–70 [Google Scholar]