Abstract
Because microsatellite markers have a high degree of genetic variability, they are an effective tool for genetic monitoring. We have developed a genotyping panel containing 87 microsatellite markers that are polymorphic among commonly used inbred rat strains, including ACI, Fischer 344, Lewis, Brown Norway, Wistar–Furth, and Wistar–Kyoto. The markers are located at approximately 15- to 20-cM intervals along each of the 20 autosomes. By using fluorescently labeled primers and multiplex PCR analysis, the entire genome can be assayed with only 8 reactions. The resulting amplicons from these reactions can be distinguished from one another by both their size and the fluorescent dye associated with them. Amplicons are analyzed and allele sizes are determined by using automated capillary-based instrumentation. These multiplex panels provide a cost-effective and rapid method for genetic monitoring for applications ranging from assessing genetic contamination in a rat colony to moving mutations from one genetic background to another by using a speed congenic approach.
Abbreviations: SNP, single-nucleotide polymorphism; SSLP, simple sequence length polymorphism
The laboratory rat (Rattus norvegicus) is a widely used model organism for the study of all aspects of human disease.7 To facilitate its utility as an animal model, a number of inbred, congenic, consomic, and recombinant inbred strains have been developed over the years, and many of these strains are used heavily for biomedical, behavioral, and pharmaceutical research.7,21 With the completion of the rat genome sequence,6 genetic studies are now more feasible, and the rat has become a valuable model organism for comparative genomics.
As part of good colony management, it is essential to perform regular genetic monitoring to detect genetic contamination due to breeding errors and to assess genetic drift in a rat colony. Regular monitoring establishes a unique genetic profile for each strain or colony and efficiently identifies deviations from this profile, which can alter experimental outcomes. In the past, this monitoring often was accomplished by using biochemical or immunologic markers and assays.1,10 These assays are time-consuming, and some necessitate euthanizing the animal in order to collect appropriate samples.
Simple sequence length polymorphisms (SSLPs), also called microsatellites, are DNA regions containing di-, tri-, or tetra-nucleotide repeats that are found randomly yet abundantly throughout the genome.16,22 The number of these repeats is highly polymorphic among different strains of rats, allowing the microsatellites to serve as genetic markers that can distinguish among DNA derived from different strains.15,18 In addition, microsatellites can be assayed quickly and efficiently by PCR-based approaches, thereby making these markers a highly effective tool for genetic monitoring. Currently, close to 5000 SSLP markers have been identified and characterized for 48 rat strains.2,12
Previously, techniques for microsatellite marker analysis often relied on cumbersome labeling of the microsatellite PCR primers with radioisotopes or dyes and on separation by electrophoresis on agarose or polyacrylamide gels.17 The advent of capillary-based instrumentation for analysis has allowed automation of the separation process and enables detection of alleles that differ by as little as 1 to 2 basepairs. Here we describe a method for further increasing the speed and decreasing the cost of microsatellite marker analysis by multiplexing primer sets such that a minimal number of PCR reactions are sufficient for assaying the entire rat genome and efficiently detecting genetic changes in rat colonies.
Materials and Methods
DNA sources.
Rats of the strains ACI/N, Brown Norway (BN/RijHsd), Wistar Kyoto (WKY/NHsd), Wistar Furth (WF/NHsd), Lewis (LEW/SsNHsd), and Fischer 344 (F344/NHsd) were purchased from Harlan (Indianapolis, IN). Upon arrival, animals were euthanized by inhalation of carbon dioxide followed by cervical dislocation, and tail biopsies were performed. Approximately 2 mm of each tail was used as a source of tissue for genomic DNA extraction (DNeasy Tissue Kit, Qiagen, Valencia, CA). All animal use and procedures were approved by the University of Missouri's Animal Care and Use Committee.
Genotyping protocol.
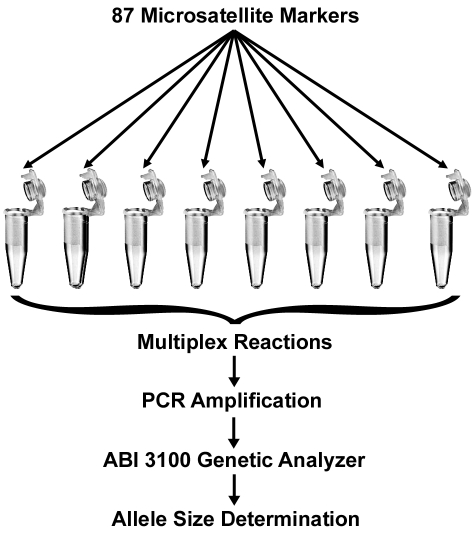
Microsatellite primer sets were identified using the SSLP Query tool on the Rat Genome Database Web Site (Medical College of Wisconsin, Milwaukee, WI) at http://rgd.mcw.edu. Primers were synthesized commercially, with the 5′ end of the forward primer of each set labeled with one of the following fluorescent dyes: 6FAM, VIC, NED, and PET (Applied Biosystems, Foster City, CA). Each PCR reaction contained 30 ng of rat genomic DNA, 5 μl 10 ;× GeneAmp Taq buffer with 50 mM MgCl2 (Applied Biosystems), 0.2 mM of each dNTP (Roche, Indianapolis, IN), 1.25 U of FastStart Taq (Roche), and 0.2 to 0.8 μM of each primer and was brought to a total reaction volume of 50 μl with sterile deionized water. The entire genome (excluding the sex chromosomes) was assayed by using a total of 87 primer sets, although more than 100 different microsatellites were tested originally. The exact primer concentration used was determined empirically based on its performance in the multiplex reaction, with the goal of achieving even peak heights for all microsatellite loci within a panel. PCR amplification was performed in a GeneAmp PCR System (Applied Biosystems) with the following conditions: 1 cycle at 95 °C for 4 min; 35 cycles of 94 °C for 15 s, 55 °C for 2 min, and 72 °C for 2 min; and 1 cycle at 72 °C for 7 min. After PCR amplification, 0.5 μl of the PCR reaction was mixed with 0.5 μl GeneScan 500 LIZ Size S Standard (Applied Biosystems) and 9 μl deionized formamide (Applied Biosystems). These samples were transferred to 96-well plates, centrifuged for 2 min at 228 × g (Allegra 6R Centrifuge, Beckman Coulter, Fullerton, CA), denatured at 95 °C for 5 min in a thermal cycler, and quick-chilled on ice until loaded. Analysis of the samples was performed by capillary electrophoresis (ABI Prism 3100 Genetic Analyzer, Applied Biosystems) using POP4 polymer (Applied Biosystems). Data were visualized and allele sizes were scored by using GeneMapper software (version 4.0, Applied Biosystems). Results were exported to a spreadsheet (Excel, Microsoft, Redmond, WA) for further analysis and comparison. All genotyping analysis was performed by the Research Animal Diagnostic Laboratory Genetic Testing Service (Columbia, MO). The basic strategy for analysis is outlined in Figure 1.
Figure 1.
Overview of analysis process. Primer sets for the microsatellite markers are multiplexed into 8 PCR reactions. The products from the PCR reactions are mixed with a size standard and separated by capillary electrophoresis using an ABI 3100 Prism Genetic Analyzer. Specialized software is used to determine the allele sizes for each microsatellite marker.
Results
Development of multiplex marker panels.
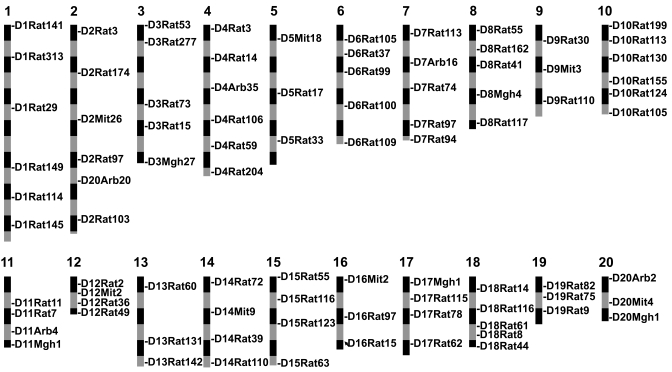
Initially, markers were selected from the publicly available database of microsatellite markers at the Rat Genome Database such that the markers were located at approximately 15- to 20-cM intervals and were highly polymorphic among the ACI/N, F344/NHsd, LEW/SsNHsd, BN/RijHsd, WF/NHsd, and WKY/NHsd rat strains. On average, the markers in our panel are separated by 19 cM. Because centimorgan distances are somewhat arbitrary and are dependent on the strain combination used for mapping, the physical chromosome location of each marker was determinedbased on the Rat Genome Sequence Data (RGSC 3.4) available at Ensembl4 to ensure that we had sufficient coverage of each chromosome at regular intervals (Figure 2). This procedure resulted in markers that were separated, on average, by 30 Mb along the length of each chromosome.
Figure 2.
Distribution of microsatellite markers across the genome. The chromosomes are drawn to scale based on the data from the current rat genome sequence (RGSC 3.4). The physical position of each marker on the 20 rat autosomes is shown. Each segment (black or gray boxes) represents 20 Mb. The average distance between adjacent markers on each chromosome is 30 Mb (19 cM).
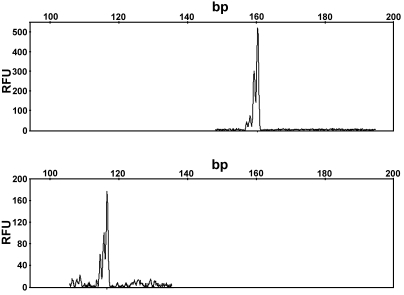
Next, the markers were combined in groups of 11 to 13 based on their allele sizes, such that there was no overlap in size between possible amplification products containing the same dye. For example, the forward primers of 2 different markers, D2Rat3 and D3Rat53, were labeled with 6FAM, combined in a single PCR reaction, and tested to determine whether the alleles could be distinguished by capillary electrophoresis. As seen in Figure 3, the D2Rat3 alleles and D3Rat53 alleles can be distinguished easily because of the nonoverlapping differences in the sizes of each allele. By carefully determining the range of allele sizes for all 6 rat strains for each marker, we created groups of primers to test together in single PCR reactions. In addition, we multiplexed primer sets that had similar allele sizes but were labeled with different dyes. Empirical testing of primer sets to avoid fluorescent signals of 6000 relative fluorescent units or greater and careful attention to the quality control values reported by the GeneMapper software (Applied Biosystems) allowed optimization of each multiplex PCR reaction.
Figure 3.
Representative data output for analysis of LEW/SsNHsd DNA with markers D2Rat3 and D3Rat53. The 2 markers were amplified in a single PCR reaction and separated by capillary electrophoresis. The upper panel depicts the alleles for D3Rat53, and the lower panel depicts the alleles for D2Rat3. The alleles are represented by the peaks. The sizes in basepairs (bp) are indicated on the top x axis, such that smaller alleles appear to the left, and larger alleles appear to the right. The values on the y axis indicate fluorescent signal intensity given in relative fluorescent units (RFU) and vary for each sample. In this example, both primer sets were labeled with the same fluorescent dye (6FAM), but amplicons are readily distinguished due to the differences in the allele sizes: 162 bp for D3Rat53 and 121 bp for D2Rat3. As expected, this inbred strain is homozygous for the alleles depicted.
Characteristics of the marker panels.
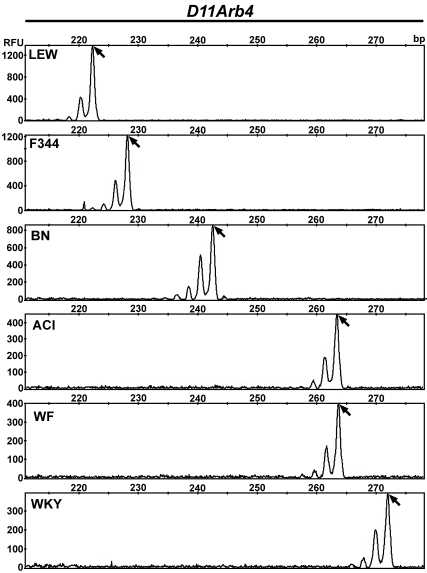
The final marker set consisted of 87 microsatellite markers multiplexed in 8 PCR reactions. Markers are positioned on each chromosome with an average spacing of 19 cM or 30 Mb. The markers are highly polymorphic among the strains we tested such that the majority of markers are informative, meaning that a marker can be used to distinguish between any 2 strains (Table 1, Figure 4). There are 7 markers with 2 different alleles, 19 markers with 3 different alleles, 27 markers with 4 different alleles, 24 markers with 5 different alleles, and 10 markers with 6 different alleles among the strains tested.
Table 1.
Number of polymorphic markers between strains
| ACI/N | BN/RijHsd | F344/NHsd | LEW/SsNHsd | WF/NHsd | WKY/NHsd | |
| ACI/N | 0 | 77 | 66 | 72 | 67 | 69 |
| BN/RijHsd | 0 | 78 | 71 | 75 | 83 | |
| F344/NHsd | 0 | 83 | 71 | 77 | ||
| LEW/SsNHsd | 0 | 56 | 76 | |||
| WF/NHsd | 0 | 71 | ||||
| WKY/NHsd | 0 |
Figure 4.
Representative data output for rat marker D11Arb4. Each row represents the results for a single DNA sample: LEW/SsNHsd (LEW), F344/NHsd (F344), BN/RijHsd (BN), ACI/N (ACI), WF/NHsd (WF), or WKY/NHsd (WKY). The alleles are represented by the peaks. Many markers have a characteristic ‘stutter’ pattern (multiple peaks), as seen here. The arrow indicates the actual allele peak. The sizes in basepairs (bp) are indicated on the top x axis, such that smaller alleles appear to the left and larger alleles appear to the right. The values on the y axis indicate fluorescent signal intensity given in relative fluorescent units (RFU) and vary for each sample. In this example, there are 5 different allele sizes, with ACI/N and WF/NHsd sharing similarly sized alleles (monomorphic).
Applications.
We have used our marker set for several different applications, including establishing a baseline genetic profile for a colony of outbred rats, routine genetic monitoring to detect genetic contamination, and establishment of an congenic rat line by using a speed congenic approach. For example, we have used a subset of 40 markers from our 87-marker panel for detection of genetic contamination. The markers for genetic contamination detection were multiplexed in 7 PCR reactions containing 4 to 9 markers per reaction. The markers were chosen so that there are 2 evenly-spaced markers per each of the 20 rat autosomes providing sufficient genome-wide coverage to detect genetic contamination. In addition, we have used a speed congenic approach to transfer an enhanced green fluorescent protein transgene from rat line RRRC 62, which is currently on a Lewis (LEW/Crl) genetic background, to the Fischer (F344/NCrl) genetic background (RRRC 307). Our microsatellite panel was used to analyze the genotypes of 10 N2 males at 76 markers that are polymorphic between the LEW/Crl and F344/NCrl strains. By comparing the numbers of markers that were still heterozygous versus homozygous for F344 alleles, we obtained an estimate of the percentage of the alleles that were homozygous F344 (range, 37% to 63%; Table 2). By choosing those animals with the highest percentage of F344-homozygous alleles to serve as breeders to generate the N3 generation, the process of creating a F344/NCrl congenic line was accelerated compared with random selection of breeders for backcrossing.
Table 2.
Genotypes of N2 males for strain RRRC 307
| Animal | No. of heterozygous markersa | No. of homozygous markersb | % of markers that are homozygous for F344/NCrl alleles |
| 1 | 32 | 44 | 58 |
| 2 | 30 | 46 | 61 |
| 3 | 37 | 39 | 51 |
| 4 | 42 | 34 | 48 |
| 5 | 28 | 48 | 63 |
| 6 | 48 | 28 | 37 |
| 7 | 40 | 36 | 47 |
| 8 | 34 | 42 | 55 |
| 9 | 32 | 44 | 58 |
| 10 | 46 | 30 | 40 |
Genotype = 1 LEW/Crl allele and 1 F344/NCrl allele
Genotype = 2 F344/NCrl alleles
Discussion
Our goal was to generate a set of microsatellite markers in rats that could be used cost-effectively to survey the entire genome and distinguish among commonly used rat strains. Although microsatellite analysis can be performed by first setting up single PCR reactions for each marker and then pooling these reactions prior to loading on capillary-based instrumentation, this methodology is time-consuming and reagent-intensive. Instead, our strategy was to combine multiple primer sets in the initial PCR reactions, thereby minimizing both the number of reactions and the amounts of reagents used. In this study, we found that as many as 13 markers could be amplified reliably in a single PCR reaction. In addition, we determined that primer sets could be combined prior to use in PCR reactions and stored for as long as 3 mo at –20 °C without loss of integrity of the primers, as measured by absence of deterioration of the fluorescent signal (data not shown).
Single-nucleotide polymorphisms (SNPs), another type of genetic marker, have been identified in the mouse23,25 and only just recently have been reported for the rat.9 SNPs are single-basepair changes that occur abundantly throughout the genome, although they may not be distributed entirely randomly in the mouse.23,25 SNPs are usually biallelic, meaning that only 2 alleles exist for the marker; therefore SNPs typically are less informative than are microsatellites, which commonly occur as multiple alleles among different strains. In short, more SNPs are needed to obtain the same genetic information that can be derived from microsatellites. Therefore, a key advantage of using microsatellites for genetic monitoring is the ability to readily detect genetic changes with a relatively small number of markers. In addition, when these changes are due to genetic contamination, it is often possible to identify the strain that is the source of the contamination. This is often much more difficult to accomplish by using SNPs. Although SNP panels have been described for genetic monitoring in the mouse,19 to our knowledge equivalent SNP panels for the rat have not been described.
The importance of genetic monitoring of rodent colonies is well-established, and our study describes a new tool for performing DNA-based testing to detect genetic impurity. We have identified a subset of 40 markers (representing 2 markers per autosome) that can be used to effectively and efficiently detect genetic contamination among the 6 common inbred rat strains surveyed in this study.
In addition, our 87 marker panel provides a cost-effective method to move genetic mutations or entire genomic regions from one genetic background to another. Typically, congenic strains are produced by repeated backcrosses to an inbred strain, with selection for a particular marker from the donor strain.5 After a minimum of 10 backcross generations, a strain is considered to be congenic.5 Marker-assisted selection breeding, also known as ‘speed congenics,’ accelerates the production of congenic strains such that a congenic strain can be produced in as few as 5 backcross generations.14,24 Use of marker-assisted selection in rats has a number of advantages. To move a specific mutation onto a different genetic background while preserving the integration site, a speed congenic approach is advisable. Likewise, a number of groups studying quantitative traits in the rat have generated congenic lines to study selected chromosomal regions on different genetic backgrounds.3,11,13,20 In mice, 3 markers per chromosome is sufficient for selection of the highest rate of recipient genome in speed congenic applications.8 Our 87-marker panel has sufficient genomic coverage and sufficient polymorphism among commonly used rat strains to be used for these types of speed congenic approaches. As illustrated by the data from the RRRC 307 line (Table 2), in the early backcross generations, there is a great range among animals in terms of the number of markers that are homozygous for recipient strain alleles. By using this range of variation as an estimate of how much of the genome is becoming ‘fixed’ for the recipient strain, the animals with the greatest percentage of recipient alleles can be selected as breeders for the next generation. This process greatly accelerates the generation of a congenic line when compared with random selection of breeders for backcrossing.
In summary, we have shown that combining multiple rat microsatellite markers in the initial PCR reaction followed by capillary-based electrophoresis is a rapid, cost-effective means to survey the rat genome for both the routine detection of genetic contamination in a rat colony as well as for genome-wide analysis for production of speed congenics, gene mapping (linkage analysis), and background strain characterization.
Acknowledgments
This study was funded by Rat Resource and Research Center grant P40 RR16939 from the National Institutes of Health. We acknowledge the technical assistance provided by Kristen Correll, James Sparks, and Heath Berg. We thank Beth Bauer for critical reading of the manuscript and Howard Wilson for assistance with the figure graphics.
References
- 1.Bender K, Adams M, Baverstock PR, den Bieman M, Bissbort S, Brdicka R, Butcher GW, Cramer DV, von Deimling O, Festing MF, et al. 1984. Biochemical markers in inbred strains of the rat (Rattus norvegicus). Immunogenetics 19:257–266 [DOI] [PubMed] [Google Scholar]
- 2.de la Cruz N, Bromberg S, Pasko D, Shimoyama M, Twigger S, Chen J, Chen CF, Fan C, Foote C, Gopinath GR, et al. 2005. The Rat Genome Database (RGD): developments towards a phenome database. Nucleic Acids Res 33:D485–D491 [DOI] [PMC free article] [PubMed] [Google Scholar]
- 3.Deng AY, Dutil J, Sivo Z. 2001. Utilization of marker-assisted congenics to map two blood pressure quantitative trait loci in Dahl rats. Mamm Genome 12:612–616 [DOI] [PubMed] [Google Scholar]
- 4. Ensembl [Internet]. Cambridge (UK): The European Bioinformatics Institute; c1999–2008. Available from: http://www.ensembl.org.
- 5.Flaherty L. 1981. Congenic strains. In: Foster H, Small J, Fox J.The mouse in biomedical research, vol. 1. New York: Academic Press; p 215–222 [Google Scholar]
- 6.Gibbs RA, Weinstock GM, Metzker ML, Muzny DM, Sodergren EJ, Scherer S, Scott G, Steffen D, Worley KC, Burch PE, et al. 2004. Genome sequence of the Brown Norway rat yields insights into mammalian evolution. Nature 428:493–521 [DOI] [PubMed] [Google Scholar]
- 7.Gill TJ, 3rd, Smith GJ, Wissler RW, Kunz HW. 1989. The rat as an experimental animal. Science 245:269–276 [DOI] [PubMed] [Google Scholar]
- 8.Goto K, Ebukuro M, Itoh T. 2005. Microsatellite-directed selection of breeders for the next backcross generation by using a minimal number of loci. Comp Med 55:34–36 [PubMed] [Google Scholar]
- 9.Guryev V, Berezikov E, Malik R, Plasterk RH, Cuppen E. 2004. Single nucleotide polymorphisms associated with rat expressed sequences. Genome Res 14:1438–1443 [DOI] [PMC free article] [PubMed] [Google Scholar]
- 10.Hedrich H. 1990. Genetic monitoring of inbred strains of rats. Stuttgart: Gustav Fisher Verlag [Google Scholar]
- 11.Hoopes RR, Jr, Reid R, Sen S, Szpirer C, Dixon P, Pannett AA, Thakker RV, Bushinsky DA, Scheinman SJ. 2003. Quantitative trait loci for hypercalciuria in a rat model of kidney stone disease. J Am Soc Nephrol 14:1844–1850 [DOI] [PubMed] [Google Scholar]
- 12.Klöting I, Voigt B, Kovacs P. 1997. Comparison of genetic variability at microsatellite loci in wild rats and inbred rat strains (Rattus norvegicus). Mamm Genome 8:589–591 [DOI] [PubMed] [Google Scholar]
- 13.Laragione T, Yarlett NC, Brenner M, Mello A, Sherry B, Miller EJ, Metz CN, Gulko PS. 2007. The arthritis severity quantitative trait loci Cia4 and Cia6 regulate neutrophil migration into inflammatory sites and levels of TNFαand nitric oxide. J Immunol 178:2344–2351 [DOI] [PubMed] [Google Scholar]
- 14.Markel P, Shu P, Ebeling C, Carlson GA, Nagle DL, Smutko JS, Moore KJ. 1997. Theoretical and empirical issues for marker-assisted breeding of congenic mouse strains. Nat Genet 17:280–284 [DOI] [PubMed] [Google Scholar]
- 15.Mashimo T, Voigt B, Tsurumi T, Naoi K, Nakanishi S, Yamasaki K, Kuramoto T, Serikawa T. 2006. A set of highly informative rat simple sequence length polymorphism (SSLP) markers and genetically defined rat strains. BMC Genet 7:19. [DOI] [PMC free article] [PubMed] [Google Scholar]
- 16.Miesfeld R, Krystal M, Arnheim N. 1981. A member of a new repeated sequence family which is conserved throughout eucaryotic evolution is found between the human δ and β globin genes. Nucleic Acids Res 9:5931–5947 [DOI] [PMC free article] [PubMed] [Google Scholar]
- 17.Moreno C, Kennedy K, Andrae J, Jacob H. 2004. Genome-wide scanning with SSLPs in the rat. In: Fennell J, Baker A.Hypertension: methods and protocols, vol. 108. Totowa (NJ): Humana Press; p 131–138 [DOI] [PubMed] [Google Scholar]
- 18.Otsen M, Den Bieman M, Winer ES, Jacob HJ, Szpirer J, Szpirer C, Bender K, Van Zutphen LF. 1995. Use of simple sequence length polymorphisms for genetic characterization of rat inbred strains. Mamm Genome 6:595–601 [DOI] [PubMed] [Google Scholar]
- 19.Petkov PM, Cassell MA, Sargent EE, Donnelly CJ, Robinson P, Crew V, Asquith S, Haar RV, Wiles MV. 2004. Development of a SNP genotyping panel for genetic monitoring of the laboratory mouse. Genomics 83:902–911 [DOI] [PubMed] [Google Scholar]
- 20.Provoost AP, Shiozawa M, Van Dokkum RP, Jacob HJ. 2002. Transfer of the Rf-1 region from FHH onto the ACI background increases susceptibility to renal impairment. Physiol Genomics 8:123–129 [DOI] [PubMed] [Google Scholar]
- 21.Smits BM, Cuppen E. 2006. Rat genetics: the next episode. Trends Genet 22:232–240 [DOI] [PubMed] [Google Scholar]
- 22.Stallings RL, Ford AF, Nelson D, Torney DC, Hildebrand CE, Moyzis RK. 1991. Evolution and distribution of (GT)n repetitive sequences in mammalian genomes. Genomics 10:807–815 [DOI] [PubMed] [Google Scholar]
- 23.Wade CM, Kulbokas EJ, 3rd, Kirby AW, Zody MC, Mullikin JC, Lander ES, Lindblad-Toh K, Daly MJ. 2002. The mosaic structure of variation in the laboratory mouse genome. Nature 420:574–578 [DOI] [PubMed] [Google Scholar]
- 24.Wakeland E, Morel L, Achey K, Yui M, Longmate J. 1997. Speed congenics: a classic technique in the fast lane (relatively speaking). Immunol Today 18:472–477 [DOI] [PubMed] [Google Scholar]
- 25.Wiltshire T, Pletcher MT, Batalov S, Barnes SW, Tarantino LM, Cooke MP, Wu H, Smylie K, Santrosyan A, Copeland NG, Jenkins NA, Kalush F, Mural RJ, Glynne RJ, Kay SA, Adams MD, Fletcher CF. 2003. Genome-wide single-nucleotide polymorphism analysis defines haplotype patterns in mouse. Proc Natl Acad Sci USA 100:3380–3385 [DOI] [PMC free article] [PubMed] [Google Scholar]


