Abstract

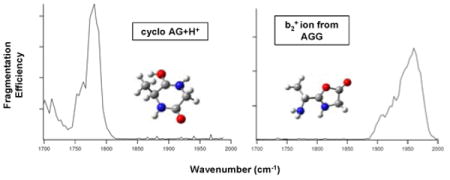
Infrared multiple photon dissociation (IRMPD) spectroscopy combined with theoretical vibrational spectra provides a powerful tool for probing structure. This technique has been used to probe the structure of protonated cyclic AG and the b2+ ion from AGG. The experimental spectrum for protonated cyclo AG compares very well with the theoretical spectra for a diketopiperazine. The structure is most likely a combination of protonation at the alanine and glycine amide oxygens. The experimental spectrum for the b2+ ion from protonated AGG matches best to the theoretical spectrum for an oxazolone structure protonated on the ring nitrogen. In particular, the carbonyl stretching band at 1970 cm-1 is blue-shifted by about 200 cm-1 compared to the experimental spectrum for protonated cAG, indicating that these two structures are distinct. This is the first time that a direct IR spectrum of a b2+ ion has been obtained and, for this ion, the oxazolone structure proposed based on prior calculations and experiments is confirmed by a spectroscopic method.
The determination of structural features at the molecular level can provide fundamental insights into the activity, behavior, and function of biological systems. While techniques such as NMR and X-ray crystallography have stood as benchmarks for determining biological structure, mass spectrometry is playing an increasing role in investigating structural features.1,2 With the advent of soft ionization techniques such as MALDI and ESI, biological systems from small molecules to peptides to macromolecular protein complexes can be examined using a range of mass spectrometric techniques.3 Because analysis occurs in a solvent-free environment, mass spectrometry also introduces the opportunity to examine intrinsic features and interactions that may not be present in an aqueous solvent system.4
Structures of amino acids, peptides, and peptide fragments have also been a focus of mass spectrometry research.5 In particular, the formation of b2+ ions and their structure has prompted numerous studies. Two main structures have been proposed. If cyclization occurs by attack of the N-terminal amino group on the carbonyl carbon of the second amino acid residue, then a diketopiperazine structure is formed.6 If the carbonyl oxygen of the first amino acid of a peptide attacks the carbonyl carbon of the second amino acid, an oxazolone structure is formed.5 Peptide or fragment ion structures can be probed using tandem MS/MS, isotope labeling, gas-phase hydrogen/deuterium exchange, ion mobility, and computational modeling. While many recent studies have shown that the b2+ ion of simple peptides is an oxazolone, the studies were performed using indirect methods.7,8 Studies have also shown that some b2+ ions do not form oxazolone or diketopiperazine structures; for example, the involvement of side chains may lead to other structures.7
Infrared multiple photon dissociation (IRMPD) combined with theoretical vibrational spectra can provide spectroscopic evidence for probing the structure of ions. Recently, IRMPD spectroscopy has been used to investigate the structure and site of protonation in amino acids and peptides,9 to probe alkali-metal complexes of amino acids and peptides,10 and to investigate the structure of the b4+ ion from leu-enkephalin9c and c-type ions formed by electron capture dissociation.11 In the present work, we compare spectroscopy of the b2+ ion from protonated AGG by CID in the hexapole collision cell with protonated cyclic AG (cAG), which has a known diketopiperazine structure as a neutral.
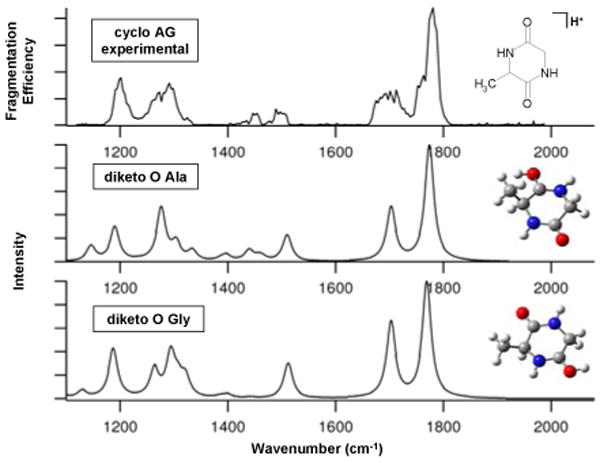
IRMPD spectroscopy experiments were performed using the CLIO Free Electron Laser (FEL) in Orsay, France, coupled to an electrospray ionization-Fourier transform ion cyclotron resonance mass spectrometer (7.0 T Bruker Apex Qe).12 Figure 1 shows the IRMPD spectrum for protonated cAG. The major fragment produced by IRMPD appears at m/z 101 and corresponds to the loss of CO. Fragments also appears at m/z 84 (101-NH3) and m/z 73 (101-CO). The spectra obtained for each fragment were similar, but due to the lower signal-to-noise ratio for low abundances, only the most abundant fragment ion was plotted.
Figure 1.

IRMPD spectrum of protonated cAG plotted as fragmentation efficiency for formation of the most abundant fragment ion vs. wavenumber and calculated spectra of two stable diketopiperazine isomers.
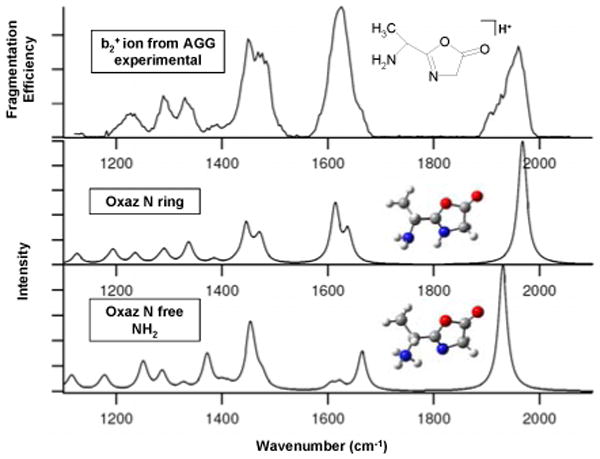
The IRMPD experimental results were compared with quantum chemical calculations to determine the structures that produce the best IR spectral match with the experimental spectrum. Both geometry optimizations and frequency calculations were performed at the B3LYP/6-311++G(d,p) level for different b2+ oxazolone and diketopiperazine structures with protonation at oxygen or nitrogen atoms.13 The acylium structure was excluded due to its higher energy compared to the two cyclic structures. Theoretical IR frequencies were scaled with a factor of 0.978 and were convoluted with a Lorentzian profile with a 20 cm-1 full width at half maximum. The most pertinent spectra and geometries are compared with the experimental spectra in Figures 1 and 2, and the energies are summarized in Table 1 (see Supporting Information for other spectra and geometries).
Figure 2.

IRMPD spectrum of the b2+ ion produced by fragmentation of AGG plotted as fragmentation efficiency for formation of the most abundant fragment ion vs. wavenumber and calculated spectra of two oxazolone isomers.
Table 1.
Relative calculated enthalpy and free energy changes for the different structures of the AG b2+ ion.
| B3LYP/6-311++G(d,p) | ||
|---|---|---|
| ΔΔH298.15 (kJ/mol) | ΔΔG298.15 (kJ/mol) | |
| diketo O Gly | 0.0 | 0.0 |
| diketo O Ala | 2.2 | 3.1 |
| oxaz N ring (Gly) | 16.8 | 16.7 |
| oxaz N free NH2 (Ala) | 31.4 | 31.6 |
| diketo N Ala | 56.1 | 56.9 |
| diketo N Gly | 63.1 | 63.8 |
The b2+ diketopiperazine structure protonated on the glycine amide oxygen (diketo O Gly) has the lowest energy among all the diketopiperazine and oxazolone structures. The amide oxygen protonated diketopiperazines (diketo O Gly and diketo O Ala) have lower free energies than the amide nitrogen protonated forms (diketo N Ala and diketo N Gly) by 56.9 and 63.8 kJ/mol, respectively, which suggests that the amide oxygen protonated diketopiperazines are the major isomers rather than the nitrogen protonated ones. Among the oxazolones, the oxazolone ring nitrogen protonated isomer (oxaz N ring) is 14.9 kJ/mol lower in free energy than the free amino protonated form (oxaz N free NH2). Oxygen protonated oxazolone isomers were unstable according to the computational results; therefore only nitrogen protonated oxazolone isomers will be discussed further.
Cyclic AG neutral has a diketopiperazine structure and IRMPD experiments and quantum chemical computations clearly demonstrate a diketopiperazine structure for protonated cAG. Among all the structures, the two diketopiperazine isomers protonated at amide oxygens (diketo O Ala and diketo O Gly) show the best agreement to the experimental spectrum of protonated cAG in Figure 1. The experimental band at 1775 cm-1 corresponds to unprotonated carbonyl amide stretching (amide I mode). Protonation at a carbonyl group causes the C=O to stretch simultaneously with the C-N bond, which cause a shift in the carbonyl stretching band to lower wavenumbers (1705 cm-1). The band at 1512 cm-1 is an amide II mode. The band at 1202 cm-1 is from the OH bending of the protonated carbonyl oxygen. The diketopiperazine isomer protonated on the Gly amide oxygen shows similar band patterns to that protonated on Ala amide oxygen, with a slight shift in the amide I mode, which contributes to a broad band. The 3.1 kJ/mol free energy difference and similar band patterns suggest that protonated cAG is a combination of the alanine and glycine amide oxygen protonated isomers.
The b2+ ion IR action spectrum of AGG shown in Figure 2 has a very different band pattern compared with the cAG spectrum. The carbonyl stretching bands are blue-shifted by about 200 cm-1 to 1970 cm-1 and exist as a main band with a shoulder rather than the distinct doublet of protonated cAG. The b2+ ion spectrum is in excellent agreement with quantum chemical calculations for the oxazolone protonated on the ring nitrogen (oxaz N ring). The long shoulder on the C=O stretching band indicates a minor contribution from an oxazolone protonated on the free NH2 nitrogen (oxaz N free NH2). In addition to the carbonyl stretching band, there is a strong band at 1630 cm-1 region for the b2+ ion which is absent for cAG. The band at 1630 cm-1 and its shoulder is characteristic of the scissoring mode of free NH2. This band with a long shoulder to the blue side in the experimental spectrum indicates that the feature is most likely a combination of two adjacent computed bands. The band at 1339 cm-1 is from the twisting mode of free NH2. Because the diketopiperazine structure does not have a free NH2, the 1630 cm-1 and 1339 cm-1 bands are characteristic markers for an oxazolone structure. In addition, a protonated diketopiperazine exhibits a strong OH bending feature near 1202 cm-1, but there is no OH functional group in the two nitrogen protonated oxazolones and no band at 1202 cm-1 is expected or observed in the spectrum.
In conclusion, the experimental IRMPD data and quantum chemical calculations show that protonated cAG is a diketopiperazine, and the b2+ ion from CID of protonated AGG is an oxazolone. cAG retains its cyclic form upon protonation and is most likely a mixture of isomers protonated at alanine and glycine residues. In contrast, the b2+ ion from AGG is an oxazolone with protonation at the ring nitrogen as the major isomer. This is the first time that an IR spectrum of a b2+ ion has been obtained, and for this AG b2+ ion, the oxazolone structure previously proposed based on calculations and experiments was confirmed.
Supplementary Material
Figure S1, S2, S3, additional band assignments and the complete references for 13. This material is available free of charge via the Internet at http://pubs.acs.org.
Acknowledgments
The authors would like to thank the CLIO team for their aid and expertise, P. Maitre, J. Lemaire, and C. Boisseau. This research was supported by NIH grant GMR0151387 awarded to Dr Vicki H. Wysocki and by NSF grant CAREER 0348889 awarded to Dr. John C. Poutsma. Financial support by the European Commission EPITOPES project (NEST program 15367) is gratefully acknowledged.
References
- 1.Koch MHJ, Vachette P, Svergun DI. Q Rev Biophys. 2003;36:147–227. doi: 10.1017/s0033583503003871. [DOI] [PubMed] [Google Scholar]
- 2.Braun W. Q Rev Biophys. 1987;19:115–157. doi: 10.1017/s0033583500004108. [DOI] [PubMed] [Google Scholar]
- 3.Fenn JB, Mann M, Meng CK, Wong SF, Whitehouse CM. Science. 1989;246:64–71. doi: 10.1126/science.2675315. [DOI] [PubMed] [Google Scholar]; (b) Nonami H, Tanaka K, Fukuyama Y, Erra-Balsells R. Rapid Commun Mass Spectrom. 1998;12:285–296. doi: 10.1002/(SICI)1097-0231(19980331)12:6<285::AID-RCM158>3.0.CO;2-4. [DOI] [PubMed] [Google Scholar]; (c) Hillenkamp F, Karas M, Beavis RC, Chait BT. Anal Chem. 1991;63:A1193–A1202. doi: 10.1021/ac00024a002. [DOI] [PubMed] [Google Scholar]
- 4.Locke MJ, McIver RT. J Am Chem Soc. 1983;105:4226–4232. [Google Scholar]
- 5.Yalcin T, Khouw C, Csizmadia IG, Peterson MR, Harrison AG. J Am Soc Mass Spectrom. 1995;6:1165–1174. doi: 10.1016/1044-0305(95)00569-2. [DOI] [PubMed] [Google Scholar]; (b) Nold MJ, Wesdemiotis C, Yalcin T, Harrison AG. Int J Mass Spectrom Ion Proc. 1997;164:137–153. [Google Scholar]; (c) Vaisar T, Urban J. Eur Mass Spectrom. 1998;4:359–364. [Google Scholar]; (d) Haselmann KF, Budnik BA, Zubarev RA. Rapid Commun Mass Spectrom. 2000;14:2242–2246. doi: 10.1002/1097-0231(20001215)14:23<2242::AID-RCM158>3.0.CO;2-O. [DOI] [PubMed] [Google Scholar]; (e) Paizs B, Suhai S, Hargittai B, Hruby V, Somogyi A. Int J Mass Spectrom. 2002;219:203–232. [Google Scholar]; (f) Riba-Garcia I, Giles K, Bateman RH, Gaskell SJ. J Am Soc Mass Spectrom. 2008;19:609–613. doi: 10.1016/j.jasms.2008.01.005. [DOI] [PubMed] [Google Scholar]
- 6.Cordero MM, Houser JJ, Wesdemiotis C. Anal Chem. 1993;65:1594–1601. doi: 10.1021/ac00059a019. [DOI] [PubMed] [Google Scholar]
- 7.Farrugia JM, O'Hair RAJ, Reid GE. Int J Mass Spectrom. 2001;210:71–87. [Google Scholar]
- 8.Bythell BJ, Barofsky DF, Pingitore F, Polce MJ, Wang P, Wesdemiotis C, Paizs B. J Am Soc Mass Spectrom. 2007;18:1291–1303. doi: 10.1016/j.jasms.2007.03.029. [DOI] [PubMed] [Google Scholar]; (b) Ekart K, Holthausen MC, Koch W, Spiess J. J Am Soc Mass Spectrom. 1998;9:1002–1011. [Google Scholar]; (c) Harrison AG, Csizmadia IG, Tang TH. J Am Soc Mass Spectrom. 2000;11:427–436. doi: 10.1016/S1044-0305(00)00104-5. [DOI] [PubMed] [Google Scholar]; (d) Paizs B, Suhai S. J Am Soc Mass Spectrom. 2003;14:1454–1469. doi: 10.1016/j.jasms.2003.07.001. [DOI] [PubMed] [Google Scholar]
- 9.Lucas B, Gregoire G, Lemaire J, Maitre P, Ortega J, Rupenyan A, Reimann B, Schermann JP, Desfrancois C. Phys Chem Chem Phys. 2004;6:2659–2663. [Google Scholar]; (b) Wu RH, McMahon TB. J Am Chem Soc. 2007;129:4864–4865. doi: 10.1021/ja068715a. [DOI] [PubMed] [Google Scholar]; (c) Polfer NC, Oomens J, Suhai S, Paizs B. J Am Chem Soc. 2007;129:5887–5897. doi: 10.1021/ja068014d. [DOI] [PubMed] [Google Scholar]
- 10.Armentrout PB, Rodgers MT, Oomens J, Steill JD. J Phys Chem A. 2008;112:2248–2257. doi: 10.1021/jp710885a. [DOI] [PubMed] [Google Scholar]; (b) Polfer NC, Oomens J, Moore DT, Helden G, Meijer G, Dunbar RC. J Am Chem Soc. 2006;128:517–525. doi: 10.1021/ja0549291. [DOI] [PubMed] [Google Scholar]
- 11.Frison G, Van der Rest G, Turecek F, Besson T, Lemaire J, Maitre P, Chamot-Rooke J. J Am Chem Soc. doi: 10.1021/ja805257v. in press. [DOI] [PubMed] [Google Scholar]
- 12.Bakker JM, Besson T, Lemaire J, Scuderi D, Maitre P. J Phys Chem A. 2007;111:13415–13424. doi: 10.1021/jp074935e. [DOI] [PubMed] [Google Scholar]
- 13.Frisch MJ, et al. Gaussian, Inc. Wallingford CT: 2004. 2004. [Google Scholar]
Associated Data
This section collects any data citations, data availability statements, or supplementary materials included in this article.
Supplementary Materials
Figure S1, S2, S3, additional band assignments and the complete references for 13. This material is available free of charge via the Internet at http://pubs.acs.org.


