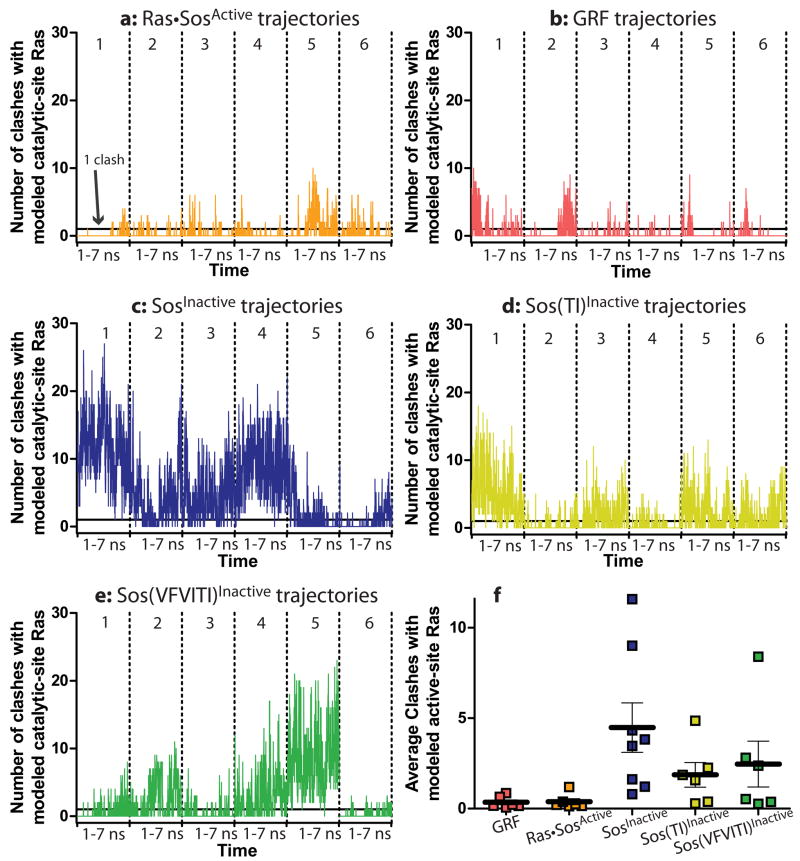
Fig. 4.
Active-site occlusion by the helical hairpin during the simulations. (a–e) The number of clashes (Cα -Cα contacts closer than 2.2 Å) between the helical hairpin and a Ras molecule modeled into the active site are counted every 10 ps along the trajectory of the each simulation. The solid line indicates 1 backbone clash between the helical hairpin and catalytic-site Ras. Six simulations are concatenated in each panel, and the dotted lines represent the boundaries between them. (g) The average number of clashes over each trajectory over time is plotted as a square. Points with similar y-axis values are spaced horizontally for clarity. The horizontal bars represent the overall average number of clashes for all simulations. According to an Anova analysis, RasGRF1, Ras•SosActive•Ras (see Supplementary Fig. 6), and Ras•SosActive simulations are not significantly different in their extents of active site occlusion. All other pairs of simulations in this figure have significantly different numbers of clashes between the helical hairpin and active-site Ras (p>.0001).

