

Abstract
A combination of spectroscopies and DFT calculations have been used to define the electronic structures of two crystallographically defined CuII-phenolate complexes. These complexes differ in the orientation of the phenolate ring which results in different bonding interactions of the phenolate donor orbitals with the CuII, which are reflected in the very different spectroscopic properties of the two complexes. These differences in electronic structures lead to significant differences in DFT calculated reactivities with oxygen. These calculations suggest that oxygen activation via a CuI phenoxyl ligand-to-metal charge transfer (LMCT) complex is highly endergonic (> 50 kcal/mol), hence an unlikely pathway. Rather, the two electron oxidation of the phenolate forming a bridging CuII peroxoquinone complex is more favorable (11.3 kcal/mol). The role of the oxidized metal in mediating this two electron oxidation of the coordinated phenolate and its relevance to the biogenesis of the covalently bound topa quinone in amine oxidase are discussed.
Keywords: absorption, MCD, EPR, resonance Raman, spectroscopy, DFT, TD-DFT calculations, reactivity
1. INTRODUCTION
Cu sites are ubiquitous in nature and perform a wide variety of functions.1 There are mononuclear (amine oxidase, galactose oxidase, nitrite reductase), binuclear (hemocyanin, tyrosinase), trinuclear (multicopper oxidases e.g. laccase) and tetranuclear (nitrous oxide reductase) copper active sites performing electron transfer, oxygen binding, activation and reduction and nitrogen metabolism.2,3 Amine oxidase and galactose oxidase are enzymes involved in the two electron reduction of dioxygen to hydrogen peroxide.4 These enzymes are particularly interesting because both enzymes undergo a copper catalyzed biogenesis reaction to create a covalently bound organic cofactor (2, 4, 5-trihydroxy phenylalanine quinone or TPQ for amine oxidase5,6,7,8, 9,10 and a thio-ether linked tyrosyl radical for galactose oxidase) in a post translational modification of a tyrosine residue.11,12 The resultant active site then performs the associated oxidase reaction.
The pre-processed form of amine oxidase (anaerobic copper loaded to the apo enzyme) has CuII bound to three histidine ligands with a tyrosine ∼2.6 Å away from the copper center in a distorted trigonal pyramidal geometry (Figure 1A).13 In the presence of oxygen, the tyrosine residue is proposed to coordinate to CuII forming a ligand-to-metal charge transfer (LMCT) complex in the first step of the biogenesis of TPQ.14,15 It is thus important to understand the nature of the CuII-phenolate bond which leads to the activation of the phenolate ring for oxygen attack. This is a particularly interesting reaction since rather than a reduced copper activating oxygen, this reaction involves an oxidized copper activating the tyrosine substrate. An analogous reaction occurs for intradiol dioxygenases where high spin FeIII activates the catechol substrate.16,17,18 For this reaction it has been shown that a LMCT process can overcome the spin forbidden nature of the reaction of triplet oxygen with the singlet substrate.19
Figure 1.

Crystal structures of A) pre-processed amine oxidase (PDB ID 1IVU) B) model complexes [Cu(OPh-4-F){HB(3,5-iPr2pz)3}] and C) [Cu(OPh-4-F){HB(3-tBu-5-iPrpz)3}].
A previously reported Cu-phenolate complex [Cu(OPh-4-F){HB(3,5-iPr2pz) 3}]20 (Figure 1B) is an excellent model for the active site of pre-processed amine oxidase and provides the opportunity to investigate the Cu-phenolate bonding and activation which can be used to understand the Cu-tyrosine interaction in amine oxidase. A second CuII-phenolate complex [Cu(OPh-4-F){HB(3-tBu-5-iPrpz)3}], has been prepared and structurally characterized (reported here, Figure 1C). The key difference between the two model complexes is in the orientation of the phenolate ring because of steric constraints imposed by the hydrotris(pyrazolyl)borate ligand substituents (Figure 1B,C). In this study we use a combination of spectroscopies and density functional calculations to elucidate the electronic structure of these two copper-phenolate model complexes and define how the orientation of the phenolate ring affects reactivity. We further evaluate the energetics of the oxygen reaction with the coordinated phenolate and whether radical character associated with the phenolate bonding to CuII (i.e. CuII-OPh ⇔ CuI.OPh) can contribute to this reaction.
2. EXPERIMENTAL METHODS
Materials
All reagents were of the highest grade commercially available and were used without further purification. Phenolate complex [Cu(OPh-4-F){HB(3,5-iPr2pz)3}] (L1) was synthesized as previously reported (yield, 64%; Anal. Calcd. for C33H50N6BCuFO: C, 61.92; H, 7.87; N, 13.13%. Found: C, 62.34; H, 8.09; N, 13.04%.).20 [Cu(OPh-4-F){HB(3-tBu-5-iPrpz)3}] (L3) was synthesized by coupling [Cu(OH){HB(3-tBu-5-iPrpz)3}]21 and 4-fluoro-phenol in dry dichloromethane solvent at -500 C for one hour. The dark blue solid which crystallized from octane/dichloromethane at -50 °C was then dried over vacuum (yield 48%; Anal. Calcd. for C36H56N6BCuFO·0.25CH2Cl2: C, 61.89; H, 8.10; N, 11.95%. Found: C, 61.81; H, 8.10; N, 12.24%).
Spectroscopic Studies
Low-temperature absorption spectroscopy was performed on a double beam spectrophotometer (Cary 500) using a liquid helium cryostat (Janis Research Super Vari-Temp). Low temperature solution spectra were also collected at -50°C using a UV-Vis diode array spectrophotometer (Agilent 8453, Ostuka Electronics MCPD 2000 with optical fiber attachment). MCD data were collected on CD spectropolarimeters (JASCO J810 with an S20 PM tube for the UV/Vis region, and a JASCO J200 with an InSb detector for the near-IR region) with sample compartments modified to accommodate magnetocryostats (Oxford Instruments, SM4-7T). Mulls were prepared by grinding the solid material in a mortar embedded in dry ice in a glove-bag purged with nitrogen gas. The fine powder was suspended in mineral oil and spread between precooled quartz disks. Solution samples were prepared by dissolving the solid in a glassing solvent (1:1 ether:2-methyl tetrahydofuran, or toluene or dichloromethane or dichloromethane/1,2-dichloroethane). It was more difficult to make glassing solution samples of L1 because it is very sensitive to moisture, and readily forms a five-coordinate green complex. EPR spectra were obtained using a Bruker EMX spectrometer, ER 041 XG microwave bridge, and ER 4102ST cavity. All X band data were taken at 77 K in a liquid nitrogen finger dewar. EPR spectra were baseline-corrected and simulated using XSophe (Bruker).
Raman spectra were obtained using a series of lines from Kr+ (Coherent 190CK) and Ar+ (Coherent Sabre 25/7) ion lasers with incident power ranging from 10 to 50 mW in an ∼135° backscattering configuration. Dye (Rhodamine 6G, Coherent 599) and Ti-Sapphire (Coherent 890) lasers were used for other spectral regions. Scattered light was dispersed through a triple monochromator (Spex 1877 CP, with 1200, 1800, and 2400 groove/mm gratings) and detected with a back-illuminated CCD camera (Princeton Instruments ST-135). Samples contained in NMR tubes were immersed in a liquid nitrogen finger dewar. Background spectra of pure solid Na2SO4 (for solid samples) and pure solvent (for solution samples) were taken under the same conditions. Raman peak intensities were referenced to solvent peaks for excitation profiles. Background spectra of charcoal in the same NMR tubes were used for baseline subtraction. Solution spectra were compared with solid sample spectra for both complexes (either by MCD or resonance Raman) and indicated that the molecular structures defined by the crystallography were maintained in solution.
Crystallography
The diffraction data were measured on a Rigaku/MSC Mercury CCD system with graphite monochromated Mo Kα (λ = 0.71069 Å) radiation in a cold nitrogen stream at -80 °C. Crystal was mounted on the tip of a glass fiber using a heavy weight oil. The unit cell parameters of this crystal were obtained using Rigaku Daemon software and refined using CrystalClear on all observed reflections.22 Data using 0.5° intervals in φ and ω for 40 s/frame at -80 °C for L3 were collected with a maximum resolution of 0.77 Å (744 oscillation images). The highly redundant data sets were reduced using CrystalClear and corrected for Lorentz and polarization effects. An empirical absorption correction was applied.23,24 Structures were solved by direct methods using the program SIR 92.25 The position of the metal atoms and their first coordination sphere were located from a direct method E-map; other non-hydrogen atoms were found in alternating difference Fourier syntheses (DIRDIF-99)26 and least-squares refinement cycles. These were refined anisotropically during the final cycles (CrystalStructure).23,24 Hydrogen atoms were placed in calculated positions. Crystallographic data and structure refinement parameters including the final discrepancies (R and Rw) are listed below. Crystallographic data have been deposited at the CCDC, 12 Union Road, Cambridge CB2 1EZ, UK and copies can be obtained on request, free of charge, by quoting the publication citation and the deposition numbers, L120 :740598 and L3: 644116. For L3: formula = C36H56BCuFN6O, triclinic, space group P (#2), a = 10.3150(5), b = 10.6042(7), c = 17.8417(7) Å, β = 79.667(8), β = 81.188(9), γ = 84.864(9)°, V = 1893.39(17) Å3, Z = 2, Dcalc = 1.197 gcm-3, μ = 6.166 cm-1, Reflections collected = 15384, Unique reflections = 8522, Rint = 0.019, , No. of observations = 7854 (I > 3σ(I)). R = 0.0546, Rw = 0.0762.
Computational Details
All Density Functional Calculations (DFT) were performed using the Gaussian 03 program (revision C.01). The optimized geometries have been calculated using the BP86 27,28,29functional with 38% Hartree-Fock exchange and the triple-ζ quality basis set proposed by Ahlrichs. 30,31 Polarization functions were included for the Cu center. For both complexes frequency calculations were performed to assure that the geometries are energy minima. Absorption spectra were calculated using Time Dependent-Density Functional Theory (TD-DFT) 32 with the hybrid functional B3LYP,28,33 a triple- ζ basis set, and a polarized continuum model (PCM) 34 with a dielectric constant of 8.93 (the experimental solvent was dichloromethane). The TD-DFT results were analyzed using the program Swizard. 35 The PyMolyze program36,37 was used to obtain the molecular orbital compositions and overlap populations. The electronic g-matrix and the hyperfine coupling tensor were calculated with the ORCA code,38, 39 using the hybrid functional B3LYP and a triple- ζ quality basis set. The polarized continuum model (PCM) with a dielectric constant of ε = 4 was employed to simulate a protein environment around the model complexes.
3. RESULTS
3.1. Crystal Structure
The L1 and L3 phenolate complexes (Figure 1) have four coordinate distorted tetrahedral environments comprised of a hydrotris(pyrazolyl)borate ligand system and a 4-fluoro-phenoxide ring. The complexes differ in the third position substitution of the pyrazole ring (iso-propyl substituent for L1 and tert-butyl substituent for L3), which lead to different orientations of the phenoxide ring, resulting in different spectroscopic properties (vide infra). Despite the fact that both L1 and L3 have similar Cu-O-C angles (1380 for L1 and 1260 for L3) the substituents induce very different orientations of the fluorophenolate. For L1, the phenolate ring is almost perpendicular to the Cu-O-C plane, while for L3 the tert-butyl groups force the ring to be in the Cu-O-C plane. The Cu-O bond length for L1 is very short (1.73 Å, table 1). However this can be due to disorder in the crystal structure as the R value is large (see DFT optimization, Section 3.5). L3 has a normal Cu-O bond length of 1.84 Å and a lower R value. The Cu-N bond lengths of L1 are more uniform (1.99, 2.02, 2.04 Å) compared to those of L3, which has one shorter Cu-N bond relative to two longer Cu-N bonds (1.93, 2.05, 2.08 Å). These complexes, which model the active site of the pre-processed enzyme amine oxidase, provide an opportunity to study the effect of orientation of the phenolate ring on the electronic structure and oxygen reactivity of this class of active site.
Table 1.
Crystal structure parameters of L1 and L3 complexes. All distances are in angstroms and all angles in degrees.
| Parameter | L1 | L3 |
|---|---|---|
| Cu-O | 1.731(3) | 1.837(2) |
| Cu-N4 | 2.043(4) | 2.085(3) |
| Cu-N6 | 1.995(4) | 1.931(2) |
| Cu-N8 | 2.023(3) | 2.046(2) |
| Cu-O-C | 138.0(4) | 126.0(2) |
| O-Cu-N4 | 120.1(2) | 103.20(9) |
| O-Cu-N6 | 129.8(2) | 161.91(9) |
| O-Cu-N8 | 121.1(1) | 103.30(9) |
| N4-Cu-N6 | 90.9(1) | 87.0(1) |
| N4-Cu-N8 | 92.5(1) | 109.48(9) |
| N6-Cu-N8 | 92.9(1) | 86.87(9) |
3.2. Absorption and MCD
The low temperature solution absorption spectrum and mull MCD data for the L1 complex are presented in Figure 2.1 The absorption spectrum is dominated by an intense charge transfer (CT) band at ∼14700 cm-1 and a weaker CT band at higher energy (∼28000 cm-1). The low temperature solution absorption spectrum of the L3 complex (Figure 3A) has a weak band at ∼14600 cm-1 and a more intense band at ∼28000 cm-1. This is the opposite intensity distribution compared to the L1 complex. MCD transitions gain intensity at low temperature and high magnetic field through a mechanism that selectively enhances the d→d transitions, which are often weak in absorption. A low symmetry CuII complex is expected to show four d→d transitions into the unoccupied β-LUMO. In addition, the phenolate ligand has an out-of-plane (oop) and an in-plane (ip) occupied π valence orbitals, which can potentially donate charge into the unoccupied metal 3d orbital (β-LUMO), resulting in two phenolate→ CuII d CT transitions. The trispyrazole ligand can also generate multiple CT transitions into the unoccupied metal 3d orbital. Simultaneous Gaussian fits of the absorption and MCD spectra resolve these transitions which are presented in Tables 2 and 3.
Figure 2.

L1 A) low temperature solution absorption spectrum in dichloromethane/1,2-dichloroethane B) 5 K, 7 T mull MCD spectrum. The Gaussian-resolved bands obtained from a simultaneous fit of the absorption and MCD spectra are shown by dashed lines.
Figure 3.

L3 A) low temperature solution absorption spectrum in ether/ 2-methyl THF B) 5 K, 7 T mull MCD spectrum. The Gaussian-resolved bands obtained from a simultaneous fit of the absorption and MCD spectra are shown by dashed lines.
Table 2.
Gaussian resolved peak positions and band assignments from absorption, MCD and TD-DFT spectra of L1.
| Band | Energy (cm-1) | ε (M-1cm-1) | MCD/Absa | TD-DFT (cm-1) | Assignment |
|---|---|---|---|---|---|
| 1 | 4849 | - | 5322 | dz2 | |
| 2 | 6745 | - | 7942 | dxz-dyz | |
| 3 | 8884 | 356 | -0.179 | pyr CT | |
| 4 | 11019 | 493 | -0.514 | 11632 | dxz+dyz |
| 5 | 12409 | 575 | 0.102 | 12176 | dxy |
| 6 | 14727 | 2363 | -0.012 | 16332 | oop OPh CT |
| 7 | 17081 | 1459 | -0.027 | 20304 | pyr CT |
| 8 | 20669 | 247 | -0.350 | 23337 | pyr CT |
| 9 | 22432 | 164 | -0.580 | 24556 | pyr CT |
| 10 | 26147 | 842 | -0.037 | 24642 | ip OPh CT |
| 11 | 28371 | 1397 | -0.014 | 26663 | pyr CT |
| 12 | 30322 | 1377 | -0.001 | 31637 | pyr CT |
Table 3.
Gaussian resolved peak positions and band assignments from absorption, MCD and TD-DFT spectra of L3.
| Band | Energy (cm-1) | ε (M-1cm-1) | MCD/Absa | TD-DFT (cm-1) | Assignment |
|---|---|---|---|---|---|
| 5100 | oop OPh CT | ||||
| 1 | 7499 | - | 11225 | dxz | |
| 2 | 9483 | 162 | 0.376 | 15078 | dyz |
| 3 | 10860 | 321 | 0.100 | 15574 | dz2 |
| 4 | 14576 | 890 | -0.342 | 16035 | dxy |
| 5 | 16250 | 548 | -0.205 | 22083 | pyr CT |
| 6 | 22800 | 137 | -0.379 | 23836 | pyr CT |
| 7 | 25740 | 685 | -0.178 | 26598 | pyr CT |
| 8 | 27852 | 1764 | -0.058 | 28216 | ip OPh CT |
Normalized ratio of MCD intensity to absorption intensity. This ratio approximates the relative C/D ratios for mull data, where it is not possible to obtain absolute C/D ratios. Sometimes a CT band might have a high C/D ratio when there is significant amount of metal character in the transition.
Generally a higher C/D ratio (MCD/Absorption intensity) for a band indicates a d→d transition. Based on the C/D ratios, the transitions have been categorized as CT (C/D < 0.01) and d→d bands (C/D > 0.1), in Table 2 and 3 for L1 and L3 respectively. Bands 1, 2, 4 and 5 in Figure 2 have been assigned as d→d bands in L1, and bands 1-4 in Figure 3 have been assigned as d→d bands in L3. Since there can be four d→d transitions and there are five bands observed (bands 1-5, Figure 2) in the lower energy region of L1, band 3 can be assigned as a low energy pyrazole Cu CT transition. This is based on a previous study of a Cu-thiolate complex of L1.40 L3 should also show a weak pyrazole π→ CuII CT transition in this region, but a fifth transition is not required by the data. The ligand field transitions of L3 are blue shifted compared to L1, indicating a stronger ligand field for L3. In L1, the intense transition at 14727 cm-1 with molar extinction coefficient of 2360 M-1cm-1 is assigned as a phenolate → Cu CT transition (see resonance Raman data). Bands 7-12 in L1 are also assigned as CT transitions based on low C/D values. Importantly, in L3, band 4 at 14576 cm-1 (Figure 3), is very intense in MCD and is assigned as a d→d transition based on its high C/D ratio (0.34). The higher energy bands in L3 (bands 5-8) are assigned as CT transitions. Detailed assignments of these transitions (presented in Tables 2, 3) are described in Section 4.2 based on TD-DFT calculations, correlated to the spectra.
3.3. Resonance Raman
The solution resonance Raman spectra of the L1 (blue) and L3 (red) complexes obtained at 77 K with 647 nm excitation are shown in Figure 4. The Cu-O stretch which observed at 569 cm-1 in L1, is shifted to 545 cm-1 in L3. This indicates that the Cu-O bond is stronger in the L1 complex. Multiple features are observed between 1100-1600 cm-1 which are typical of metal phenolate complexes (Figure 4B). The peaks at 1141 cm-1 can be assigned as C-H bending modes. The peaks at ∼1285-1290 cm-1 are assigned as C-O stretching vibrations. The C-C stretching vibrations appear at ∼1493 and 1598 cm-1.41,42
Figure 4.

Resonance Raman spectrum of L1 (blue) and L3 (red) in toluene (black) (A) low frequency Cu-O stretch (B) high frequency C-O stretch, excited at 647 nm. Data were collected at 77 K.
The resonance Raman profile of L1 is shown in Figure 5A. The Cu-O and C-O profiles clearly indicate the presence of two distinct phenolate → Cu CT transitions centered around ∼14700 cm-1 and ∼26000 cm-1. These two CT transitions can be assigned as the ip and the oop phenolate π CT. For a free phenolate ligand these transitions are separated by 6000 cm-1. Thus this large splitting of the phenolate π orbitals (∼11000 cm-1) results from coordination to the CuII (see Section 4.3). The resonance Raman profile of L3 (Figure 5B) shows mainly C-O and some Cu-O enhancement at ∼14500 cm-1, indicating some phenolate →Cu CT character mixed into this d→d transition (vide infra). There was no Cu-O, C-O or Cu-N enhancement observed with excitation at higher energies for L3 (Figure 5B).
Figure 5.

The resonance Raman excitation profiles of Cu-O (green) and C-O (purple) stretches overlaid on the absorption spectrum (solid black line) with Gaussian fits (dotted lines): A) L1 B) L3.
3.4. EPR
The frozen glass EPR spectra of the complexes with simulations are presented in Figure 6. The EPR parameters are summarized in Table 4. The EPR spectra show that the complexes have an S=1/2 ground state with g1 > g2 > g3 > 2.0. The g values are strongly rhombically split which reflects significant dz2 mixing into a dx2-y2 ground state wave function (see Section 4.1). Also note that the largest hyperfine (A3) is associated with the smallest g value (g3), likely reflecting some Cu 4s mixing into the singly occupied d orbital (vide infra).
Figure 6.

Frozen glass EPR spectra (solid line) and simulation (dotted line) of A) L1 in dichloromethane/1,2-dichloroethane B) L3 in ether/2-methyl THF, at 77K.
Table 4.
EPR parameters of L1 and L3.
| Complex | g1 | g2 | g3 | A1 | A2 (×10-4 cm-1) |
A3 |
|---|---|---|---|---|---|---|
| L1 | 2.320 | 2.135 | 2.01 | 5 | 67 | 120 |
| L3 | 2.317 | 2.125 | 2.005 | 0 | 20 | 143 |
3.5. Electronic Structure Calculations
For geometry optimizations the L1 and L3 complexes were modeled by replacing the iso-propyl and tert-butyl groups, respectively, which are not oriented towards the 4-fluorophenolate ring by hydrogen. For both optimized structures frequency calculations and stability checks were performed to ensure the structures converged to energy minima. Table 5 compares the most relevant geometric parameters for L1 and L3 with the crystal structures (see Figure 1 and Table 1 for the labeling of the atoms). Figure 7 gives the overlay of the crystal and optimized structures, showing good agreement between experiment and calculations. The optimized structure of L1 gives a longer Cu-O bond length (1.83 Å) compared to that observed in the crystal structure (1.73 Å). This discrepancy likely reflex the large isotropic thermal parameter in the crystallographic data (B value ∼ 9.5).43 Badger’s analysis correlating the ressonance Raman stretching frequencies with the bond lengths of L1 and L3, predicts the bond length of L1 to be 1.82 Å, which is close to the theoretically calculated bond length (1.83 Å). The ring orientations in the crystal structures of L1 and L3 are reproduced in the optimized structures.
Table 5.
Comparison of the geometric parameters for L1 and L3 crystal structures and geometry optimized structures. All distances are in Angstroms and all angles in degrees.
| L1 | crystal | optimized | L3 | crystal | optimized |
|---|---|---|---|---|---|
| Cu-O | 1.732 | 1.832 | Cu-O | 1.837 | 1.823 |
| Cu-N4 | 2.043 | 2.100 | Cu-N4 | 2.086 | 2.076 |
| Cu-N6 | 1.994 | 1.952 | Cu-N6 | 1.931 | 1.954 |
| Cu-N8 | 2.023 | 2.009 | Cu-N8 | 2.045 | 2.085 |
| O-Cu-N4 | 120.076 | 107.238 | O-Cu-N4 | 103.184 | 105.753 |
| O-Cu-N6 | 129.873 | 141.642 | O-Cu-N6 | 161.900 | 157.761 |
| O-Cu-N8 | 121.043 | 119.425 | O-Cu-N8 | 103.332 | 104.279 |
| N4-Cu-N6 | 90.891 | 90.659 | N4-Cu-N6 | 86.972 | 87.682 |
| N4-Cu-N8 | 92.437 | 93.549 | N4-Cu-N8 | 109.515 | 105.354 |
| N6-Cu-N8 | 92.980 | 92.084 | N6-Cu-N | 86.897 | 88.609 |
Figure 7.

Overlap between the crystal structure and the optimized geometry for L1 (left) and L3 (right).
A comparison of the charge and spin density distribution on the atoms of the optimized L1 and L3 structures are provided in Table 6. These show that the spin density on the phenolate ring is higher and charge is lower for L1 than L3, thus the covalent interaction of the phenolate with CuII is greater in L1. These computational results indicate that the orientation of the phenolate ring affects its donor interaction with the CuII.
Table 6.
Total spin density and Mulliken charge on the Cu atom, the OPhF ligand and the HB(3,5-iPr2pz)3 for L1 and L3
| Compound | Cu | phenO | tpzb |
|---|---|---|---|
| L1(spin) | 0.742 | 0.144 | 0.114 |
| L3(spin) | 0.794 | 0.090 | 0.117 |
| L1(charge) | 1.213 | -0.557 | -0.655 |
| L3(charge) | 1.438 | -0.661 | -0.777 |
4. ANALYSIS
4.1. Ground State Wavefunction
The different orientations of the phenolate ring in L1 and L3 result in very different spectral features. These electronic structure differences experimentally reflect qualitative differences in the molecular orbitals of these complexes. We focus on the five copper d orbitals, the phenolate oop (which is the HOMO for both complexes) and ip (HOMO-4 for L1 and HOMO-10 for L3 in a model without substituents on the hydrotris(pyrazolyl)borate / tpzb ligand) orbitals and the lowest energy tpzb π donor orbital (HOMO-1 in both complexes). Lower energy tpzb orbitals are involved in π and σ donor bonds and contribute to the CT spectra in the higher energy region.
Figure 8 gives these MO diagrams (β orbitals which reflect d→d and CT transitions into the β LUMO of Cu) for L1 and L3 with complete MO diagrams provided in the Supporting Information. The MO diagrams show that the occupied d orbitals in L3 are lower in energy (relative to the β LUMO) than L1 indicating a higher ligand field strength in L3 compared to L1, as observed experimentally. The d orbital splitting pattern (dx2-y2 (β LUMO) > dz2 > dxz-dyz > dxz+yz > dxy for L1 and dx2-y2 (β LUMO) > dxz > dz2 > dyz > dxy for L3) in the g tensor coordinate systems (vide infra) indicate large rhombic distortions.
Figure 8.

Simplified MO diagram of the β-MOs of L1 (left) and L3 (right), showing the LUMO, the HOMO (phenolate oop), the HOMO-1 (tpzb orbital), the five Cu d orbitals and the phenolate ip orbital.
The different orientations of the phenolate rings of the L1 and L3 complexes result in a major difference in the nature of their β LUMOs (Figure 9). L1 has 56.4% Cu d which is delocalized into the oop phenolate LUMO resulting in a π type ground state (Figure 9A). Alternatively, L3 has 65.1% Cu d which is delocalized into the ip phenolate LUMO which results in a σ bonding interaction with the singly occupied d orbital. This difference in the ground state wavefunction produces different splittings of the ip and oop phenolate orbitals in the two complexes and results in the large observed spectral differences between these complexes in Figure 2 and 3 (vide infra).
Figure 9.

β LUMO of A) L1 and B) L3.
From Figure 9 it is clear that both LUMOs have a contribution of dz2 mixed into the dx2-y2 orbital. To get this composition of the LUMO, the molecule has been orientated along the principle axes of the electronic g-tensor. Using this alignment, the d component of the ground state wavefunction for L1 is Ψ(L1) = 91.7% dx2-y2 + 6.9% dz2, while for L3 is Ψ(L3) = 88.4% dx2-y2 + 11.5% dz2. Thus the mixing of dz2 into dx2-y2 is larger for L3. This is consistent with the larger rhombicity observed in the EPR spectrum of L3 relative to L1 in Figure 6. The calculated g values in the principle coordinate system, while quantitatively off, reproduce the experimental trend (Table 7). The hyperfine coupling tensor was calculated to be aligned with the g-matrix giving the A values summarized in Table 7. The calculated A values also are not in quantitative agreement but reproduce the experimental trends. The considerable amount of calculated 4s mixing (1.9% for L1 and 4.9% for L3) results in the highest A value being associated with the lowest g value.
Table 7.
Experimental vs. calculated g and A values for L1 and L3. The HFC values are provided in x 104 cm-1.
| Compound | g1 | g2 | g3 | A1 | A2 | A3 |
|---|---|---|---|---|---|---|
| L1(exp) | 2.320 | 2.135 | 2.010 | 5 | 67 | 120 |
| L1(calc) | 2.304 | 2.219 | 2.029 | -9 | -13 | 52 |
| L3(exp) | 2.317 | 2.125 | 2.005 | 0 | 20 | 143 |
| L3(calc) | 2.275 | 2.159 | 2.010 | 2 | 6 | 75 |
4.2. Time Dependent DFT Calculations and Spectroscopic Assignments
The absorption spectrum of L1 is dominated by an intense CT band at ∼15000 cm-1 and a weaker transition at ∼28000 cm-1. L3 shows bands at similar energies but with an inverse intensity distribution i.e. the band at ∼28000 cm-1 is more intense than the band at ∼15000 cm-1 (experimental data from Figure 2A and 3A combined in Figure 10A). TDDFT calculations on these complexes qualitatively reproduce these experimental energies and intensity distributions (Figure 10B).
Figure 10.

Overlay of L1 (blue) and L3 (red) A) low temperature experimental absorption spectra B) TD-DFT calculated absorption spectra.
The observed electronic transitions of the two complexes (Figures 2, 3) are assigned by combining the experimental and TD-DFT results and are presented in Tables 2 and 3. In L1, bands 2 and 4 (Figure 2, assigned as ligand-field transitions in section 3.2) show a pseudo-A term in the MCD spectrum (i.e. derivative shaped, oppositely signed C term transitions) characteristic of the dxz and dyz transitions which have effective spin-orbit coupling. TD-DFT calculations assign bands 1, 2, 4 and 5 as the dz2, dxz-dyz, dxz+dyz and dxy →dx2-y2 transition respectively. Band 3 is assigned as a low energy pyrazole π → Cu dx2-y2 CT transition. The presence of high energy pyrazole orbitals in the MO diagram (Figures 8, S1) supports the possibility of a low energy pyrazole CT band; however, the TD-DFT calculations predict pyrazole CT bands at higher energies (Table 2). Band 6 and 10 (Figure 2) are assigned as phenolate→ Cu CT transitions based on the resonance Raman profiles (Figure 5A). TD-DFT calculations are consistent with these assignments and further identify band 6 as the oop phenolate → Cu CT transition and band 10 as the ip phenolate → Cu CT transition. Bands 7-9 and 11, 12 are assigned as pyrazole → Cu CT bands based on the TD-DFT results. Bands 8 and 9 are relatively intense in MCD because they have more metal 3d character (5-9%) covalently mixed into their associated pyrazole donor orbitals.
In the case of L3 (Figure 3), bands 1 and 2 show the pseudo-A term, and hence are assigned as the dxz and dyz → dx2-y2 ligand field transitions. Based on the signs of the MCD spectrum bands 3 and 4 are assigned as dxy and dz2 → dx2-y2 transitions, respectively. TD-DFT calculations support these assignments. Importantly from its C/D value band 4 is assigned as a d→d transition (Section 3.2) even though it has a higher extinction coefficient than most d→d bands (∼900 M-1cm-1), and shows some resonance enhancement of the Cu-O vibration (Figure 5B). This high absorption intensity likely reflects the 10% ip phenolate CT character calculated to be mixed into this d→d band. TD-DFT calculations assign band 8 as the ip phenolate → Cu CT transition. These also predict an oop phenolate → Cu CT transition at ∼5100 cm-1 which is not detected experimentally. Bands 5-7 are assigned as pyrazole CT transitions based on the TD-DFT calculations. Band 7 is calculated to have ∼5% metal 3d character mixed into the pyrazole CT transition, resulting in significant MCD intensity. The presence of similar high energy pyrazole orbitals in the MO diagram (Figure 8 right, S1) predicts a similar low energy pyrazole π → Cu CT transition in L3 as in L1, however such a transition is not resolved in L3 reasonably due to overlapping transitions.
4.3. Phenolate-Cu(II) Bonding
As indicated above the phenolate ligand has two valence orbitals available for bonding to CuII; these are the oxygen p-orbitals ip and oop of the aromatic ring and delocalized into the ring (Scheme 1). In the free phenolate ligand these orbitals are split by ∼6000 cm-1, the ip orbital (O coefficient = 79.6%) being more stable than the oop orbital (O coefficient = 36.8%). When the oxygen of the phenolate ligand is bound to a charged metal ion with little covalency (e.g. ZnII, Scheme 1), this splitting increases to ∼20000 cm-1 (in both L1 and L3 orientations). When the phenolate ligand is bound to the CuII tpzb ligand in the L1 and L3 orientations, the splitting between the ip and oop orbitals is calculated to be ∼16600 cm-1 and 23200 cm-1 respectively. The different splitting in the L1 and L3 complexes is associated with the different bonding interactions of these orbitals with the singly occupied MO of CuII in the two complexes due to the different orientation of the phenolate plane relative to the Cu-O bond (see β LUMOs in Figure 9).
Scheme 1.

Splitting of the ip and oop orbitals of the free phenolate (center) and in model complexes [M(NH3)3phenO]+ where M = ZnII or CuII. Left side is for the L1 ring conformation and right side is for the L3 ring conformation. All energies are in cm-1.
In the case of L1, the higher energy oop phenolate orbital has a strong bonding interaction with the LUMO (Figure 9A), thus it is stabilized. This results in a decrease in the energy difference between the non-bonding ip orbital and the bonding oop orbital relative to the splitting in the ZnII reference complex. The good overlap between the oop phenolate orbital and the β LUMO results in an intense low energy CT transition as observed (band 6, Figure 2). This is far more intense than the higher energy ip phenolate → Cu CT transition (band 11), as the latter has little overlap with the β LUMO.
In the case of L3, the lower energy ip orbital has a bonding interaction with the LUMO (Figure 9B) which further stabilizes it. This results in a larger splitting of the ip and oop phenolate orbitals in L3 (Scheme 1, right) relative to the ZnII reference complex. The oop phenolate orbital has little overlap with the β LUMO leading to a low energy, very weak CT transition calculated to be at 5100 cm-1. The good overlap between the ip phenolate orbital and the β LUMO results in an intense high energy phenolate ip π → Cu CT transition (band 8, Figure 3).
4.4. Reactivity
4.4.1 Radical Character and its Contribution to Oxygen Reactivity
Calculations were performed on the L1 and L3 complexes by replacing the CuII by ZnII and the phenolate by a phenoxyl radical to evaluate the amount of radical character in the phenolate ring for the CuII complexes compared to that of a phenoxyl radical bound to a metal center. Table 8 shows that the L1-Zn-phenoxyl and L3-Znphenoxyl complexes have 77% and 74% spin density on the phenoxyl ring, respectively. In contrast, the spin density on L1 is 14% and L3 is 9% (Table 6), with the spin density being delocalized in the oop phenolate orbital in L1 and in the ip phenolate orbital for L3. This shows that L1 is slightly more activated than L3, but more importantly, the amount of radical character in both L1 and L3 are small compared to their respective Znphenoxyl complexes.
Table 8.
Spin density distribution of Zn phenoxyl complexes of L1 and L3.
| Compound | Zn | phenO | tpzb |
|---|---|---|---|
| L1Zn | 0.002 | 0.772 | 0.226 |
| L3Zn | -0.007 | 0.745 | 0.262 |
To evaluate the possibility of O2 attack on the ring of a phenoxyl radical in these copper complexes, the Gibbs free energies of O2 binding for different systems were compared. The ΔG for the reaction between a phenoxyl radical and O2 is 19.2 kcal/mol (Scheme 2I). The ΔG for the O2 attack on the L1 Zn-phenoxyl complex generating a ZnIIsuperoxoquinone, decreases to 11.9 kcal/mol (Scheme 2II). This is due to the fact that the positively charged metal has an electrostatic interaction with the oxygen of the phenoxyl group. The amount of charge on the oxygen of the free phenoxyl radical is -0.25 compared to -0.86 for ZnIIphenoxyl. This electrostatic interaction polarizes the spin and activates the ring for O2 attack.
Scheme 2.

ΔG and structures for the O2 attack on the ortho C in (from left to right) phenoxyl, ZnIIphenoxyl, L1CuIIphenolate and L3CuIIphenolate. All energies in kcal/mol.
The reaction of L1CuIIphenolate with O2 oriented such that it cannot bind to the CuII results in the formation of a L1CuIsuperoxoquinone complex with a ΔG of 50.7 kcal/mol (Scheme 2III). This reaction is calculated to involve a two electron process. One electron is transferred from the oop phenolate orbital to the O2, and the other electron transfers from this orbital to the singly occupied CuII d orbital. This LMCT process results in a CuI that parallels the LMCT band observed in the experimental absorption spectrum at 14730cm-1 (42.1 kcal/mol). The high ΔG (50.7 kcal/mol) can be understood as related to the sum of the energy required to transfer an electron from phenolate → CuII (the LMCT transition, 42.1 kcal/mol) to create a phenoxyl radical, and the energy of the O2 reaction with this phenoxyl radical (∼12 kcal/mol).
The full optimization of L3CuIIphenolate with O2 results in a complex where the phenolate ring orientation is similar to that of the L1 complex. Therefore we introduced constraints in the optimization to restrict the ring in the L3 configuration. The calculated ΔG for the O2 reaction in the L3 ring conformation is 80 kcal/mol (Scheme 2IV), which includes the LMCT transition (experimentally observed at higher energy; 27850 cm-1 because it requires CT from the ip orbital) combined with the reaction of O2 with the resultant phenoxyl radical. All calculated energies are summarized in Scheme 2.
Finally, it should be noted that the experimental cyclic voltametry of L1 and L3 shows very low potential irreversible reduction peaks at -1215 mV and -1280 mV respectively against the ferrocene/ferrocenium couple. This indicates that the reduction of these complexes is extremely unfavorable, also inconsistent with the radical mechanism.
4.4.2 Cu Phenolate Reactivity
The ΔG for the reaction of dioxygen with phenol is 20 kcal/mol. The proton of the phenol transfers to the O2 generating a hydroperoxoquinone (Scheme 3I). The ΔG for the O2 reaction with a Zn phenolate complex (where CuII has been replaced by ZnII in L1 configuration), leads to the formation of ZnIIperoxoquinone (22.3 kcal/mol, Scheme 3II), which is similar to the reference phenol complex. Thus, the tpzbZnII group mimics the role of a proton. Note that for the structure in Scheme 3II, the phenolate species binds to ZnII via the peroxo bridge instead of the quinone oxygen (Zn-O quinone bond length = 2.54 Å). When L1CuIIphenolate reacts with O2 (allowing O2 to bridge to CuII), the ΔG dramatically decreases to 11.3 kcal/mol (Scheme 3III) and the resulting complex is an L1CuIIperoxo bridged quinone forming a six member ring, with the quinone O also bonded to CuII (Cu-O quinone bond length = 2.13 Å). To understand the significant difference in energies between the ZnII and CuII phenolate reactions with O2, geometry optimizations were performed on L1CuIIperoxoquinone keeping the CuII-O (oxygen of the quinone) distance the same as in the ZnIIperoxoquinone complex (2.54 Å, Scheme 3IV). The ΔG is 16 kcal/mol which is lower than that for the ZnII phenolate/O2 reaction. This indicates that bonding to the CuII is playing a role in the decreasing of the ΔG of O2 attack. Inspection of the frontier MO for both the ZnIIperoxoquinone and L1CuIIperoxoquinone reveals that while both have the same LUMO (antibonding quinone oop), L1 has the dx2-y2 orbital as the LUMO+1, while there is no such equivalent orbital in the ZnII complex which is d10. This LUMO+1 in the CuII complex shows a strong bonding interaction between the dx2-y2 orbital and the peroxo as well as some bonding with the O of the quinone (Figure 11). These additional σ bonding interactions between peroxoquinone and the CuII result in the lower ΔG for the O2 reaction of the CuII relative to the ZnII phenolate complex.
Scheme 3.

ΔG and structures for the O2 attack on the ortho C in (from left to right) phenol, ZnIIphenolate, L1CuIIphenolate, L1CuIIphenolate (Cu-O quinone bond length = 2.54 Å) and L3CuIIphenolate. All energies are in kcal/mol.
Figure 11.
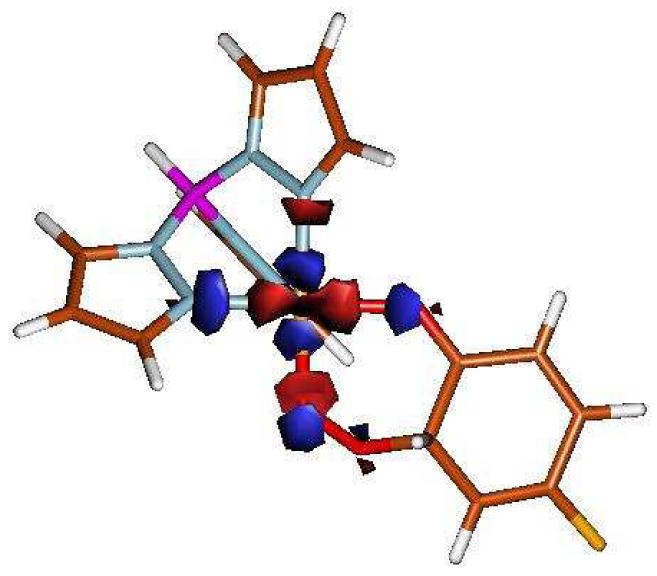
LUMO+1 MO for L1CuIIperoxoquinone, showing the interaction between the dx2-y2 orbital and the peroxobridge.
O2 attack on L3 (phenolate ring constrained in L3 configuration) also results in the formation of an L3CuIIperoxoquinone (Scheme 3V), but with a ΔG of 37.3 kcal/mol. The higher ΔG is a consequence of the steric repulsion between the oxygen of the peroxobridge and two nitrogens of the tpzb system in the constrained structure. All energies are summarized in Scheme 3.
5. DISCUSSION
The L1 and L3 complexes in Figure 1 provide two very different phenolate ring orientations due to the different steric requirements of iso-the propyl and tert-butyl substituents on the pyrazole ligand. These lead to very different frontier molecular orbitals. L1 has the oop phenolate p-orbital in a π bonding interaction with the Cu dx2-y2 orbital, while L3 has the ip phenolate p-orbital in a pseudo-σ type interaction with the β LUMO (Figure 9). The different LUMOs of the two complexes lead to their very different spectroscopic properties. L1 has a smaller splitting between the ip and the oop phenolate CT transitions with a low energy intense oop phenolate CT band. Alternatively, L3 has greater overlap of the ip phenolate π with the dx2-y2 orbital and a larger energy splitting between the ip and the oop phenolate CT bands, having the intense ip phenolate CT transition at a higher energy (Scheme 1).
These differences in orientation lead to significant differences in bonding. The spin density on these complexes shows that L3 has less radical character (9%) compared with L1 (14%), though the amount of radical character in both is small compared to a reference Zn phenoxyl analogue (74-77%, Table 8). The O2 reaction with L1 CuIIphenolate forming a CuIsuperoxoquinone species is ∼29 kcal/mol more favored than the L3 analogue (Scheme 2) because of the presence of the lower energy phenolate LMCT transition in L1. Also the O2 reaction of CuIIphenolate forming a CuIIperoxoquinone species is ∼26 kcal/mol more favorable for L1 than L3 (Scheme 3). Thus the L1 ring orientation is the preferred orientation for O2 attack.
Importantly, the reaction of O2 with L1 is not likely to proceed via a radical mechanism, since the amount of radical character in the ring is small. The energy for the radical reaction generating the superoxoquinone is high (51 kcal/mol), reflecting the energy of the associated LMCT transition. However, the energy of O2 attack for L1 CuIIphenolate to form a coordinated peroxoquinone is significantly lower (11.3 kcal/mol) than for the radical reaction, and in fact for this reaction on the corresponding ZnII phenolate complex or phenol (Scheme 3). The latter is due to the presence of an unoccupied dx2-y2 orbital in CuII but not in d10 ZnII. This orbital has good σ bonding interactions with the peroxy and O donor orbitals of the quinone, providing stabilization to form the bridging peroxoquinone.
The uncatalyzed O2 reaction of organic substrates, like phenols, are kinetically slow because of their spin forbidden nature (O2, S= 1; phenol, S= 0). It has been shown that an oxidized metal center can act as a buffer to catalyze the spin forbidden O2 reaction with a coordinated substrate via a low energy LMCT transition.19 This model applied to L1 is depicted in Scheme 4, where the triplet O2 is antiferromagnetically aligned with the CuII (S = ½) due to orbital overlap along the reaction coordinate. The two electron reduction of triplet O2 from singlet phenolate could proceed by transferring one electron (spin up) from the phenolate directly onto the O2 orbital which is σ bonded to the carbon, and another electron (spin up) from CuII through a π interaction with the triplet O2. The latter could be compensated by transferring an electron (spin down) from the phenolate ligand to CuII via the experimentally observed low energy intense LMCT (14730 cm-1 band for L1) pathway. This results in a two electron oxidation of a phenolate by triplet O2 without affecting the oxidation state of the CuII. This mechanism does not require radical character in the ring and simply has the metal playing the role of a buffer in transferring an electron from the substrate to O2 but of proper spin.
Scheme 4.

Schematic representation of electron transfer in the O2 reaction of L1CuIIphenolate forming the CuIIperoxoquinone.
The generally proposed mechanism for the cofactor biogenesis of TPQ from tyrosine in amine oxidases invokes O2 attack on a transient CuI tyrosyl radical species.44,45 The present study on model systems indicates that the O2 attack on the CuIIphenolate yielding a radical CuIsuperoxyquinone is in fact, energetically unfavorable (51 kcal/mol). Alternatively, the reaction free energy for O2 attack on CuIIphenolate generating a metallocycle CuIIperoxoquinone species is only 11.3 kcal/mol which is comparable to the experimental barrier of 15 kcal/mol for TPQ formation (78 M-1s-1 at high pH).2 In contrast to the radical reaction, this is spin forbidden. However as described above, a LMCT process can overcome this, and indeed an absorbance band is observed along the reaction coordinate of O2 with CuII preprocessed enzyme.15,14 These and other possible mechanisms for O2 activation by a phenolate/tyrosine ring (e.g. H atom abstraction of the phenol proton by a CuIIOH- site) need to be evaluated for the actual enzyme active site. We finally note that L1 has the more preferred ring orientation for O2 attack and its ring orientation reflects the orientation of the tyrosine ring in the preprocessed active site of amine oxidase (Figure 1).
Supplementary Material
ACKNOWLEDGMENT
This research was supported by NIH Grant DK-31450 (E.I.S), by JSPS Grant (Scientific Research (B) 17350043) and by MEXT grant (Scientific Research on Priority Areas, 19020011) (K.F.). K.F. is grateful to Prof. K. Okamoto (University of Tsukuba) for his encouragement. S.G is grateful for the William S. Johnson fellowship. J.C. is grateful to the Generalitat de Catalunya for the Beatriu de Pinos fellowship (2006 BP-A 10041).
Footnotes
Glassing solution samples for MCD could not be prepared for L1 due to partial formation of a five coordinate complex because of its extreme moisture sensitivity. L3 mull and solution MCD data were identical.
Note that there is no observed reactivity of L1 and L3 with O2 in dry dichloromethane solvent. This likely reflects the endergonic nature of the O2 combined with the lack of protons to drive the reaction. The latter would be presented in the enzyme system.
Supporting Information Available. Coordinates for optimized geometries, ΔG for O2 binding to phenol, phenoxyl and phenolate in both spin states, complete MO diagrams, complete reference 27 and cif files of L1 and L3 are available free of charge from http://pubs.acs.org
REFERENCES
- 1.Holm RH, Kennepohl P, Solomon EI. Chem. Rev. 1996;96:2239. doi: 10.1021/cr9500390. [DOI] [PubMed] [Google Scholar]
- 2.Solomon EI, Chen P, Metz M, Lee S, Palmer AE. Angew. Chem. Intl. Ed. 2001;40:4570. doi: 10.1002/1521-3773(20011217)40:24<4570::aid-anie4570>3.0.co;2-4. [DOI] [PubMed] [Google Scholar]
- 3.Solomon EI, Sarangi R, Woertink JS, Augustine AJ, Yoon J, Ghosh S. Acc. Chem. Res. 2007;40:581. doi: 10.1021/ar600060t. [DOI] [PMC free article] [PubMed] [Google Scholar]
- 4.Klinman JP. Chem. Rev. 1996;96:2541. doi: 10.1021/cr950047g. [DOI] [PubMed] [Google Scholar]
- 5.Janes SM, Mu D, Wemmer D, Smith AJ, Kaur S, Maltby D, Burlingame AL, Klinman JP. Science. 1990;248:981. doi: 10.1126/science.2111581. [DOI] [PubMed] [Google Scholar]
- 6.Mu D, Medzihradszky KF, Adams GW, Mayer P, Hines WM, Burlingame AL, Smith AJ, Cai D, Klinman JP. J. Biol. Chem. 1994;269:9926. [PubMed] [Google Scholar]
- 7.Cai D, Klinman JP. J. Biol. Chem. 1994;269:32039. [PubMed] [Google Scholar]
- 8.Cooper RA, Knowles PF, Brown DE, McGuirl MA, Dooley DM. Biochem.J. 1992;288:337. doi: 10.1042/bj2880337. [DOI] [PMC free article] [PubMed] [Google Scholar]
- 9.Matsuzaki R, Fukui T, Sato H, Ozaki Y, Tanizawa K. FEBS Lett. 1994;351:360. doi: 10.1016/0014-5793(94)00884-1. [DOI] [PubMed] [Google Scholar]
- 10.Nakamura N, Matsuzaki R, Choi Y, Tanizawa K, Sanders-Loehr J. J. Biol. Chem. 1996;271:4718. doi: 10.1074/jbc.271.9.4718. [DOI] [PubMed] [Google Scholar]
- 11.McGuirl MA, Dooley DM. Curr. Op. Chem.Biol. 1999;3:138. doi: 10.1016/S1367-5931(99)80025-8. [DOI] [PubMed] [Google Scholar]
- 12.Firbank SJ, Rogers M, Hurtado-Guerrero R, Dooley DM, Halcrow MA, Phillips SEV, Knowles PF, McPherson MJ. Biochem. Soc. Trans. 2003;31:506. doi: 10.1042/bst10.1042/. [DOI] [PubMed] [Google Scholar]
- 13.Kim M, Okajima T, Kishishita S, Yoshimura M, Kawamori A, Tanizawa K, Yamaguchi H. Nat. Struct. Biol. 2002;9:591. doi: 10.1038/nsb824. [DOI] [PubMed] [Google Scholar]
- 14.Dove JE, Schwartz B, Williams NK, Klinman JP. Biochem. 2000;39:3690. doi: 10.1021/bi992225w. [DOI] [PubMed] [Google Scholar]
- 15.Schwartz B, Dove JE, Klinman JP. Biochem. 2000;39:3699. doi: 10.1021/bi9922244. [DOI] [PubMed] [Google Scholar]
- 16.Lipscomb JD, Orville AM. In: Degradation of EnVironmental Pollutants by Microorganisms and Their Metalloenzymes. Sigel H, Sigel A, editors. Marcel Dekker, Inc.; New York: 1992. pp. 243–298. [Google Scholar]
- 17.Que L, Jr., Ho RYN. Chem. Rev. 1996;96:2607. doi: 10.1021/cr960039f. [DOI] [PubMed] [Google Scholar]
- 18.Solomon EI, Brunold TC, Davis MI, Kemsley JN, Lee SK, Lehnert N, Neese F, Skulan AJ, Yang Y-S, Zhou J. Chem. Rev. 2000;100:235. doi: 10.1021/cr9900275. [DOI] [PubMed] [Google Scholar]
- 19.Pau MYM, Lipscomb JD, Solomon EI. Proc. Nat. Acad. Sci. 2007;104:18355. doi: 10.1073/pnas.0704191104. [DOI] [PMC free article] [PubMed] [Google Scholar]
- 20.Fujisawa K, Iwata Y, Kitajima N, Higashimura H, Kubota M, Miyashita Y, Yamada Y, Okamoto K, Moro-Oka Y. Chem. Lett. 1999;8:739. [Google Scholar]
- 21.Fujisawa K, Kobayashi T, Fujita K, Kitajima N, Moro-oka Y, Miyashita Y, Yamada Y, K. O. Bull. Chem. Soc. Jpn. 2000;73:1797. [Google Scholar]
- 22.Pflugrath JW. CrystalClear Ver. 1.3. Acta Crystallogr. 1999;D55:1718. doi: 10.1107/s090744499900935x. [DOI] [PubMed] [Google Scholar]
- 23.CrystalStructure 3.70 and 3.81: Crystal Structure Analysis Package, Rigaku and Rigaku/MSC. 2006. 2005.
- 24.Watkin DJ, Prout CK, Carruthers JR, Betteridge PW. Chemical Crystallography Laboratory; Oxford, U. K.: 1996. Crystal Issue 10. [Google Scholar]
- 25.Altomare A, Cascarano G, Giacovazzo C, Guagliardi A, Burla M, Polidori G, Camalli M. J. Appl. Crystallogr. 1994;27:435. [Google Scholar]
- 26.Beurskens PT, Admiraal G, Beurskens G, Bosman WP, de Gelder R, Israel R, Smits JMM. The DIRDIF-99 program system, Technical Report of the Crystallography Laboratory. University of Nijmegen; The Netherlands: 1999. [Google Scholar]
- 27.Frisch MJ, et al. Gaussian 03. Revision C.02.
- 28.Becke AD. Phys. Rev. A. 1988;38:3098. doi: 10.1103/physreva.38.3098. [DOI] [PubMed] [Google Scholar]
- 29.Perdew JP. Phys. Rev. B. 1986;33:8822. doi: 10.1103/physrevb.33.8822. [DOI] [PubMed] [Google Scholar]
- 30.Schaefer A, Horn H, Ahlrichs R. J. Chem. Phys. 1992;97:2571. [Google Scholar]
- 31.Schaefer A, Huber C, Ahlrichs R. J. Chem. Phys. 1994;100:5829. [Google Scholar]
- 32.Casida ME, Jamorski C, Casida KC, Salahub DR. J. Chem. Phys. 1998;108:4439. [Google Scholar]
- 33.Becke AD. J. Chem. Phys. 1993;98:5648. [Google Scholar]
- 34.Miertus S, Scrocco E, Tomasi J. Chem. Phys. 1981;55:117. [Google Scholar]
- 35.Gorelsky SI. Swizard program. 2008.
- 36.Tenderholt AL. PyMolyze. Stanford: 2007. 2.0. [Google Scholar]
- 37.O’Boyle NM, Tenderholt AL, Langner KM. PyMolyze. J. Comput. Chem. 2008;29:839. doi: 10.1002/jcc.20823. [DOI] [PubMed] [Google Scholar]
- 38.Neese F, Solomon EI. Inorg. Chem. 1998;37:6568. doi: 10.1021/ic980948i. [DOI] [PubMed] [Google Scholar]
- 39.Neese F. J. Am. Chem. Soc. 2006;128:10213. doi: 10.1021/ja061798a. [DOI] [PubMed] [Google Scholar]
- 40.Randall DW, G.S. D, Hedman B, Hodgson KO, Fujisawa K, Solomon EI. J. Am. Chem. Soc. 2000;122:11620. [Google Scholar]
- 41.Jazdzewski BA, Holland PL, Pink M, Young VG, Jr., Spencer DJE, Tolman WB. Inorg. Chem. 2001;40:6097. doi: 10.1021/ic010615c. [DOI] [PubMed] [Google Scholar]
- 42.Que LJ. Biological applications of Raman Spectroscopy. Vol. 3. Wiley; New York: 1988. p. 491. [Google Scholar]
- 43.Cramer CJ, Tolman WB, Theopold KH, Rheingold AL. Proc. Nat. Acad. Sci. 2003;100:3635. doi: 10.1073/pnas.0535926100. [DOI] [PMC free article] [PubMed] [Google Scholar]
- 44.Ruggiero CE, Smith JA, Tanizawa K, Dooley DM. Biochem. 1997;36:1953. doi: 10.1021/bi9628836. [DOI] [PubMed] [Google Scholar]
- 45.DuBois JL, Klinman JP. Arch. Biochem. Biophys. 2005;433:255. doi: 10.1016/j.abb.2004.08.036. [DOI] [PubMed] [Google Scholar]
Associated Data
This section collects any data citations, data availability statements, or supplementary materials included in this article.