

Abstract
Nitrophorins are NO carrier proteins that transport and release NO through a pH dependent conformational change. They bind NO tightly in a low pH environment and release it in a higher pH environment. Experimental evidence shows that the increase in the NO dissociation equilibrium constant, Kd, is due mainly to an increase in the NO release rate. Structural and kinetic data strongly suggest that NPs control NO escape by modulating its migration from the active site to the solvent through a pH dependent conformational change. NP2 and NP4 are two representative proteins of the family displaying a 39% overall sequence identity and, interestingly, NP2 releases NO slower than NP4. The proposal that NPs' NO release relies mainly on the NO escape rate make NPs a very peculiar case among typical heme proteins. The connection between the pH dependent conformational change and ligand release mechanism is not fully understood and the structural basis for the pH induced structural transition and the different NO release patterns in NPs are unresolved, yet interesting issues. In this work we have used state of the art molecular dynamics simulations to study the NO escape process in NP2 and NP4 in both the low and high pH states. Our results show that both NPs modulate NO release by switching between a “closed” conformation in a low pH environment and an “open” conformation at higher pH. In both proteins the change is caused by the differential protonation of a common residue Asp30 in NP4 and Asp29 in NP2, and the NO escape route is conserved. Finally, our results show that in NP2, the conformational change to the “open” conformation is smaller than that for NP4 which results in a higher barrier for NO release.
Keywords: Nitrophorin, Nitric Oxide, Heme Protein, Molecular dynamics, Jarzynski, Chagas disease
Introduction
Heme proteins and small ligand binding
Heme proteins, the family of proteins containing an iron-porphyrin complex as a prosthetic group, are found in all living organisms.1-3 They perform a wide variety of tasks ranging from electron transport3,4 to oxidation of organic compounds-, and the sensing and transport of small ligands, namely O2, CO and NO.3,5 The regulation of ligand affinity is one of the key issues determining a heme protein's function. In most heme proteins, the active site consists of a cavity on top of the heme group known as the distal pocket. The affinity is experimentally characterized by the equilibrium constant Kd, determined by the ratio between the kinetic constants of the association and dissociation processes, kon/koff.6 The kon values in heme proteins depend essentially on the accessibility of the ligand to the active site, which is similar for the three ligands (L), since Fe-L bond formation typically has a minimal barrier.7,8 To facilitate these processes, many proteins have tunnels that connect the heme active site to the solvent.9 Typical values for association rates span a range of four orders of magnitude, starting at about 104 M−1s−1 in those systems with very low accessibility to the iron and rising to 108 M−1s−1 when the association rate is mainly controlled by the diffusion in the solvent.8 On the other hand, dissociation rate constants span a range of roughly seven orders of magnitude, from 10−3 s−1 to 104 s−1.3,8 The dissociation rate is determined by the rate of two processes, thermal breaking of the protein-ligand interactions, mainly the Fe-L bond, and ligand escape from the active site into the solvent. Different ligands present different partitioning of their behavior between diffusion and bond-breaking. The most frequently studied ligand, dioxygen, binds exclusively to ferrous (FeII) heme. Its dissociation rate constant is almost exclusively determined by the nature of the interaction between the O2 and the heme protein, which depends upon the strength of the iron-oxygen bond and on interactions involving the protein matrix, typically the H-bond interactions of the bound O2 ligand, which bears a significant negative density due to backdonation from the metal, with the surrounding distal amino acids. For CO, which is almost neutral, the dissociation is mostly dominated by Fe-CO bond breaking, and similarly low values (≈ 1×10⁻² s−1) are observed for many different heme proteins.10 Finally, NO is capable of interacting with both FeII and ferric (FeIII) heme proteins,11,12 to form the corresponding [FeNO]7 or [FeNO]6 nitrosyl complexes in the Enemark and Feltham notation.13 Although NO association rates are similar for both iron oxidation states, dissociation rates (koff) are completely different. FeII dissociation rate constants are around 1 ×10⁻⁴ s−1 14 which lead to very high equilibrium constants values of Keq ≈ 1011M−1.11,14 On the other hand, FeIII dissociation rates are larger and span a wide range from 0.1 to 40 s−1, giving rise to lower equilibrium values (Keq = 103-105 M−1) .11,14 The molecular basis (ligand-protein interaction or ligand migration) for these differences are mostly unknown. In many cases, however, they seem to be determined by the strength by which the protein binds to the ligand as evidenced by the heme proteins displaying similar values to those observed for isolated porphyrins. A review of these ideas can be found in Laverman et. al.11 Although from those three small ligands O2 affinity is the most studied, NO affinity regulation has been intensively studied in the last decade since this small molecule is responsible for diverse physiological functions in mammals, such as blood pressure regulation, neurotransmission and immune response among others.15,16 It is usually produced by the heme protein NO synthase (NOS),17,18 and its main physiological receptor is another heme protein, the soluble guanylate cyclase (sGC).19 Interestingly, NO is a highly reactive molecule capable of producing highly reactive nitrogen oxide species, heme oxidation/reduction11,20, and tyrosine21 and cysteine nitrations.22 How the NO physiological functions are accomplished while avoiding toxicity due to its high reactivity is still an open issue.
Nitrophorins, the NO carriers
Most blood-sucking insects possess salivary proteins which, upon injection in the victim tissue, improve feeding.23 One group of these salivary proteins takes advantage of the vasodilator properties of NO to perform this task. These proteins, nitrophorins (NPs),23 are heme proteins that store and transport NO, and once released in the victim's tissue enhance the blood flow due to vasodilator and blood coagulation inhibitory effects.24,25 The most extensively studied NPs are those obtained from the salivary glands of the kissing bug Rhodnius prolixus, an insect found in both South and North America. The insect is a vector for the parasite Trypanosoma cruzi, the causative agent of Chagas' Disease, or American Trypanosomiasis, with the capacity for transmitting it to humans. It is estimated that around 16 million people are infected with the disease. 26-28
Four Rhodnius prolixus NPs (NP1-4) have been cloned29 and characterized spectroscopically, kinetically6,30 and structurally.31-34 NO binds more strongly to the NPs than to most other heme proteins, with KeqII ≈ 1013 – 1014 M−1 and KeqIII ≈ 107–109 M−1 at pH 5.5 and somewhat smaller at pH 7.5. 35 It has been shown that all four NPs function by binding NO to the heme in a pH sensitive manner. NO is synthesized in the salivary glands by a typical NOS30 where it binds tightly to NP at a low pH of around 5. Once the NPs are injected into the victim's bloodstream, which has a pH of approximately 7.5, a conformational change occurs which lowers NO affinity, facilitating its release.6,36 The sequence and structural data shows that all four NPs have a conserved structure consisting of an eight–stranded, antiparallel β-barrel typical of the lipocalin family.37 The heme group is tightly buried in the barrel, where it contacts invariant residues Tyr140, Leu57, Phe68, Tyr105, Leu123, Leu133 and invariant heme proximal ligand His59 (using NP4 residue numbers).31-33,38 The heme end of the barrel is built by the four loops AB, CD, EF and GH. As expected for a NO transport protein, they bind and release NO in the FeIII state and are stable towards reductive nitrosylations.14
Based on the above mentioned data, a mechanism was proposed in which the binding and release process involves two steps. The first step is characterized by Fe-NO binding and Fe-NO thermal bond breaking. This is a pH independent step with corresponding kinetic constants k1 and k−1. The other step, characterized mainly by the kinetic constant koff, corresponds to pH-dependent observed release rate.
Using this analysis scheme, a 7- to 11-fold increase in the NO dissociation equilibrium constant Kd is observed as the pH increases from ≈5 to ≈7.5 due to an increase in the release rate koff. No pH dependence on k−1 was observed, so it was proposed that the Fe-NO bond breaking is not involved in pH regulation,6 an idea further supported by means of QM/MM simulations.39 Since no pH dependence was observed in the Fe-NO bond breaking process it is clear that NPs control NO escape by modulating its migration from the active site to the solvent through a pH dependent conformational change. Insight into the structural change comes from high resolution studies of NP4 (PDB codes 1X8N, 1X8O, 1X8P, and 1X8Q) showing a so called “open” state for AB and GH loops at higher pH and a “closed” AB, GH loop state at lower pH.38 Based on this structure, Asp30 is the key residue for triggering the pH dependent conformational change, a result corroborated by several theoretical studies.39-41 Furthermore, structural and kinetic studies on Asp30 mutants supported the connection between AB, GH loop movement and NO escape and its pH dependence in NP4.40
Although the four NPs are similar (38% overall sequence identity) they fall into two groups NP1/4 (90% identity) and NP2/3 (79% identity). A partial sequence comparison between NP4 and NP2 can be seen in Figure 1.
Figure 1.

Sequence alignment between NP2 and NP4, highlighting the key similarities in red
The two groups also display different NO release rates. NP1/4 have a dissociation constant of Kd = 0.54 μM, due to a koff value of about 2.6 s−1, whereas NP2/3 have Kd = 0.02 μM due to lower koff values (around 0.12 s−1).6 The physiological implication is that NO is released first from NP1/4, and later from NP2/3 at a slower rate, which ensures continuous blood flow for a longer period. The molecular basis for the different NO release patterns in NPs is not yet understood.
The proposal that NPs' NO release relies mainly on the NO escape rate make NPs a very peculiar case among typical heme proteins. Furthermore, the connection between the pH dependent conformational change and ligand release mechanism is not fully understood. Finally, the structural basis for the pH induced structural transition is an interesting unresolved issue by itself.
Theoretical methods for the study of ligand migration
Understanding the structural mechanism and the underlying thermodynamics of ligand migration in proteins requires tools capable of probing molecular structure in the picosecond time scale. Experimentally this can be done using temperature and time resolved infrared spectroscopy of photolyzed CO. This technique, however, lacks atomistic detail. Another approach is based in the use of time resolved CO photolyzed or high Xenon pressure X-ray crystallography. While these methods can reveal possible ligand migration pathways, they are unable to estimate their respective free energy barriers. Molecular dynamics provides an effective tool for the investigation of cavities and the associated ligand migration mechanism within the protein matrix because it can provide accurate free energies of the ligand migration process with structurally atomistic detail.
Although standard molecular dynamics at the nanosecond time scale are not able to provide a complete picture of the ligand migration process, this difficulty can be overcome by the use of different methods to enhance sampling at an affordable computational cost. In recent years, several schemes have been developed to study small ligand migration in an effort to generate accurate results at reduced computational cost. Activated molecular dynamics, for example, is a scheme in which the ligand is assigned a higher temperature than the rest of the system,42 and it was successfully employed to investigate water and hydrogen peroxide migration in catalase. Another enhanced sampling technique is based on the use of multiple independent ligand replicas on a single trajectory of the protein.43-45 Drawbacks to this approach include the fact that specific information about protein-ligand interaction is lost in the average and the cavity volume is overestimated due to the presence of multiple ligands. More recently, approaches for computing the probability of finding a ligand molecule inside the protein matrix using a series of snapshots taken from standard MD simulations of the protein were developed and used to study ligand migration in myoglobin (Mb).46,47 These approaches present a complete thermodynamic view of the protein tunnel/cavity system, and were able to successfully identify several ligand migration channels in Mb in accordance with the experimentally determined Xenon site and ligand binding studies of Mb mutants.
Finally, it is possible to model activated processes such as ligand migration through the protein matrix by means of multiple steering molecular dynamics (MSMD) schemes.46,48 This technique is specially suited to calculate free energy barriers that ligands must overcome. In practice, several (≈10) different MD simulations are performed, where the ligand is pushed from the proteins active site towards the solvent by means of an external guiding potential. For each SMD simulation the irreversible work performed by the guiding potential is measured along the ligand migration path. The free energy is obtained by computing the exponential average of the work values as described by Jarzynski's inequality (See the Methods section for details). In this work we have compared the free energy profile of NO escape from Nitrophorin 2 and Nitrophorin 4 at the low pH = 5 and high pH = 7 conformations.
Computational Methods
System set-up and equilibration
The initial structure for the NP4 MD simulations were built starting from the crystal structures of NO bound NP4 (pH=5.6) PDB code 1X8O, and NH3 bound NP4 (pH=7.4) PDB code 1X8P.33,38,40,49 These structures present the closed low pH and open high pH conformation of AB and GH loops respectively. Special attention was paid to the protonation state of the titratable residues. The protonation state was assigned as suggested from previous experimental 38 and theoretical41 works. In short, the only difference in the protonation state was assigned to Asp30, which was protonated at low pH and charged at high pH. We have already shown that with this setup, the AB and GH loops in the simulated protein retain their experimentally observed conformations.
The PDB codes 1EU0 and 2AL0 were used as starting structures for the open and closed (high pH and low pH) conformations, crystallized at pH 7.7 and 6.5, respectively.32 The assignment of protonation states is described below and was done using our own implementation of Replica Exchange Molecular Dynamics at constant pH.
To set up the systems for the MD simulations, the above mentioned structures were immersed in a pre-equilibrated octahedral box of TIP3P water molecules. All simulations were performed at 1 atm and 300K, maintained with the Berendsen barostat and thermostat,50,51 using periodic boundary conditions and Ewald sums (grid spacing of 1 Å) for treating long range electrostatic interactions. The SHAKE algorithm was used to keep bonds involving H atoms at their equilibrium length.52 A 2 fs time step for the integration of Newton's equations was used. The Amber ff99SB53 force field parameters were used for all residues, except the heme. The heme parameters used in this work were developed and thoroughly tested by our group in previous work.3,54 All simulations were performed with the PMEMD module of the AMBER9 suite.53,55 Equilibration protocols consisted of performing an optimization of the initial structures, followed by slow heating to the desired temperature. The heating is performed in 200 ps at constant volume MD, followed by 200 ps MD at constant pressure. Once the system is equilibrated, the different production MD runs are performed. Frames were collected at 1 ps intervals, which were subsequently used to analyze the trajectories.
Constant pH Replica Exchange Molecular Dynamics
To validate the choice of titratable residues in NP2, constant pH replica exchange molecular dynamics (REMD) was run with Asp29 and Asp131 titratable. The constant pH REMD method combines REMD methodology56 and constant pH molecular dynamics developed by Mongan et al57. In their constant pH molecular dynamics method, protonation states are sampled by the Monte Carlo (MC) method periodically during a MD simulation. At each MC step, a titratable site and a new protonation state for that site are chosen randomly. The transition free energy is computed and Metropolis criteria 58 are used to evaluate that protonation state transition. In our constant pH REMD model, replicas travel in temperature space while the pH value is kept the same for all replicas. Only protein structures will be attempted to exchange at the REMD Monte Carlo jumps. The protonation states of a replica are the same before and after an exchange attempt.
Two simulations were performed, one at pH 5.6 and the other at pH 7.4. Both simulations were performed with four replicas at temperatures 280 K, 300 K, 320 K, and 350 K with exchange attempts every 1 ps. The simulation was run for 1.1 ns, though the data is compiled for only the last nanosecond. OBC Generalized Born implicit solvent model59 was used to model water environment in all both calculations. The Berendsen thermostat50, with a relaxation time of 2 ps, was used to keep the replica temperatures around their target values. Salt concentration (Debye-Huckel based) was set at 0.1 M. The cutoff for nonbonded interaction and Born radii was 30 Å. The Henderson-Hasselbalch (HH) equation is used to calculate pKa for each titratable site after each constant pH REMD run.
Multiple Steering Molecular Dynamics
To obtain the free energy profiles for NO escape we used the multiple steering molecular dynamics (MSMD) approach as originally proposed by Jarzynski.48 This methodology is based on the following relation between the non-equilibrium dynamics and equilibrium properties,
| (5) |
where W(ξ) is the external work performed on the system as it evolves from the initial to the final state along the reaction coordinate ξ. In MSMD the original potential is modified by a time-dependent external potential, usually harmonic, that moves the system along the reaction coordinate by varying the potential well according to
| (6) |
where “ν” is a pulling speed that moves the system along the reaction coordinate.
The free energy profile along the selected reaction coordinate, “ξ,” is obtained by performing several MSMD runs, collecting the work done at each time step, and then properly averaging it per Jarzynski's equation 60-63. Twenty SMD simulations were performed for NP4 and 17 for NP2. Usually, the pulling speed is chosen so that the system moves smoothly, but faster than in a true reversible simulation. In the present study, the reaction coordinate was chosen as the Fe-N distance. Calculations were performed using harmonic force constants (k) of 200 kcal mol−1 Å−1 and 300 kcal mol−1 Å−1 and pulling velocities (ν) of 0.01 Å/ps and 0.06 Å/ps for NP4 and NP2, respectively.
Results
Nitrophorin 4 pH dependent structure, dynamics and NO release
Structural comparison of NP4 in the low and high pH states
We started our analysis by comparing the structure and dynamics of NP4 simulated at both pH conditions, from now on termed low pH and high pH simulations. The Cα-RMSD vs. time plot shows that although both structures remain stable in the high pH simulation larger deviations from the initial structure are observed. The corresponding mean Cα-RMSD values are 1.25 Å and 1.86 Å for the low and high pH simulations respectively. To further compare both states structurally, we computed the average structure of the last 40ns of both simulations and compared them to each other.
As can be seen from Figure 2, the differences between the low and high pH structures for NP4 are highly localized in very small segments, which correspond mainly to loop regions. These differences are consistent with those observed in the X-ray structures.33 The most relevant differences are observed for residues located in the AB, CD, GH and α2α3 loops, which are all localized in the heme end of the β-barrel structure.
Figure 2.
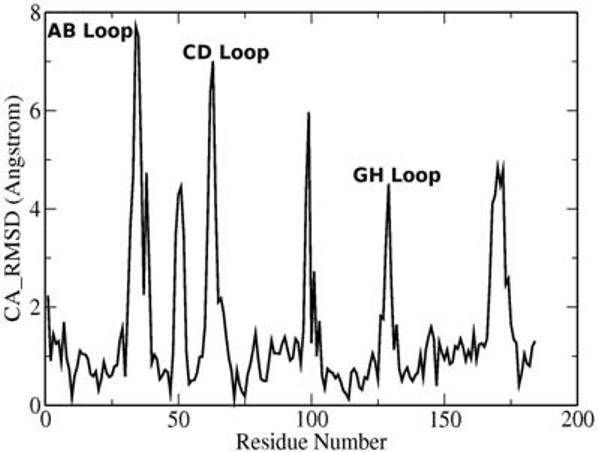
Cα-RMSD vs. residue plot between the low and high pH average structures for NP4.
Closer inspection of both structures shows that several key residue-residue interactions define and characterize each conformational state of the loops. (Table 1) One of these critical interactions is between the Asp30 (located in the AB loop) and Leu130 (in the GH loop). At low pH, Asp30 is protonated and forms a tight hydrogen bond (HB) with the carbonyl of Leu130. When the pH is increased and Asp30 becomes charged, the HB is broken, and it moves into the solvent. This promotes a Leu130 rotation, and its carbonyl forms a strong HB with the NH3+ moiety of Ala1. This differential interaction is maintained throughout the entire simulation. The other key residue in the AB loop is Asp35. At low pH, Asp35 and Asp129 interact in such a way that Asp35 is buried in the protein, bringing the AB and GH loops together, effectively closing the NO escape path. At high pH Asp35 becomes charged and fully solvated and maintains the open conformation of the AB loop.
Table 1.
Average distance (Angstroms) during the MD simulations for the characteristic interactions in NP4
| Interaction | pH5 | pH7 |
|---|---|---|
| Leu130-Asp30 | 1.8 | 9.6 |
| Leu130-Ala1 | 6.6 | 2.9 |
| Asp129- Asp35 | 7.4 | 13.2 |
| Val36-HemeCD | 2.0 | 9.0 |
| Leu133-Val36 | 5.5 | 9.0 |
Free energy of NO release in NP4
To structurally characterize the NO escape mechanism in both states and to obtain a reliable estimation of NO escape probability at both pH conditions, we performed MSMD simulations of NO release for each pH condition. We chose the Fe-N distance as the reaction coordinate (RC) without any angular restraints in order to allow NO to explore any possible path out of the protein. As mentioned in the methods section, the MSMD scheme allows us not only to compute the free energy profile for NO migration out of NP4, but by looking at the dynamics with low work values we can analyze the NO path at a molecular level. As an example, Figure 3 shows the position of the NO molecule along one selected SMD run for each case.
Figure 3.

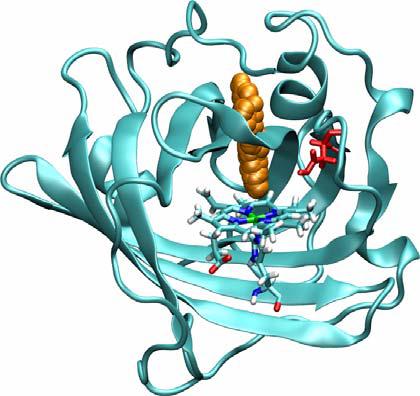
NO location in NP4 along a selected SMD run. A) High pH situation. B) low pH condition. NO positions are shown as orange spheres, Protein is shown as blue ribbons, Heme group, proximal histidine are shown as sticks. Asp30 is shown in red sticks Leu 123, leu130, Leu133, Val36 and Pro37 are shown as yellow sticks.
In the high pH condition, as expected, NO escapes from NP4 in all of the MSMD runs. Along the way out the NO molecules passes next to Leu133 and Leu130 towards Val36. Then it passes between the CD side of the heme and Val36-Pro37 to finally enter the solvent. In the low pH condition the results are completely different. Visual inspection of these runs shows that in 11 of these runs, NO does not escape but instead migrates deep into the protein matrix. In the 9 remaining SMD runs NO actually manages to escape but only by overcoming high barriers. Moreover, in only two runs does NO escape via a path that is similar to the one in the high pH conformation. Detailed inspection of the SMD simulations allows us to understand why NO is unable to escape in the low pH state. As shown in Figure3, in the low pH state Leu130 and Leu133 are both blocking the escape route. Furthermore, as seen in Table 2, there is no space for NO to pass between Leu133 and Val36 or Val36 and the CD side of the heme, clearly showing how the AB and GH loop closure prevents NO escape.
Table 2.
Average distance (Å) during the simulation for characteristic interactions, comparing several interactions with those present in NP4
| Residues | Low pH Distance (Å) | High pH Distance (Å) |
|---|---|---|
| Leu129-Asp29 | 7.7 | 6.7 |
| Val34-HemCD | 6.2 | 7.5 |
| Leu132-Val34 | 6 | 6 |
| Leu132-Asp29 | 5.2 | 6.5 |
| Asp29-HemFe | 8.7 | 10.7 |
Figure 4 shows the corresponding work vs. RC profiles obtained form the SMD runs at high pH. As can be seen they present a barrier distribution ranging from 2 kcal/mol up to 10 kcal/mol) yielding a free energy profile with a barrier of around 3 kcal/mol, as shown in Figure 4. Using these 9 SMD runs in the low pH condition where NO escapes an estimation of the free energy for ligand escape can be obtained and compared with that obtained at high pH, as is also shown in Figure 4.
Figure 4.

a) Work vs. RC profiles for the SMD runs in the high pH state b) Free energy profiles for NO escape from NP4. Results for the high pH and low pH structures are depicted using black and red lines, respectively. In the high pH profile the data corresponds to mean ± SD of two independent 10 MSMD sets of calculations.
The results shown in Figure 4 corroborate that NO easily escapes from NP4 when it is in the high pH conformation, and that the protein closes and blocks the way in low pH conditions. In the low pH conformation the barrier for NO escape is too high, and when the NO is pushed away from the iron it prefers to move deeper inside the protein matrix. Interestingly, there is a tight connection between the key residues responsible for the pH dependent conformational change and those defining the NO escape probability, namely Asp30 and Leu130. At high pH, Asp30 and Leu130 separate, opening a passage in the protein by which NO can escape.
Role of water in NO release in NP4
Another interesting point in NP4 differing NO escape rates is the role played by water molecules. In the work by Nienhaus et. al. (JBC 04) it was suggested that in the low pH condition ligand escape is difficult because the reactive heme iron has missing secondary ligand sites. On the other hand, in the high pH condition, ligand escape is partially facilitated by the blockage of the iron active site by waters which hinder NO reassociation. Our results for both conditions agree with the lack of secondary docking sites, a fact also reflected in the lack of secondary minima in the free energy profiles. To address the water contribution to the NO escape mechanism we studied the presence of waters near the NO under both pH conditions.
The normalized histogram of the water distance to the iron, shown in Figure 6, was generated by tabulating the distance of the oxygen atoms on the 10 closest water molecules to the iron atom. Figure 6 shows that in the high pH conformation water comes closer to the iron, as the mean Fe-Owat distance is 5Å in high pH conformation and 7Å at low pH. Moreover, Figure 5 shows that for the low pH state only a small cluster of waters is found inside the protein active site. The cluster is located at about 7Å from the heme iron close to the Leu120 and Leu130 backbone. In the high pH state water is much more abundant and closer to the Fe-NO group, forming a large cluster located towards the described NO escape route. The data strongly suggests that in the high pH conformation water is more abundant and closer to the iron, and therefore it is very likely that they will displace the NO ligand more easily in this state.
Figure 6.
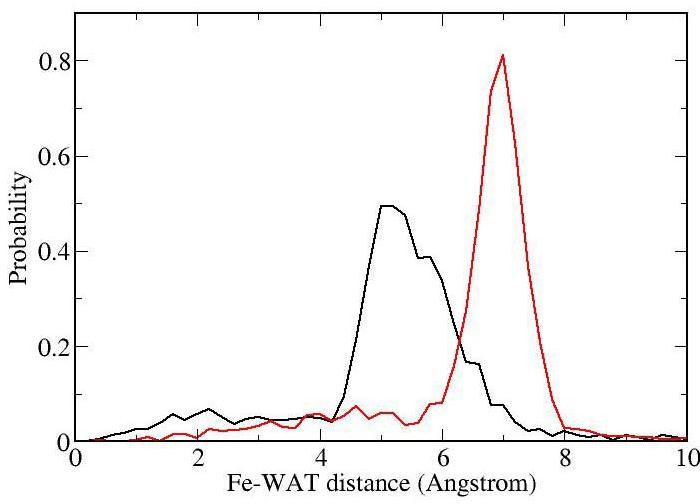
Normalized histogram of the Fe-Owat distance for the 10 closest water molecules in NP4. The low and high pH distributions are indicated in red and black, respectively.
Figure 5.

water localization in NP4-NO for the Low and High pH conformations
In order to analyze the role of the water molecules in the NO release process, we measured the Fe-Owat distance for the closest water during the NO release process modeled through MSMD at both pH conditions. Two representative plots for each condition are shown in Figure 7.
Figure 7.

Fe-wat distance as function of time for NO escape simulations. The low and high pH states are indicated by red and black, respectively.
As can be seen from Figure 7 water does not come close to the iron throughout the MSMD simulation in the low pH state. Only in one of the two sets shown does one water come close at 0.9 ns when the NO is about 10Å removed from the iron. Comparatively, in the high pH water comes close to the iron rapidly (at about 0.3 ns) when the NO is only 5Å away from the heme. A similar pattern is observed for most of the sets. The results presented for the analysis of the role of water in NO escape are in agreement with the suggestion by Nienhaus et. al. and demonstrate the key involvement of the solvent in the NO escape process. In this view the closed conformation of the low pH state plays two roles. It prevents direct NO escape and shields water's entry, prohibiting it from competing with the NO ligand for the reactive iron.
Nitrophorin 2 pH dependent structure, dynamics and NO release
Assessment of titratable residue protonation states
Unlike NP4, the available structures for NP2 did not make the choice of titratable residues straightforward, and no prior studies on this subject or mutation analysis is available. The PDB codes 1EU0 and 2AL0 were used as starting structures for the open and closed (high pH and low pH) conformations, crystallized at pH 7.7 and 6.5, respectively.32 By drawing analogies to NP4, Asp29 and Asp131 were chosen as possible titratable residues in NP2. These choices were validated through constant pH REMD simulations to determine the pKa values of each residue in both conformations. For Asp131, the unprotonated fraction at both pH 5.6 and 7.4 are over 99%, which indicates the pKa of Asp131 is much lower than 5.6 meaning that Asp131 is not a titratable residue in NP2 at pH 5.6 or 7.4. The calculated pKa value for Asp29 is 5.7. This means that Asp29 is unprotonated but also shows some significantly populated protonation fraction at pH 5.6. We can clearly see the difference in protonation when the pH values change from 5.6 to 7.4. The pKa predictions by constant pH REMD simulations suggest that Asp29 was a good choice as a titratable residue.
Structural comparison of NP2 in the low and high pH states
As with NP4, we begin the analysis of NP2 by comparing the MD simulations of NP2 in the low and high pH states. To compare both states directly, we compared the average structures as shown in Figure 8.
Figure 8.

a) Difference between average high and low pH structure shown by residue. b) Average structures of the low and high pH structures superimposed upon each other in red and blue, respectively.
Figure 8 shows that in NP2 the differences between the two structures are located mainly in the GH loop, with minor differences in the AB and EF loops. Interestingly the changes are of a much smaller magnitude as those observed for NP4 (shown in Figure 2). Closer inspection of the MD simulation data shows that the most important difference between the high and low pH structures is Asp29, which is protonated in the low pH model and deprotonated in the high pH model. The difference in the orientation of this residue is visible through comparison of its χ1 dihedral values between the two conformations. The average values for this angle are 74° and −167° for the high and low pH structures, respectively. In the low pH structure, the residue is buried, blocking a possible low energy escape pathway for NO. In the high pH structure, the residue rotates into the solvent, allowing NO migration through the newly formed channel.
Free energy of NO release in NP2
In order to further analyze both NP2 states and to evaluate for each case the NO escape probability, we performed 17 MSMD of NO escape for each case in a manner analogous to what was done for NP4. The corresponding work and free energy profiles for each pH state are shown in Figures 9 and 10, respectively.
Figure 9.

Work vs RC profiles for the low (right panel) and high pH (left panel) MSMD runs for NP2
Figure 10.

Free energy profiles. (left panel). Low and high pH profiles are depicted with red and black lines, respectively. NO escape path in NP2 high pH state. (right panel) The protein is shown in light blue ribbons, and the escaping NO as yellow spheres.
Detailed analysis of the trajectory followed by NO in the high pH state for the low barrier simulations shows that once NO is free from the iron, residues Ile120, Leu132, and Leu122 prevent NO from traveling further into the protein, and force it towards the end of the barrel and outside of the protein. To completely escape the protein, the NO passes by residues Gln33, Thr35, and Glu124, which open up to allow passage of the NO, which corresponds to the highest energy position (distance = 9.6 Å, barrier ∼ 6.5 kcal/mol) along the path. One representative path of NO escape is shown in Figure 10.
The low pH simulations show completely different work profiles, displaying a free energy barrier that prevents NO escape. Visual inspection of low pH SMD shows that from the beginning, NO is unable to pass by residues Leu122 and Asp29 so the NO molecule is pushed through the top of the protein, but it is unable to diffuse out due to the very high barrier (Figure 11).
Figure 11.
NO escape path in a representative low pH SMD simulation
Role of water in Nitrophorin 2 NO escape
Water plays a far less pronounced role in NP2's activity. All of the analyses performed on NP4 were also done for NP2, and none of them showed definitive trends specific to one conformation of the protein. Water presence in both the high and low pH conformations was smaller than that in the low pH structure of NP4, but more importantly neither one was statistically different from the other one. Analyzing the water presence in the distal pocket during the MSMD showed that the free energy of escape for open state of NP2 is not stabilized by water. This result agrees with experimental evidence, as well as other results of this investigation, that NP4 more efficiently releases NO than does NP2.
Discussion
Nitrophorins are NO carrier proteins that transport and release NO through a pH dependent conformational change. They bind NO tightly at the low pH in the environment of the insects' salivary glands and release it in the higher pH environment of their victim's bloodstream. NP2 and NP4 are two representative proteins of the family displaying a 38% overall sequence identity that share a common β-barrel fold. Our results show that both NPs perform this task by switching between a “closed” conformation in a low pH environment and an “open” conformation at higher pH. From a global view, in the closed conformation the loops (mainly the AB and GH loops) at the heme side of the barrel are collapsed like flaps upon the heme. This is especially clear in NP4. In this conformation, the tight packing of the side chains of hydrophobic residues Leu133, Leu130, Val36, and Pro37 on both loops plus the buried, now neutral aspartic acid residue (30 in NP4 and 29 in NP2) block the NO escape route. These loops open in the high pH conformation as the tightly packed hydrophobic network is destabilized, thereby forming a hydrophobic escape path for NO. This conformational change is driven, in part, by the loss of key interactions by deprotonated residues (such as Asp30-Leu130 in NP4 and Asp29-Leu132 in NP2) and the solvation of the newly charged aspartic acid.
The results presented in this work also allow us to compare NP2 and NP4. The results from the low to high pH RMSD vs. residue plot for both proteins (Figures 5 and 2) show that the conformational change is far more pronounced in NP4 compared to NP2. In NP4, each loop, AB, CD, GH and the α2α3 loops, moves more than 5 Å between both states. On the other hand, in NP2 only the GH loop moves significantly and to a lesser extent (about 3Å) and is only accompanied by a small movement of the AB and EF loops. It is clear that the conformational change in NP2 is more subtle than that observed for NP4 by simply comparing the similarities between the four different structures (high and low pH for NP2 and NP4). Table 3 compares the RMSD values between all four structures showing that each NP2 structure more closely resembles itself than either of the NP4 structures. Additionally, of the two NP4 structures, each NP2 structure aligns more closely to the closed structure. This suggests that the ‘open’ structure for NP4 is far more ‘open’ than its NP2 analog, a result corroborated by the increased free energy of NO escape in NP2 with respect to NP4.
Table 3.
RMSD matrix for the average structures NP2 and NP4 in high and low pH
| NP2 Low pH | NP2 Hi gh pH | NP4 Low pH | NP4 Hi gh pH | |
|---|---|---|---|---|
| NP2 Low pH | --- | 0.98 | 1.91 | 2.35 |
| NP2 High pH | --- | --- | 1.63 | 2.1 |
| NP4 Low pH | --- | --- | --- | 1.86 |
| NP4 High pH | --- | --- | --- | --- |
Interestingly the two proteins show a very similar NO escape path, lined by several conserved residues, namely Leu123, Tyr105, Leu130, and Asp30. Furthermore, our results show that in both proteins the titratable aspartic acid is the key element that controls not only the pH-dependent conformational change but also the NO escape directly. Taken altogether, these results show that the NO escape path and the molecular basis for the pH-dependent structural transition is conserved among NPs, but that control of the magnitude in the conformational changes regulate their differences. As mentioned in the introduction, while NP1/4 have a high pH koff value of about 2.6 s−1, NP2/3 have a high pH koff value of about 0.12 s−1.6 Our results are in accordance with these data since the barrier for NO release in the high pH state is smaller in NP4 compared to NP2 (≈3 kcal/mol to ≈6.5 kcal/mol, respectively). The molecular basis for this difference seems to lie in the magnitude of the conformational change; in NP2 the transition from closed to open is small which results in a high pH state that is less “open” compared to NP4.
As previously mentioned, the proposal that the pH-dependent NO release mechanism of the NP proteins operates by regulating the dynamical NO migration barrier rather than breaking the Fe-N bond makes NPs a very peculiar case among typical heme proteins. Why NPs evolved this type of regulation for ligand release is an interesting issue, that perhaps results from the combination of a biological necessity (ligand release regulation) with the proteins' physical and chemical properties that control the process. In the paradigmatic protein of ligand affinity regulation through a conformational transition, human tetrameric hemoglobin (Hb), the differential oxygen affinities of the high avidity R-state and the low affinity T-state are modulated by subtle modifications of the proximal and distal ligand environments which mainly affect the bound oxygen protein interactions, modifying the release rate (koff) between 10-100 times.64-66 A possible explanation as to why a different mechanism operates in NPs may rely on the chemical nature of the ligand. Oxygen, as a heme ligand, is very sensitive to the distal and proximal environments; small changes are able to induce significant increases or decreases in the oxygen binding energy and therefore the release rate. This does not seem to be the case for NO binding to Fe III, however.39 Thus, unable to chemically regulate NO binding affinity, NPs evolved a different mechanism that depends on the rate at which the ligand can escape from the protein matrix. From a more general viewpoint, regulation of ligand release by means of controlling the migration path should be independent of the small ligand nature for NO, CO or O2. Thus, more examples are expected to appear that operate by this mechanism. In globins, nevertheless, ligand migration regulation has been mainly related with the association process. The results for NPs strongly suggest that ligand release can be significantly and subtly tuned by controlling ligand migration, as well.
Conclusions
While NP2 and NP4 display strong structural similarities, they also possess distinct differences that are expressed through their respective mechanisms. Both proteins control NO escape by conformational changes caused by the differential protonation of a common residue in high and low pH conditions, Asp30 in NP4 and Asp29 in NP2. However, the conformational changes associated with the protonation state of this residue are far more exaggerated in NP4 than in NP2. Results of the NP4 simulations show a very pronounced conformational change with RMSD values for key residues reaching average values as high as 8 Å between the two states, while the corresponding variation in NP2 is limited to 3 Å. Comparison of the NP2 structures with both NP4 structures shows that NP2 does not open to the extent that NP4 does, since both conformations have a lower average RMSD with the closed state NP4 structure. This, in addition to the results of the MSMD simulations and resulting free energy profiles, suggests a slower rate of NO release in NP2 than in NP4. Seven of the 17 MSMD simulations in the high pH state for NP2 were forced through the protein matrix over a high barrier, suggesting that the escape path in NP2 is smaller and less readily accessible than its NP4 counterpart. These results are in direct agreement with experimental data that show a slower NO release rate for NP2 than for NP4. By utilizing each member of the NP family, insects such as the kissing bug are better suited for obtaining a more filling meal, as the different release rates ensure a continuous supply of NO to the bloodstream of their victim.
Scheme 1.

Acknowledgements
Computer resources were provided by the Large Allocations Resource Committee through grant TG-MCA05S010 to AER and by the University of Florida High-Performance Computing Center. This work was funded by NIH grant 1R01AI073674-01. AER wishes to thank the Fulbright foundation for a senior international fellowship to start this work. JMS thanks NSF for an international REU fellowship. This work was supported by grants of ANPCyT (National Science Agency of Argentina), CONICET, University of Buenos Aires and by a fellowship of the J. S. Guggenheim Foundation to D.A.E. MAM and DAE are members of CONICET
References
- 1.Kadish KM, Smith KM, Guilard R. 2000.
- 2.Kundu S, Trent JT, Hargrove MS. Trends in Plant Science. 2003;8:387–393. doi: 10.1016/S1360-1385(03)00163-8. [DOI] [PubMed] [Google Scholar]
- 3.Marti MA, Crespo A, Capece L, Boechi L, Bikiel DE, Scherlis DA, Estrin DA. J Inorg Biochem. 2006;100:761–70. doi: 10.1016/j.jinorgbio.2005.12.009. [DOI] [PubMed] [Google Scholar]
- 4.Simonneaux G, Bondon A. Chemical Reviews. 2005;105:2627–2646. doi: 10.1021/cr030731s. [DOI] [PubMed] [Google Scholar]
- 5.Jain R, Chan MK. Journal of Biological Inorganic Chemistry. 2003;8:1–11. doi: 10.1007/s00775-002-0405-8. [DOI] [PubMed] [Google Scholar]
- 6.Andersen JF, Ding XD, Balfour C, Shokhireva TK, Champagne DE, Walker FA, Montfort WR. Biochemistry. 2000;39:10118–10131. doi: 10.1021/bi000766b. [DOI] [PubMed] [Google Scholar]
- 7.Franzen S. Proceedings of the National Academy of Sciences of the United States of America. 2002;99:16754–16759. doi: 10.1073/pnas.252590999. [DOI] [PMC free article] [PubMed] [Google Scholar]
- 8.Scott EE, Gibson QH, Olson JS. Journal of Biological Chemistry. 2001;276:5177–5188. doi: 10.1074/jbc.M008282200. [DOI] [PubMed] [Google Scholar]
- 9.Bidon-Chanal A, Marti MA, Crespo A, Milani M, Orozco M, Bolognesi M, Luque FJ, Estrin DA. Proteins-Structure Function and Bioinformatics. 2006;64:457–464. doi: 10.1002/prot.21004. [DOI] [PubMed] [Google Scholar]
- 10.Phillips GN, Teodoro ML, Li TS, Smith B, Olson JS. Journal of Physical Chemistry B. 1999;103:8817–8829. [Google Scholar]
- 11.Laverman LE, Ford PC. Journal of the American Chemical Society. 2001;123:11614–11622. doi: 10.1021/ja0113910. [DOI] [PubMed] [Google Scholar]
- 12.Sharma VS, Traylor TG, Gardiner R, Mizukami H. Biochemistry. 1987;26:3837–3843. doi: 10.1021/bi00387a015. [DOI] [PubMed] [Google Scholar]
- 13.Enemark JH, Feltham RD. Coordination Chemistry Reviews. 1974;13:339–406. [Google Scholar]
- 14.Walker FA. J Inorg Biochem. 2005;99:216–36. doi: 10.1016/j.jinorgbio.2004.10.009. [DOI] [PubMed] [Google Scholar]
- 15.Moncada S, Palmer RMJ, Higgs EA. Pharmacological Reviews. 1991;43:109–142. [PubMed] [Google Scholar]
- 16.Palmer RMJ, Ferrige AG, Moncada S. Nature. 1987;327:524–526. doi: 10.1038/327524a0. [DOI] [PubMed] [Google Scholar]
- 17.Alderton WK, Cooper CE, Knowles RG. Biochemical Journal. 2001;357:593–615. doi: 10.1042/0264-6021:3570593. [DOI] [PMC free article] [PubMed] [Google Scholar]
- 18.Marletta MA. Journal of Biological Chemistry. 1993;268:12231–12234. [PubMed] [Google Scholar]
- 19.Denninger JW, Marletta MA. Biochimica Et Biophysica Acta-Bioenergetics. 1999;1411:334–350. doi: 10.1016/s0005-2728(99)00024-9. [DOI] [PubMed] [Google Scholar]
- 20.Ford PC, Fernandez BO, Lim MD. Chemical Reviews. 2005;105:2439–2455. doi: 10.1021/cr0307289. [DOI] [PubMed] [Google Scholar]
- 21.Radi R. Proceedings of the National Academy of Sciences of the United States of America. 2004;101:4003–4008. doi: 10.1073/pnas.0307446101. [DOI] [PMC free article] [PubMed] [Google Scholar]
- 22.Forman HJ, Torres M, Fukuto J. Molecular and Cellular Biochemistry. 2002;234:49–62. [PubMed] [Google Scholar]
- 23.Montfort WR, Weichsel A, Andersen JF. Biochimica et Biophysica Acta - Protein Structure and Molecular Enzymology. 2000;1482:110–118. doi: 10.1016/s0167-4838(00)00165-5. [DOI] [PubMed] [Google Scholar]
- 24.Ascenzi P, Nardini M, Bolognesi M, Montfort WR. Biochemistry and Molecular Biology Education. 2002;30:68–71. [Google Scholar]
- 25.Ribeiro JMC, Hazzard JMH, Nussenzveig RH, Champagne DE, Walker FA. Science. 1993;260:539–541. doi: 10.1126/science.8386393. [DOI] [PubMed] [Google Scholar]
- 26.Beard CB, Pye G, Steurer FJ, Rodriguez R, Campman R, Peterson AT, Ramsey J, Wirtz RA, Robinson LE. Emerging Infectious Diseases. 2003;9:103–105. doi: 10.3201/eid0901.020217. [DOI] [PMC free article] [PubMed] [Google Scholar]
- 27.Kirchhoff LV. New England Journal of Medicine. 1993;329:639–644. doi: 10.1056/NEJM199308263290909. [DOI] [PubMed] [Google Scholar]
- 28.Rassi A, Rassi A, Little WC. Clinical Cardiology. 2000;23:883–889. doi: 10.1002/clc.4960231205. [DOI] [PMC free article] [PubMed] [Google Scholar]
- 29.Champagne DE, Nussenzveig RH, Ribeiro JMC. Journal of Biological Chemistry. 1995;270:8691–8695. doi: 10.1074/jbc.270.15.8691. [DOI] [PubMed] [Google Scholar]
- 30.Ribeiro JMC, Nussenzveig RH. FEBS Letters. 1993;330:165–168. doi: 10.1016/0014-5793(93)80265-v. [DOI] [PubMed] [Google Scholar]
- 31.Andersen JF, Champagne DE, Weichsel A, Ribeiro JMC, Balfour CA, Dress V, Montfort WR. Biochemistry. 1997;36:4423–4428. doi: 10.1021/bi9628883. [DOI] [PubMed] [Google Scholar]
- 32.Andersen JF, Montfort WR. Journal of Biological Chemistry. 2000;275:30496–30503. doi: 10.1074/jbc.M002857200. [DOI] [PubMed] [Google Scholar]
- 33.Andersen JF, Weichsel A, Balfour CA, Champagne DE, Montfort WR. Structure. 1998;6:1315–1327. doi: 10.1016/s0969-2126(98)00131-2. [DOI] [PubMed] [Google Scholar]
- 34.Weichsel A, Andersen JF, Champagne DE, Walker FA, Montfort WR. Nature Structural Biology. 1998;5:304–309. doi: 10.1038/nsb0498-304. [DOI] [PubMed] [Google Scholar]
- 35.Berry RE, Ding XD, Shokhireva TK, Weichsel A, Montfort WR, Walker FA. Journal of Biological Inorganic Chemistry. 2004;9:135–144. doi: 10.1007/s00775-003-0505-0. [DOI] [PubMed] [Google Scholar]
- 36.Weichsel A, Andersen JF, Roberts SA, Montfort WR. Nature Structural Biology. 2000;7:551–554. doi: 10.1038/76769. [DOI] [PubMed] [Google Scholar]
- 37.Flower DR, North ACT, Sansom CE. Biochimica et Biophysica Acta - Protein Structure and Molecular Enzymology. 2000;1482:9–24. doi: 10.1016/s0167-4838(00)00148-5. [DOI] [PubMed] [Google Scholar]
- 38.Kondrashov DA, Roberts SA, Weichsel A, Montfort WR. Biochemistry. 2004;43:13637–13647. doi: 10.1021/bi0483155. [DOI] [PubMed] [Google Scholar]
- 39.Marti MA, Lebrero MCG, Roitberg AE, Estrin DA. J. Am. Chem. Soc. 2008;130:1611–1618. doi: 10.1021/ja075565a. [DOI] [PubMed] [Google Scholar]
- 40.Maes EM, Weichsel A, Andersen JF, Shepley D, Montfort WR. Biochemistry. 2004;43:6679–6690. doi: 10.1021/bi049748a. [DOI] [PubMed] [Google Scholar]
- 41.Menyhárd DK, Keserü GM. FEBS letters. 2005;579:5392–5398. doi: 10.1016/j.febslet.2005.09.003. [DOI] [PubMed] [Google Scholar]
- 42.Kalko SG, Gelpi JL, Fita I, Orozco M. Journal of the American Chemical Society. 2001;123:9665–9672. doi: 10.1021/ja010512t. [DOI] [PubMed] [Google Scholar]
- 43.Borrelli KW, Vitalis A, Alcantara R, Guallar V. Journal of Chemical Theory and Computation. 2005;1:1304–1311. doi: 10.1021/ct0501811. [DOI] [PubMed] [Google Scholar]
- 44.Elber R, Karplus M. Journal of the American Chemical Society. 1990;112:9161–9175. [Google Scholar]
- 45.Ludemann SK, Lounnas V, Wade RC. Journal of Molecular Biology. 2000;303:797–811. doi: 10.1006/jmbi.2000.4154. [DOI] [PubMed] [Google Scholar]
- 46.Cohen J, Arkhipov A, Braun R, Schulten K. Biophysical Journal. 2006;91:1844–1857. doi: 10.1529/biophysj.106.085746. [DOI] [PMC free article] [PubMed] [Google Scholar]
- 47.Ruscio JZ, Kumar D, Shukla M, Prisant MG, Murali TM, Onufriev AV. Proceedings of the National Academy of Sciences. 2008;105:9204–9209. doi: 10.1073/pnas.0710825105. [DOI] [PMC free article] [PubMed] [Google Scholar]
- 48.Jarzynski C. Physical Review Letters. 1997;78:2690–2693. [Google Scholar]
- 49.Maes EM, Roberts SA, Weichsel A, Montfort WR. Biochemistry. 2005;44:12690–12699. doi: 10.1021/bi0506573. [DOI] [PubMed] [Google Scholar]
- 50.Berendsen HJC, Postma JPM, Van Gunsteren WF, DiNola A, Haak JR. J. Chem. Phys. 1984;81:3684–3690. [Google Scholar]
- 51.Vangunsteren WF, Berendsen HJC. Angewandte Chemie-International Edition in English. 1990;29:992–1023. [Google Scholar]
- 52.Ryckaert JP, Ciccotti G, Berendsen HJC. Journal of Computational Physics. 1977;23:327–341. [Google Scholar]
- 53.Hornak V, Abel R, Okur A, Strockbine B, Roitberg A, Simmerling C. Proteins: Structure, Function and Genetics. 2006;65:712–725. doi: 10.1002/prot.21123. [DOI] [PMC free article] [PubMed] [Google Scholar]
- 54.Bikiel DE, Boechi L, Capece L, Crespo A, De Biase PM, Di Lella S, Gonza?lez Lebrero MC, Marti MA, Nadra AD, Perissinotti LL, Scherlis DA, Estrin DA. Physical Chemistry Chemical Physics. 2006;8:5611–5628. doi: 10.1039/b611741b. [DOI] [PubMed] [Google Scholar]
- 55.Pearlman DA, Case DA, Caldwell JW, Ross WS, Cheatham TE, Debolt S, Ferguson D, Seibel G, Kollman P. Computer Physics Communications. 1995;91:1–41. [Google Scholar]
- 56.Sugita Y, Okamoto Y. Chemical Physics Letters. 1999;314:141–151. [Google Scholar]
- 57.Mongan J, Case DA, McCammon JA. Journal of Computational Chemistry. 2004;25:2038–2048. doi: 10.1002/jcc.20139. [DOI] [PubMed] [Google Scholar]
- 58.Metropolis N, Rosenbluth AW, Rosenbluth MN, Teller AH, Teller E. Journal of Chemical Physics. 1953;21:1087–1092. [Google Scholar]
- 59.Onufriev A, Bashford D, Case DA. Journal of Physical Chemistry B. 2000;104:3712–3720. [Google Scholar]
- 60.Crespo A, Marti MA, Kalko SG, Morreale A, Orozco M, Gelpi JL, Luque FJ, Estrin DA. Journal of the American Chemical Society. 2005;127:4433–4444. doi: 10.1021/ja0450004. [DOI] [PubMed] [Google Scholar]
- 61.Hummer G, Szabo A. Proceedings of the National Academy of Sciences of the United States of America. 2001;98:3658–3661. doi: 10.1073/pnas.071034098. [DOI] [PMC free article] [PubMed] [Google Scholar]
- 62.Park S, Schulten K. Journal of Chemical Physics. 2004;120:5946–5961. doi: 10.1063/1.1651473. [DOI] [PubMed] [Google Scholar]
- 63.Xiong H, Crespo A, Marti M, Estrin D, Roitberg AE. Theoretical Chemistry Accounts. 2006;116:338–346. [Google Scholar]
- 64.Capece L, Marti MA, Crespo A, Doctorovich F, Estrin DA. Journal of the American Chemical Society. 2006;128:12455–12461. doi: 10.1021/ja0620033. [DOI] [PubMed] [Google Scholar]
- 65.Mathews AJ, Olson JS. Hemoglobins, Pt C. 1994;232:363–386. doi: 10.1016/0076-6879(94)32055-1. [DOI] [PubMed] [Google Scholar]
- 66.Perutz MF, Fermi G, Luisi B, Shaanan B, Liddington RC. Accounts of Chemical Research. 1987;20:309–321. [Google Scholar]