

Abstract
The use of fluorescent probes is one of the most powerful techniques for gaining spatial and temporal knowledge of dynamic events within living cells. Localized increases in the signal from cytosolic fluorescent protein constructs, for example, are frequently used as evidence for translocation of proteins to specific sites within the cell. However, differences in optical and geometrical properties of cytoplasm can influence the recorded intensity of the probe signal. Pseudopodia are especially problematic because their cytoplasmic properties can cause abrupt increases in fluorescent signal of both GFP and fluorescein. Investigators should therefore be cautious when interpreting fluorescence changes within a cell, as these can result from either translocation of the probe or changes in the optical properties of the milieu surrounding the probe.
The problem with imaging cells
The problem with imaging cells is that they are rarely optically uniform. In cells which form pseudopodia, this nonuniformity changes dynamically with changes in cell morphology and can give rise to fluorescence intensity artifacts (Table I). As cells extend pseudopodia, their topography is dramatically altered between the central body and the cell periphery. The stretching part of the cell is often considerably thinner than the rest of the cell, and may terminate in a ruffling or thicker edge (Fig. 1). Artifacts may thus arise, giving the appearance of localized fluorescent signal at the tips of pseudopodia due to variation of the excitation path with pseudopod thickness (Fig. 1). This effect is frequently observed with nonconfocal imaging, but can also be observed within a confocal optical section, depending on the relative location and thickness of the optical section (Fig. 1). This problem, familiar to many experienced microscopists, can often be resolved by inspection of different optical planes.
Table I.
Fluorescence imaging artifacts accompanying pseudopodia formation
| Cellular condition | Consequence | Fluorescence Imaging Artifact |
| A. Non-uniformity of plasma membrane topography | ||
| (i) Membrane ruffling | ||
| (ii) Increased sub-resolution convolutions in pseudopodial membrane | Locally increased membrane within the imaging plane | Higher local fluorescence of membrane probes |
| (iii) Reduced sub-resolution convolutions in pseudopodial membrane | Locally reduced membrane within the imaging plane | Lower local fluorescence of membrane probes |
| B. Non-uniformity of pseudopodial z-plane thickness | Locally reduced cytoplasmic volume within the imaging plane | Lower fluorescence in “thinner” region of pseudopodium |
| (i) Extended pseudopodia thinner than non-pseudopodial regions | ||
| (ii) Thickening of termini relative of extending pseudopodia | Locally increased cytoplasmic volume within the imaging plane | Higher fluorescence localized to “thicker” regions of pseudopodium |
| (iii) z-plane extensions at pseudopodia termini not yet attached to substrate | ||
| C. Organelle exclusion from pseudopodiaa | ||
| (i) Reduced light scattering in extending pseudopodia (see Fig. 2 b) | (i) Locally increased excitation efficiency | |
| (ii) Reduced cytosolic density (see Fig. 2 a) | (ii) Locally increased cytoplasmic fluor concentration | Higher fluorescence in pseudopodia |
Artifacts listed in C have not previously been recognized and is the main subject of this paper.
Figure 1.
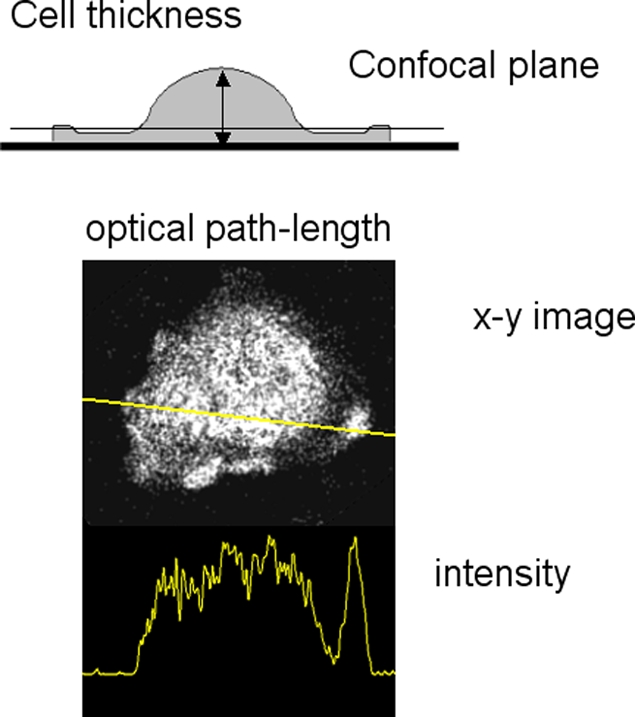
Excitation path-length changes caused by difference in cell thickness. The top diagram shows how cell thickness varies across the cell, which has a thin skirt around it and a thicker terminal region. The position of a confocal optical section is shown which would include the thicker terminal region but not the skirt. An example of this artifact is shown below (spreading human neutrophil), together with its intensity profile. For this and other confocal images shown in this paper, the resonant scanning head of the Leica SP2 confocal microscope with a 63x oil immersion objective NA 1.32 (HCX-PL- APO) was used
A second problem, which is the subject of the remainder of the article, is perhaps not as widely recognized and relates to spatially restricted optical properties of the pseudopod itself, regardless of its thickness. Pseudopodia, formed by motile or phagocytic cells, are often recognized in phase-contrast microscopy by the different “quality” of their cytoplasm. This is because the newly forming pseudopodia usually do not contain microscopically visible organelles such as granules or lysosomes (Fig. 2 a). Organelle-free cytoplasmic zones such as these have an optical environment distinct from the remainder of the cell, which has a localized effect on the fluorescent output from probes. First, in pseudopodia there is an increase in the excitation optical path length of fluors that are excluded from organelles. Effectively, the bulk cytosolic concentration of a soluble fluor is reduced by the presence of excluding organelles (Fig. 2 b). In a region of cytoplasm which is devoid of organelles, the total amount of fluor in a given volume within that region is thus increased relative to other organelle-containing regions. Second, the optically clear cytoplasm which forms within pseudopodia is a medium with lower light-scattering properties than the remainder of the cell (Fig. 2 c). The fluorescence excitation efficiency is therefore locally higher in the pseudopodia than elsewhere in the cell. Both of these effects increase the fluorescent signal in the pseudopod relative to the cell body (Fig. 2 d). Thus, a local increase in fluorescent signal can occur without actual translocation of the probe to a given location.
Figure 2.
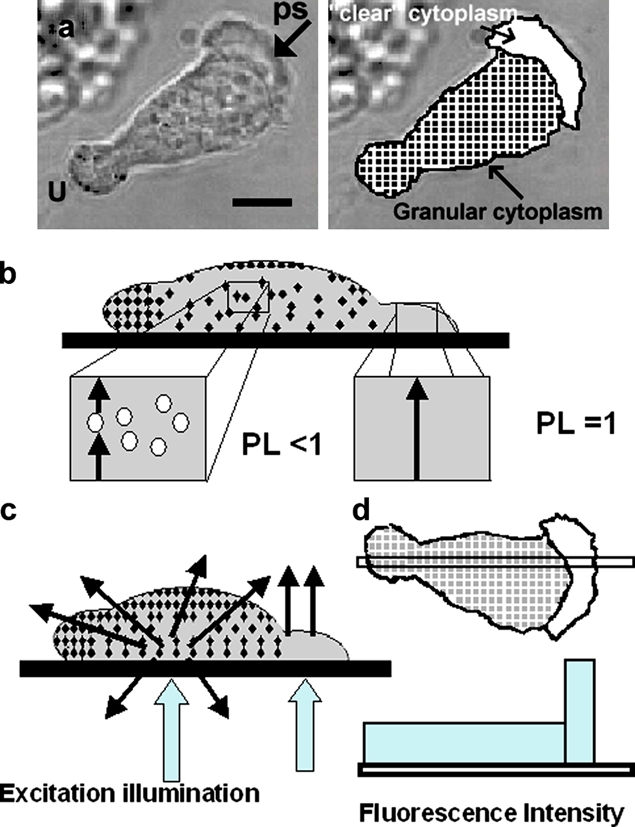
Principle of spatial-optical effect at leading pseudopodium. (a) Phase-contrast image of polarized human neutrophils showing the leading pseudopodium of the cell marked “ps” and the uropod at the rear marked “U”. The granular and organelle-free zones are marked for clarity. (b) A “sideways” or orthogonal view of the cell showing how the amount of organelle-free cytoplasm, and hence the fluor gross concentration and optical path-length (PL) available, varies along the length of the cell. (c) The differential effect of light scattering by granular zone of cytoplasm and transmission in the clear zone are illustrated in this orthogonal view. (d) The predicted difference in efficiency of fluorescence excitation along the axis of the cell. Bar (a), 5 µm
The key question for cell biologists using fluors as cytoplasmic probes for localization in cells with dynamic morphologies is whether this effect is big enough to affect the interpretation of imaging studies. We demonstrate here that such effects can be profound. Using cytosolic fluorescein and GFP, simple molecules with little possibility of specific translocation, we show that the recorded fluorescent signal can be significantly increased in organelle-free cytoplasmic zones generated during phagocytosis, chemotaxis, and in artificially generated cell blebs.
Theoretical basis for localized spatial-optical effects
The basis for the spatial and optical effects leading to “false localization” can be best exemplified in motile cells, where there is a dramatic morphological change involving organelle rearrangement. It is well known that a zone, devoid of granules and other organelles, forms at the front edge of the cell (e.g., Fig. 2 a and Bessis, 1973). Zone formation may be related to actin polymerization and exclusion of nonmolecular structures, such as organelles, at the leading edge (Luby-Phelps et al., 1986). If the fluor is excluded from granules and other organelles, the effective excitation light path will be reduced by the presence of organelles. In effect, the concentration of the fluor is lower in the granular parts of the cytoplasm than in granular-free regions (Fig. 2 b). For example, the volume occupancy of granules in neutrophils in the nonnuclear cytoplasm is ∼20% (Schmid-Schonbein et al., 1980). Thus, the effective gross concentration of cytosolic fluors is 20% lower in the granular cytoplasm than in granule-free cytoplasm such as at the leading pseudopodia. It is therefore expected that the intensity of fluorescence at these granule-free sites would be increased by a factor of 1.25. As this effect is simply due to a change in excitation path length, we have called this a spatial, rather than strictly an optical, effect. It should be noted that, provided the fluor-excluding organelles are at a uniform density throughout the depth of the cell, this effect does not depend on the depth of the confocal optical plane within the cell. In this sense, it is independent of z-spatial dimension, which is in contrast with the light-scattering, optical effect.
The organelle-free cytoplasmic zone of the pseudopod is optically “clear,” as opposed to the light-scattering and absorbing cytoplasm in the bulk of the cell (Fig. 2 c). This change in optical properties impacts the efficiency with which fluors are excited (Fig. 2 d). Mie scattering theory, which is an established basis for predicting the light-scattering effect of particles suspended within a medium (Mie 1908), predicts that light scattering by particles of the same order of magnitude as the wavelength of the incident light will be profound in some granular cells (Meyer, 1979: Ruban et al., 2007). In granular cytoplasm (granule diameters 0.2–0.3 µm), the attenuation coefficient could be as high as 700 mm−1 (Prahl, 2007), depending on the number of granules/volume of cytoplasm (see online supplemental material for details of a sample calculation, available at http://www.jcb.org/cgi/content/full/jcb.200806047/DC1). As a result of this attenuation, the efficiency of excitation of the fluor decreases as the imaging plane is taken from deeper within the cell. The effect of light scattering and absorbance can be seen in the orthogonal (z plane) image. In Fig. 3 a, z-plane images of fluorescein in free solution and immobilized on a latex sphere, an object with high light-scattering properties, are compared. The attenuation of signal by the latex sphere is obvious within a distance of only a few microns and a “shadow” of reduced excitation is cast into the free fluorescein above the sphere. For comparison, orthogonal plane images of soluble fluors within the cytoplasm of a motile neutrophil, Dictyostelium, epithelial cell (PC3) and endothelial cell (HECV) are shown (Fig. 3, b–e). Whereas the fluor in the latter cell types behave like fluor in free solution, in neutrophils attenuation is obvious (intermediate attenuation is observed in Dictyostelium). Therefore, it is expected that an optical artifact would be apparent in a pseudopodium imaged at optical planes of cells where z-plane attenuation is high.
Figure 3.

Spatial attenuation of fluorescein in cytoplasm and free solution. (a) xz section as shown through fluorescein in solution (100 µM), fluorescein conjugated at a latex sphere (10-µm-diam), and the latex sphere in the fluorescein solution. (b) Fluorescein-loaded HECV cell, (c) fluorescein-loaded PC3 cell, (d) GFP-expressing dictyostelium, and (e) fluorescein-loaded human neutrophil shown as phase-contrast image, xy and xz confocal planes. An enlarged version of the xz section of a polarized human neutrophil along the line marked is shown in e′. (f) A similar xz section is shown though two other neutrophils which have not yet “flattened out“ showing the clear attenuation of fluorescence toward the top of the cells. (g) The intensity profile of the free fluorescein and latex-attached fluorescein together with data from the cells shown, using the colored symbols indicated on the images. Bar: (a) 10 µm; (b–e) 25 µm
Intensity asymmetry of cytosolic fluorescein signal
The magnitude of this problem can be easily demonstrated in human neutrophils loaded with the diacetate ester form of fluorescein. As the cells polarize and extend pseudopodia, areas of increased fluorescent signal (∼1.4-fold) become apparent. These areas correlate with sites of granule-free zones in the cell and move dynamically (Fig. 4). If this effect were the result of fluor redistribution within the cell, the total fluorescent signal would remain constant (i.e., the fluorescent signal would decrease in some sub-cellular locations and increase in others). However, in this example, the total fluorescent signal from the cell rises and falls as pseudopodia form (Fig. 4, a and b; and Video 1, available at http://www.jcb.org/cgi/content/full/jcb.200806047/DC1). These observations are diagnostic of the spatial-optical artifact and are consistent with the formation of zones within the cell which have improved properties for excitation, not redistribution, of fluorescein. However, fluorescein is not ideal for this demonstration as its intensity is also dependent on pH (Tsien, 1989), yet the sharp boundary between high and low fluorescent zones (Fig. 4 d) makes it unlikely that fluorescein is reporting a pH gradient here. Furthermore, the same effects are also observed with other small molecular probes, such as eosin, and more importantly, by pH-insensitive GFP (Shaner et al., 2005).
Figure 4.

Asymmetrical signals with cytoplasmic fluorescein. The dynamic nature of the fluorescence asymmetry of fluorescein is shown (a) in a time sequence of images and (b) as a graph of total cellular and cytosolic fluorescent signals. The complete time sequence is shown in Video 1 (available at http://www.jcb.org/cgi/content/full/jcb.200806047/DC1). (c) The correlation between the increased fluorescence at the leading edge and the appearance of organelle-free cytoplasm is shown in the time sequence in which the top panel shows fluorescein fluorescence and the bottom panel the corresponding phase-contrast images. Images are shown at 10-s intervals. The maximum projection of organelle-free cytoplasm is marked by an asterisk in the third image pair. (d) The typical distribution of fluorescence intensity of cytoplasmic fluorescein along the axis of a polarized human neutrophil is shown. Bars: (a) 10 µm; (c) 8 µm; (d) 5 µm.
GFP fluorescence intensity asymmetry
Because GFP and its relatives are widely used as the fluorescent moiety of chimeric proteins, it is obviously important and perhaps more relevant to establish whether GFP itself can produce a similar artifact. Unless linked to a granule-targeting sequence, the larger molecular weight of GFP excludes it from diffusion across granule membranes. This guarantees that the excitation path-length available to cytosolic GFP is thus reduced by the presence of GFP-excluding granules (Fig. 2 b). It is therefore expected that, in addition to the light-scattering related phenomenon demonstrated for granule-permeant fluors such as fluorescein, the reduced light path effect would further reduce the GFP signal detected from the granular cytoplasm and thus increase its relative intensity in the granule-free cytoplasm. As with fluorescein, there was a pronounced increase in fluorescent signal at the leading edge (Fig. 5 a) and within the pseudopodia as they formed (Fig. 5 b), with an enhancement of 1.6-fold (significantly higher than fluorescein alone). The zones of increased fluorescence correlated with the organelle-free zones in the cells (Fig. 5 b) demarcated at the organelle free-granule containing boundary (Fig. 5 c). In addition, the total fluorescent signal from the cell increased during pseudopodia formation. It is conceivable that the asymmetrical distribution of GFP arose from a protein–protein interaction, such as tight binding of GFP to proteins at the leading edge. This is unlikely, as laser photobleaching at the pole opposite the zone of increased fluorescence intensity caused a decrease in the intensity of the entire GFP pool (Fig. 5 d). If GFP had accumulated at the leading edge as a result of binding to another protein, it would have been insulated from this localized photobleaching effect. However, there was no difference in the rate of decrease of GFP fluorescence in the bulk cytoplasm or the organelle-free cytoplasm, suggesting that the GFP was equally free to diffuse in both locations (Fig. 5 e). In addition, the asymmetries in GFP fluorescence were dynamic, forming and relaxing with pseudopodia formation (Fig. 5 and Video 2, available at http://www.jcb.org/cgi/content/full/jcb.200806047/DC1).
Figure 5.

Asymmetrical signals with cytoplasmic GFP. The typical distribution of fluorescence intensity of cytoplasmic GFP in human cord blood–derived neutrophils along the axis shown of a polarizing cell (a) and a cell undergoing phagocytosis (b). (c) The dynamic nature of the fluorescence asymmetry of GFP during phagocytosis is shown in a time sequence of images of a cell undergoing phagocytosis. The position of the iC3b-opsonised zymosan particle (presented with a micropipette) is indicated in the phase-contrast image and the fluorescent images below at the times indicated. The complete time course is shown in Video 2 (available at http://www.jcb.org/cgi/content/full/jcb.200806047/DC1). (d) The effect of localized photobleaching (30 s) within the white square on the GFP signal from the leading pseudopodia and cell body is shown and (e) quantified for the leading pseudopodia (ps) and cell body (b). The ratio of mean intensities in the two locations is also shown as the dotted line (e). Bars: (a and b) 5 µm; (c) 10 µm; (d) 10 µm. Human neutrophils expressing GFP were generated from cord blood as described previously (Omidvar et al., 2006).
To establish the relative contribution of the organelle-excluding and light-scattering effects, orthogonal plane images were taken. The effective concentration of the fluor is independent of the depth within the cell. Thus, the effect due to organelle-excluding cytoplasm would be constant throughout the cell depth. In contrast, the light-scattering effect is greater deeper within the cell. The enhanced fluorescence at the front of polarized neutrophils is evident throughout the full thickness of the cell, showing little evidence of depth-related light scattering (Fig. 3, e′ and f). In the remainder of the cell, the intensity of fluorescence decreases at greater excitation light path-lengths toward the top of the cell. This attenuation (attributed to the light-scattering effect) is more obvious in thicker cells (Fig. 3 f), as expected from the Mie theory. Thus, the enhanced fluorescence in pseudopodia results from both decreased light scattering and increased effective cytoplasmic concentration.
Fluorescence intensity increases in cytoplasmic blebs
As a further demonstration that the intensity of GFP is related to the localized and unique optical properties of granule-free cytoplasm rather than to physiologically induced polarization or pseudopodia formation, granule-free zones were created artificially by elevating cytosolic free Ca2+ to pathologically high levels using Ca2+ ionophore and high extracellular Ca2+. Under these conditions, the normally wrinkled plasma membrane unfurls uncontrollably giving rise to “blebs” (Hallett and Dewitt, 2007). These blebs are detached from the actin cytoskeleton (Charras et al., 2006) and are devoid of organelles or granules. The mechanism by which they form is therefore dissimilar to the dynamic pseudopodia formation at the leading edge of motile cells, yet cytosolic GFP or fluorescein showed a similar increase in intensity at sites of membrane blebbing (Fig. 6, a and c). This effect is more prominent in cord blood–derived granulocytes (Fig. 6 a) and primary neutrophils (Fig. 6 c) than in Dictyostelium (Fig. 6 a'), partly because of the smaller and transient nature of the blebs that form in Dictyostelium. However, even in Dictyostelium, fluorescence intensity is increased at the granule free-cytoplasmic boundary (Fig. 6 a'). In neutrophils, the geometry of the longer-lived granule-free “blebs,” which are hemispherical, is different from the more planar pseudopodia (Fig. 6 c). An optical section can easily be found that passes through the equators of both the cell and the bleb, removing any possible sampling basis. Under these conditions, there is a similar increase in fluorescence intensity observed in the bleb as in the leading edge or phagocytic pseudopodia of neutrophils. In addition, intensity increase is independent of the size of the bleb, as predicted (Fig. 6).
Figure 6.

Asymmetrical signals with cytoplasmic fluors during bleb formation. The typical distribution of fluorescence intensity of cytoplasmic GFP along the axis indicated of a human neutrophil (a) and a Dictyostelium induced to bleb by ionophore and high extracellular Ca2+ (a′) (13 mM). (b) The fluorescence enhancement in the blebs, marked in the histogram “bl”, was similar to that observed with organelle-free cytoplasm at the leading edge or in phagocytic pseudopodia (marked “ps”) and was seen for both GFP and fluorescein (marked “GFP” and “fluor”, respectively [n = 17, 4, 8, and 5 for each column in order]). (c) The correlation between the increased fluorescence and the appearance of cytoplasmic blebs is shown in this time sequence in which the top panel shows fluorescein fluorescence and the bottom panel the corresponding phase-contrast images. The location of two blebs are marked by asterisks in the third image pair. Bars: (a) 8 µm; (c) 10 µm. The complete data for bleb formation and localized intensity increase are shown in Video 3 (available at http://www.jcb.org/cgi/content/full/jcb.200806047/DC1).
Conclusions and remedies
Visually, at least, the artifactual increases in fluorescent signal in forming pseudopodia shown here are worryingly familiar. Without knowing that these images show free cytosolic GFP or fluorescein, they could be misinterpreted as translocation of the probes to the pseudopodia. Of course, with a GFP construct designed as a probe, the danger of misinterpretation increases. For example, we have found that the fluorescence intensity of a p67phox-GFP, a component of the phagosomal oxidase, and a frequently used probe for PIP3, PH-Akt-GFP, both increase in the cytoplasm of pseudopodia during phagocytosis (Dewitt et al., 2006 and Fig. 6). However, neither probe in fact provides evidence for increased p67-phox translocation or PIP3 generation at this location because the effect can be explained entirely by the optical properties of this part of the cell (i.e., reduced light scattering and increased fluor concentration as a result of loss of fluor exclusion from granules). However, these observations could easily, but erroneously, be taken as evidence for protein translocation or increased PIP3 at the “leading edge” of these cells. We therefore stress that caution should be exercised when interpreting increases in localized fluorescence within pseudopodia. Dynamic fluorescence changes localized to leading and phagocytic pseudopodia similar to the artifactual changes we show here can be found in many reports with specific fluorescent probes (Gerisch et al., 1995; Aizawa et al., 1997; Servant et al., 2000; Wang et al., 2002; van Bruggen et al., 2004). Clearly, overreliance on such imaging data as evidence for protein translocation should be avoided and additional evidence or alternate methods for confirming this conclusion is always required.
This should strike a note of caution, but not of despair. First, the artifact can be easily distinguished from protein translocation by monitoring total cell fluorescence (Fig. 7). Appropriate controls, such as an irrelevant or nonsignaling GFP chimeric protein, should also be used to indicate the magnitude of the artifact. Second, not all cells are equally prone to the problem, and imaging cells with granular cytoplasms has an increased risk for flawed interpretation of localization data. Finally, once the problem has been recognized, there are also solutions. For example, taking the ratio of fluorescent images from signaling and “control” probes is often used when investigating pseudopodia formation or phagocytosis. There are examples of this good practice in the papers from Swanson's group (Kamen et al., 2007, 2008). Also, the depth attenuation effect shown in Fig. 3 makes the problem worse at optical sections deeper within the cell. Therefore, another simple precaution is to compare images taken at different optical sections. In our hands, the translocation of PH-Akt-GFP to forming phagocytic cups does not correlate temporally or spatially with optically clear pseudopodia (Dewitt et al., 2006). Instead, the increased fluorescent signal is associated with the plasma membrane, as expected from a probe for PIP3. To exclude the possibility that the increased intensity was due to submicroscopic convolution of the membrane, DiIC16(3) was used as an appropriate control marker of the plasma membrane (Dewitt et al., 2006). Ratio images of the control fluorescence and the probe confirms that the increase in intensity of the probes could not be explicable by a membrane convolution effect or other “nonspecific” effect (Fig. 8).
Figure 7.

Fluorescence intensity increases of GFP constructs in forming pseudopodia. The artifactual increases in fluorescent signal are evident in forming pseudopodia in neutrophilic HL60 cells expressing p67phox-GFP (a) and PH-Akt-GFP (b). The optical artifact is evident in the forming pseudopodia of these cells (gray arrows). However, this artifact can be distinguished from the genuine translocation of PH-Akt-GFP to the phagosomal membrane (red arrow). Bars, 5 µm
Figure 8.
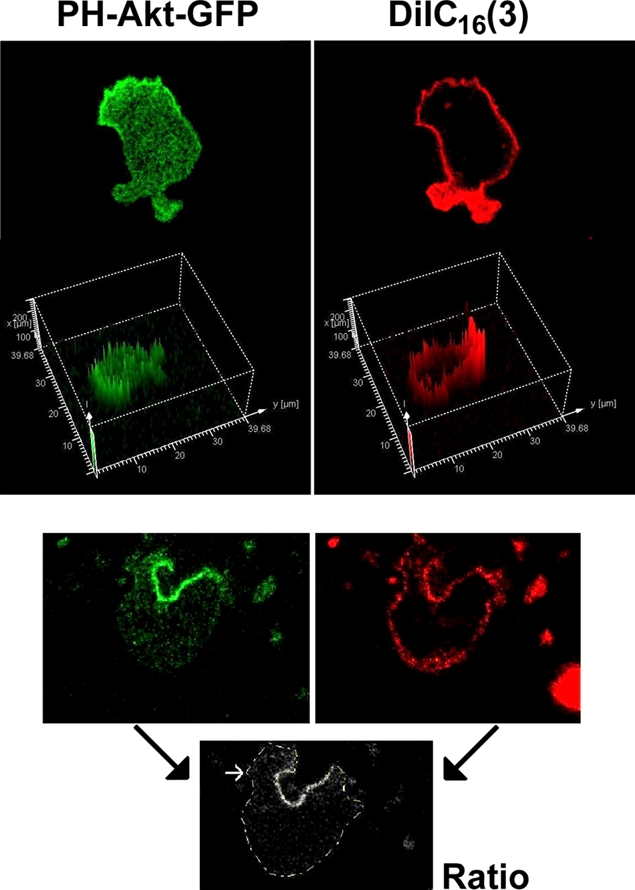
PH-Akt-GFP translocation to leading edge and phagocytic cup. (a) The localization of PH-Akt-GFP (green) and DiIC16(3) (red) in a polarized neutrophilic HL60 cell shows the specificity of PH-Akt-GFP fluorescence to the membrane at the front of the cell. (b) The distribution of PH-Akt-GFP (green) and DiIC16(3) (red) in a neutrophilic HL60 cell during phagocytosis is shown, together with a ratio image of the two signals showing the specificity of binding of PH-Akt-GFP to the phagocytic cup. Bar, 5 µm (data taken from Dewitt et al., 2006).
In this article, we have concentrated on confocal imaging, as this is widely used for studies of fluorescent cytosolic probes. With nonconfocal (wide-field conventional) fluorescence microscopy, the outcome of the spatial-optical effect is less predictable as its magnitude depends on the thickness, or the excitation path-length of cytoplasm in the pseudopodium, which is often thinner than the cell body. In the absence of optical sectioning, differences in cell volume are integrated with the spatial-optical enhancement demonstrated here. The intensity change detected (I) in the granule-free cytoplasm is a product of the spatial-optical enhancement ratio (E) and the cytoplasm thickness ratio (T, thickness of granule free zone/thickness of bulk cytoplasm): I = E × T. The resulting images could thus show increased signals at the granule free zone (when T > 1/E), uniform fluorescence throughout the cell (when T = 1/E), or a decrease in fluorescence in the granule-free pseudopodia (when T < 1/E). Because de-focusing further modifies the intensity effect of the thickness differences in nonconfocal microscopy, the intensity asymmetry of fluor in the pseudopodia is sensitive to the focus chosen. Extreme care must therefore be taken in interpreting the distribution of GFP and other fluors using nonconfocal data. It is recognized that taking image ratios is an indispensable part of nonconfocal cytosolic Ca2+ measurement. The nonconfocal and spatial-optical enhancement effects probably provide explanations for the early reports of localized and persistent high Ca2+ at the leading edge of polarized cells (Brundage et al., 1991) and around phagocytic pseudopodia (Sawyer et al., 1985). Neither phenomenon can be demonstrated using ratiometric determination of cytosolic free Ca2+ (Laffafian and Hallett, 1995; Dewitt and Hallett, 2002).
The data presented in this article were designed to draw attention to the poorly recognized problem of the distinct optical properties of living pseudopodia. As these properties can cause dramatic increases in fluorescent signals in pseudopodia at the front of motile cells or during phagocytosis independently of protein translocation, if unrecognized, they could lead to misinterpretation of asymmetry in fluorescent signal as asymmetry in the distribution of the protein.
Materials and methods
Cell preparation, GFP expression, and loading
Human neutrophils were isolated from the blood of healthy volunteers or generated from cord blood as described previously (Hallett et al., 1990; Omidvar et al., 2006). Physiological experiments were suspended in Krebs medium (120 mM NaCl, 4.9 mM KCl, 1.2 mM KH2PO4, 1.2 mM MgSO4, 1.3 mM CaCl2, 25 mM Hepes, and 0.1% bovine serum albumin, adjusted to pH 7.4 with NaOH). Fluorescein loading was achieved by incubation with fluorescein diacetate (Sigma-Aldrich) as described in detail elsewhere (Dewitt et al., 2002). GFP was expressed in cord blood–derived neutrophils by retroviral transduction of progenitor cells, as described previously (Omidvar et al., 2006). Mature GFP-expressing neutrophils were harvested after 28 d of culture.
Imaging and quantitation
Confocal imaging was achieved using a resonant scanning head of the Leica RS confocal laser microscope using a 63x oil immersion objective NA 1.32 (HCX-PL-APO). Neutrophils were allowed to adhere to the glass coverslip mounted onto a thermostatically control stage (37 ± 0.1°C) in Krebs medium and soluble stimuli, f-mlp (Sigma-Aldrich), or the particular phagocytic stimulus (iC3b-opsonised zymosan) delivered by micropipette as described previously (Dewitt and Hallett, 2002; Dewitt et al., 2002) during image acquisition. Adjustments to gain and offset were applied to whole time series datasets to allow genuine comparisons within a time sequence. “Raw fluorescent” images with no post-acquisition contrast enhancement or other manipulation were used for quantitation. The intensity across a cell was measured using either Leica analysis software, ImageMaster analysis software (PTI), or ImageJ. All data shown were representative of at least three different experimental runs from differentiated cord blood or different blood donors as the source of neutrophils.
Online supplemental material
Appendix 1 describes the Mie scattering calculation. Video 1 shows fluorescein asymmetry during cell polarization and movement. Video 2 shows GFP fluorescence asymmetry during cell polarization and phagocytosis. Video 3 shows Fluorescein fluorescence increase in artificially generated cell blebs. Online supplemental material is available at http://www.jcb.org/cgi/content/full/jcb.200806047/DC1.
Acknowledgments
We thank the Wellcome Trust (UK) for supporting this work, Lorna Pearn for technical assistance, and Dr. A. Sanders and Prof. A. Harwood for non-neutrophilic cells used in this study.
References
- Aizawa H., Fukui Y., Yahara I. 1997. Live dynamics of Dictyostelium cofilin suggests a role in remodeling actin latticework into bundles.J. Cell Sci. 110:2333–2344 [DOI] [PubMed] [Google Scholar]
- Bessis M. 1973. Living Blood Cells and their Ultrastructure Springer-Verlag, Berlin. New York: 298–323 [Google Scholar]
- Brundage R.A., Fogarty K.E., Tuft R.A., Fay F.S. 1991. Ca2+ gradients underlying polarization and chemotaxis of eosinophils.Science. 254:703–705 [DOI] [PubMed] [Google Scholar]
- Charras G.T., Hu C.-K., Coughlin M., Mitchison T.J. 2006. Re-assembly of a contractile actin cortex in cell blebs.J. Cell Biol. 175:477–490 [DOI] [PMC free article] [PubMed] [Google Scholar]
- Dewitt S., Hallett M.B. 2002. Cytosolic free Ca2+ changes and calpain activation are required for β2 integrin-accelerated phagocytosis by human neutrophils.J. Cell Biol. 159:181–189 [DOI] [PMC free article] [PubMed] [Google Scholar]
- Dewitt S., Laffafian I., Morris M.R., Hallett M.B. 2002. Measurement of cytosolic free Ca2+ in human neutrophils. In “Inflammation Protocols”.Methods Mol. Biol. 225:47–6012769473 [Google Scholar]
- Dewitt S., Tian W., Hallett M.B. 2006. Localised PtdIns(3,4,5)P-3 or PtdIns(3,4)P-2 at the phagocytic cup is required for both phagosome closure and Ca2+ signalling in HL60 neutrophils.J. Cell Sci. 119:443–451 [DOI] [PubMed] [Google Scholar]
- Gerisch G., Albrecht R., Heizer C., Hodgkinson S., Maniak M. 1995. Chemoattractant-controlled accumulation of coronin at the leading edge of Dictyostelium cells monitored using a green fluorescent protein-coronin fusion protein.Curr. Biol. 5:1280–1285 [DOI] [PubMed] [Google Scholar]
- Hallett M.B., Dewitt S. 2007. Ironing out the wrinkles of neutrophil phagocytosis: membrane reservoirs for surface area expansion.Trends Cell Biol. 17:209–214 [DOI] [PubMed] [Google Scholar]
- Hallett M.B., Davies E.V., Campbell A.K. 1990. Oxidase activation in individual neutrophils is dependent on the onset and magnitude of the Ca2+ signal.Cell Calcium. 11:655–663 [DOI] [PubMed] [Google Scholar]
- Kamen L.A., Levinsohn J., Swanson J.A. 2007. Differential association of phosphatidylinositol 3-kinase, SHIP-1, and PTEN with forming phagosomes.Mol. Biol. Cell. 18:2463–2472 [DOI] [PMC free article] [PubMed] [Google Scholar]
- Kamen L.A., Levinsohn J., Cadwallader A., Tridandapani S., Swanson J.A. 2008. SHIP-1 increases early oxidative burst and regulates phagosome maturation in macrophages.J. Immunol. 180:7497–7505 [DOI] [PMC free article] [PubMed] [Google Scholar]
- Laffafian I., Hallett M.B. 1995. Does cytosolic free Ca2+ signal neutrophil chemotaxis? J. Cell Sci. 108:3199–3205 [DOI] [PubMed] [Google Scholar]
- Luby-Phelps K., Taylor D.L., Lanni F. 1986. F Probing the structure of cytoplasm.J. Cell Biol. 102:2015–2022 [DOI] [PMC free article] [PubMed] [Google Scholar]
- Meyer R.A. 1979. Light scattering from biological cells: dependence of backscatter radiation on membrane thickness and refractive index.Appl. Opt. 18:585–588 [DOI] [PubMed] [Google Scholar]
- Mie G. 1908. Contributions to the optics of turbid media particularly of colloidal metal solutions.Ann. Phys. 330:377–445 (English translation http://diogenes.iwt.uni-bremen.de/vt/laser/papers/RAE-LT1873-1976-Mie-1908-translation.pdf) [Google Scholar]
- Omidvar N., Pearn L., Burnett A.K., Darley R.L. 2006. Ral is both necessary and sufficient for the inhibition of myeloid differentiation mediated by Ras.Mol. Cell. Biol. 26:3966–3975 [DOI] [PMC free article] [PubMed] [Google Scholar]
- Prahl S. 2007. Mie Scattering calculator. http://omlc.ogi.edu/calc/mie_calc.html [Google Scholar]
- Ruban G.I., Kosmacheva S.M., Goncharova N.V., Van Bockstaele D., Loiko V.A. 2007. Investigation of morphometric parameters for granulocytes and lymphocytes as applied to a solution of direct and inverse light-scattering problems.J. Biomed. Opt. 12:044017. [DOI] [PubMed] [Google Scholar]
- Sawyer D.W., Sullivan J.A., Mandell G.L. 1985. Intracellular free calcium localization in neutrophils during phagocytosis.Science. 230:663–666 [DOI] [PubMed] [Google Scholar]
- Schmid-Schonbein G.W., Shih Y.Y., Chien S. 1980. Morphometry of human leukocytes.Blood. 56:866–875 [PubMed] [Google Scholar]
- Servant G., Weiner O.D., Herzmark P., Balla T., Sedat J.W., Bourne H.R. 2000. Polarization of chemoattractant receptor signaling during neutrophil chemotaxis.Science. 287:1037–1040 [DOI] [PMC free article] [PubMed] [Google Scholar]
- Shaner N.C., Steinbach P.A., Tsien R.Y. 2005. A guide to choosing fluorescent proteins.Nat. Methods. 2:905–909 [DOI] [PubMed] [Google Scholar]
- Tsien R.Y. 1989. Fluorescent probes of cell signalling.Annu. Rev. Neurosci. 12:227–253 [DOI] [PubMed] [Google Scholar]
- van Bruggen R., Anthony E., Fernandez-Borja M., Roos D. 2004. Continuous translocation of Rac2 and the NADPH oxidase component p67(phox) during phagocytosis.J. Biol. Chem. 279:9097–9102 [DOI] [PubMed] [Google Scholar]
- Wang F., Herzmark P., Weiner O.D., Srinivasan S., Servant G., Bourne H.R. 2002. Lipid products of PI(3)Ks maintain persistent cell polarity and directed motility in neutrophils.Nat. Cell Biol. 4:513–518 [DOI] [PubMed] [Google Scholar]