

Abstract
Natural selection dictates that cells constantly adapt to dynamically changing environments in a context-dependent manner. Gene-regulatory networks often mediate the cellular response to perturbation 1-3, and an understanding of cellular adaptation will require experimental approaches aimed at subjecting cells to a dynamic environment that mimics their natural habitat 4-9. Here, we monitor the response of S. cerevisiae metabolic gene regulation to periodic changes in the external carbon source by utilizing a microfluidic platform that allows precise, dynamic control over environmental conditions. We find that the metabolic system acts as a low-pass filter that reliably responds to a slowly changing environment, while effectively ignoring fluctuations that are too fast for the cell to mount an efficient response. We use computational modeling calibrated with experimental data to determine how frequency selection in the system is controlled by the interaction of coupled regulatory networks governing the signal transduction of alternative carbon sources. Experimental verification of model predictions leads to the discovery of two novel properties of the regulatory network. First, we reveal a previously unknown mechanism for post-transcriptional control, by demonstrating that two key transcripts are degraded at a rate that depends on the carbon source. Second, we compare two S. cerevisiae strains and find that they exhibit the same frequency response despite having markedly different induction characteristics. Our results suggest that while certain characteristics of the complex networks may differ when probed in a static environment, the system has been optimized for a robust response to a dynamically changing environment. Importantly, the integration of a novel experimental platform with numerical simulations revealed previously masked network properties, and the approach establishes a framework for dynamically probing organisms in order to reveal mechanisms that have evolved to mediate cellular responses to unpredictable environments.
In order to probe the response of a metabolic gene network to a fluctuating environment, we developed a microfluidic platform which can subject a population of cells to a continuously varying media supply (Fig. 1). The device is designed to generate a fluctuating media signal by dynamically combining two media reservoirs according to a time-dependent function. Feeding channels deliver the media downstream to a customizable growth chamber, which for this study was constructed to constrain a population of yeast cells to grow in a monolayer, allowing for long-term data acquisition10. The composition of the media is dynamically controlled by a fluidic switch11, such that changes in the upstream source may be detected almost immediately by the cells. The fluidic switch was optimized to generate a linear range of mixing ratios from the two media inputs, allowing a variety of periodic waveforms or random signals to be generated (See Supplementary Information for full details of the device).
Figure 1.

Design and implementation of the microfluidic platform developed for our study. (a) Conceptual design of the imaging chamber. The chamber is coupled to the switch output channel via multiple 1 μm tall “feeding” channels. The feeding channels are fed by a controllable wave-form generator that creates sinusoidal perturbations in the glucose concentration while maintaining constant background levels of galactose. (b) An overview of the design shows the layout of the device. The device makes use of three flow networks for (1) loading cells (middle, black), (2) generating microenvironmental waveforms (bottom, green), (3) and controlling on-chip temperature (top, orange). The imaging chamber (center, gray region) is designed to be about 4 μm tall in order to constrain a population of yeast cells to grow in a monolayer. (c) Representative brightfield image of cells growing in the imaging chamber. These images are used to measure the total size of the colony. Scale bar is 25 μm in length, and large circles are support posts in the chamber. (d) Green fluorescence image of the same cells as in (c). These images allow us to measure the amount of Gal1p in each cell. (e) Red fluorescence image of the chamber. The glucose media also contains a red fluorescent dye, and therefore the intensity of the red fluorescence is proportional to the amount of glucose in the chamber at any given time.
As a quantifiable reporter of the cellular response to environmental fluctuations, we fused the native Gal1p protein of S. cerevisiae to the yeast-optimized enhanced cyan fluorescent protein (yECFP) 12,13. The enzymes for galactose utilization, including Gal1p, are among the most tightly regulated proteins in yeast. Because glucose requires much less energy to metabolize, cells will only consume galactose if glucose is not available. Therefore, S. cerevisiae has evolved a highly complex regulatory network to ensure that the galactose enzymes will be strongly activated when they are needed, but tightly repressed if glucose is present in the environment (Fig. 2(a)). Because the network is well studied and involves regulatory motifs common to many higher organisms, galactose utilization is a paradigm for gene regulation. In order to build on the current understanding of its robust regulatory mechanisms, we employed our microfluidic platform to monitor the dynamics of network activation and repression in response to sinusoidal perturbations of glucose over a galactose background.
Figure 2.

Regulation in the galactose utilization network (a) Schematic of the gene regulatory networks involved. The regulatory genes in the galactose network are activated by the Gal4p protein which binds to upstream activation sites. The GAL80 gene provides negative feedback in the system by prohibiting the inducing affects of Gal4p. Positive feedback is provided by both GAL2 and GAL3. Internalized galactose can bind to Gal3p and the resulting complex binds to Gal80p. Gal80p bound to the Gal3p-galactose complex is incapable of repressing Gal4p. Also, the transporter Gal2p increases the amount of internal galactose which stimulates the galactose network. The glucose network inhibits the transport of galactose and represses transcription of the galactose network in the presence of glucose through the action of Mig1p, which can bind to upstream regulatory sites of GAL1, GAL3 and GAL419. The glucose network also regulates the hexose transporter genes (HXT) which are responsible for transporting glucose into the cell27, which then activates the glucose network. (b) Experimentally measured decay of GAL1 transcripts in galactose (circles) and glucose (squares). Also shown are the best-fit lines corresponding to half-lives of around 17 min in galactose (solid line) and 4 min in glucose (dashed line), similar to the values predicted by the numerical model. Data is normalized to the initial concentration of mRNA predicted by the best-fit lines. Similar results for GAL3 transcripts are shown in the Supplementary Information.
A population of yeast cells was subjected to sinusoidal glucose waves over a 0.2% (w/v) galactose background, with varying glucose concentration from 0.0% (no repression of GAL1 transcription) to 0.25% (full repression; see Supplementary Information for repression data). For each run we changed the frequency of the glucose signal, varying the period from 0.75 to 4.5 hr, and we imaged the population for a minimum of four full cycles. Time-lapse fluorescence imaging of the cell population in the growth chamber was used to calculate the amplitude ratio and phase shift of the cellular response relative to glucose signal. The results show a maximum response frequency of about 5.6 rads hr−1 (1.125 hr period). At this frequency, the response trace was indistinguishable from a normal step function response, whereas at the lower frequencies the temporal fluorescence trajectories clearly oscillated in response to the signal. In this sense, the galactose system appears to function as a low-pass filter that reliably responds to a slowly changing environment, while effectively ignoring fluctuations that are too fast for the cell to mount an efficient response.
Since the sinusoidal driving of the galactose utilization network leads to complex cellular behavior, we used computational modeling to simulate the response and uncover key aspects of the network architecture that give rise to the observed behavior 14. In particular, we were interested in how the interplay of the galactose and glucose utilization networks gives rise to the observed frequency response to carbon source fluctuations. By itself, the turnover of Gal1p-yECFP, either due to dilution or active degradation (or both), leads to low pass filtering of periodic signals. However, feedback loops inherent to gene regulatory networks can alter the response of proteins to stimuli15. Therefore, in order to simulate the effects of galactose activation and glucose repression on our experimental data, we adapted a comprehensive model of the galactose network originally described by deAtauri et al.16 This model includes the transcription and translation of the GAL1, GAL2, GAL3, GAL4 and GAL80 genes as well as the interactions of their respective proteins with each other and galactose (such as dimerization, transport and metabolism). Whenever possible we used parameter values either at or close to the values reported by deAtauri et al. In addition to this galactose network model, it was necessary to model the dynamics of the glucose network. The glucose network is much more complex than that of galactose17-19 and models for it are much less well established. Therefore, we chose to model the glucose network with a simplified module describing a basic transport regulatory system. In it, protein products of the glucose network are responsible for transporting external glucose into the cell while internalized glucose acts to induce transcription in the network, giving rise to a positive feedback loop (see Fig. 2(a)).
Calibration of the computational model to the experimental data led to several important observations that would not have arisen from an analysis of steady-state batch culture data. The large amplitude ratios observed at low frequencies suggested that when glucose was added to the system the degradation rates of some galactose network components were greater than in the absence of glucose. Previous studies have suggested that components of the glucose network can actively degrade mRNA produced by genes involved in the galactose/glucose switch8, and such a phenomenon has also been shown to exist for the mRNA of other genes20-22. Therefore, We added enzymatic decay terms (governed by Michaelis-Menten dynamics) to the equations describing the dynamics of the GAL1 and GAL3 mRNA and found that it greatly increased the accuracy of the model. These two genes are among those in the galactose network that are targeted by the glucose induced Mig1p that represses transcription by binding to upstream regulatory sites19. Thus, if proteins from the glucose network do actively degrade galactose network transcripts, GAL1 and GAL3 are likely targets. To test this prediction, we measured the degradation rates of GAL1 and GAL3 in both galactose and glucose. Both transcripts showed a 2-8 fold increase in their decay rates when in the presence of glucose (see Fig. 2(b) and Supplementary Information), consistent with the values predicted by the computational model. This form of post-transcriptional regulation, in which glucose acts to down-regulate GAL protein synthesis, is a previously unknown source of regulation in the galactose utilization network. Furthermore, the inclusion of glucose mediated mRNA decay results in a model that accurately reproduces the dynamic response of a population of cells to sinusoidal repression over a large range of frequencies (Fig. 3).
Figure 3.
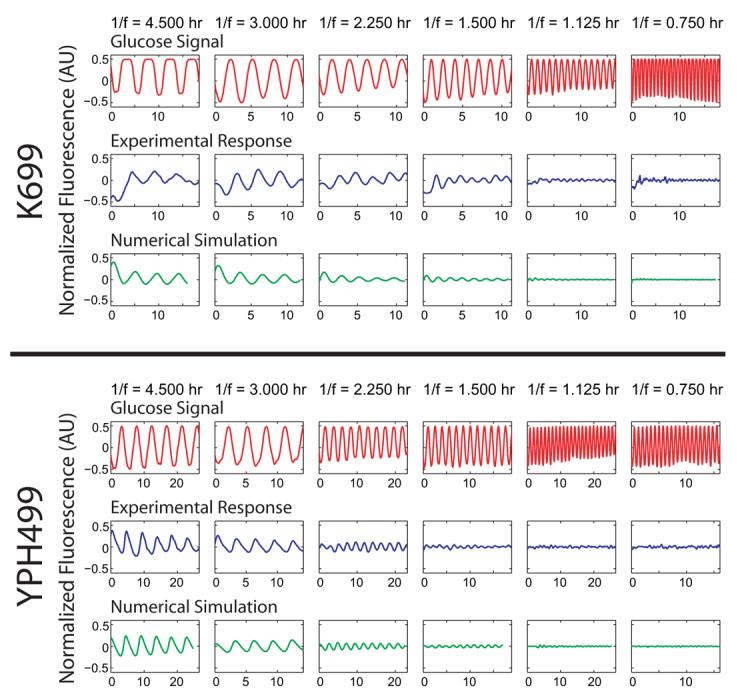
Experimental and computational results for cells expressing a GAL1-yECFP fusion gene in response to alternating glucose and galactose media for strains K699 and YPH499. The top row of each strain depicts the input glucose signal measured during each experimental run and also used to simulate the responses. The mean fluorescence of a red tracer dye, representing the glucose concentration in the media, is normalized and subtracted from 1 to represent the “induction” signal used in the experimental and computational runs above. The middle rows show normalized and detrended fluorescence trajectories for a population of cells as they respond to glucose waves of various frequencies over a galactose background. In the absence of glucose, galactose induces transcription of GAL1-yECFP causing an increase in cellular fluorescence. However, as glucose is introduced into the extracellular environment, transcription of the galactose enzymes is shut off, causing a decrease in fluorescence signal as the Gal1p-yECFP protein is degraded. Oscillation periods shown from left to right are 4.5, 3.0, 2.25, 1.5, 1.125, and 0.75 hr. For input waves with a period shorter than 1.125 hr, cells no longer respond to sinusoidal repression in a periodic fashion, demonstrating their ability to “filter” out high frequency environmental fluctuations. The bottom rows show simulation results for the same frequencies as above. The model, calibrated to experimental induction and repression data, accurately reproduces the cellular responses over a large range of frequencies.
Batch-culture induction characteristics for metabolic genes can vary from strain to strain or depend sensitively on the growth state of the culture. Therefore, we were also interested in using the model to determine how galactose induction differences would affect the response to the glucose fluctuations. The model demonstrated that significantly different galactose induction does not necessarily lead to significant differences in the response characteristics (data not shown). In other words, the model led to the hypothesis that deficiencies in network induction capabilities might not hinder a cell's ability to adapt and thrive in a changing environment. The yeast strain used to collect this data, K699, is sensitive to external galactose concentrations, with full induction of the galactose network occurring around 0.05% (w/v) galactose. In order to test our hypothesis, we turned to a strain (YPH499) that is known to have a deficiency in the galactose utilization network, which causes it to require more galactose than “normal” to induce production of the galactose enzymes 23. YPH499 is a derivative of a GAL2 mutant strain, and while the mutations were reportedly repaired, the GAL2 alleles in many of the derivative strains have been shown to cause significantly impaired galactose uptake 23. The Gal2p protein is responsible for the transport of extracellular galactose into the cell and its activity is markedly different in YPH499 than in K699. Our flow cytometry population data demonstrated that YPH499 cells require about ten times more galactose to reach full induction than do K699 cells (see Supplementary Information).
Despite the difference in induction sensitivity between K699 and YPH499, our model predicted that inefficient Gal2p transport does not translate into a less robust response to a fluctuating environment. This suggests that the complex interplay of the glucose and galactose networks may confer robustness to cells even if faced with deficiencies in the induction characteristics. To validate this finding, we repeated the microfluidic runs at each frequency, this time using the YPH499 strain with a Gal1p-yECFP fusion. As predicted, the amplitude responses of the two strains are strikingly similar (Fig. 4), especially considering the significant difference in their galactose sensitivity. We do not at present know the underlying mechanistic property of the regulatory network that leads to the robust response of the two strains. Future studies might endeavor to deduce this mechanism through the systematic deconstruction of the regulatory elements in a single strain. While the present study demonstrates how robustness can occur despite large differences in induction characteristics, one could further investigate the generality of this phenomenon by comparing the responses of many different strains to different types of temporal perturbation.
Figure 4.

Experimental and computational comparison of two yeast strains, one of which (YPH499) is known to have a deficiency in the galactose utilization network. Amplitude (top row) and phase shift (bottom row) of the response of cells to sinusoidal repression at various frequencies are shown for both K699 (red) and YPH499 (blue) strains. For the highest frequency trial, reliable phases could not be calculated at all due to the noise, and have been omitted from the graphs. The experimental data (left column) demonstrate that the amplitude responses of the two strains are strikingly similar, especially considering their significantly different induction curves (see Supplementary Information). This phenomenon was predicted by model simulations, as slight modifications to the model parameters that affected induction and repression curves did not affect the cell population's robust response to a dynamic environment. This suggests that the complex structure of the glucose and galactose networks may confer robustness to cells even if faced with seemingly detrimental network deficiencies. The phase responses (bottom row) of the two strains did show a marked difference, with YPH499 cells exhibiting a greater phase lag than K699.
Methods Summary
Dynamic environment experiments
Cells containing a GAL1-yECFP fusion were imaged every 5 min for up to 24 hr using time lapse fluorescent microscopy to estimate the concentration of GAL1p as a function of time. Cells were constrained to grow in a custom designed microfluidic platform which allows for dynamically controlled mixing of two growth media. Here, our inducing media contained 2% raffinose + 0.2% galactose while the repressing media contained 2% raffinose + 0.2% galactose + 0.25% glucose. The resulting images were processed with cell segmentation and tracking software, and the population averaged fluorescence concentrations were measured. To ensure correct waveform generation, glucose concentrations were monitored by introducing a red fluorescent tracer dye (0.01 mg/mL, sulforhodamine 101) to the repressing media.
Microfluidic chips and waveform generation
The PDMS (polydimethylsiloxane) microfluidic devices were designed to allow for monolayer growth of yeast cells in the imaging chamber and were fabricated using standard replica molding techniques24-26. An upstream fluidic switch controlled the media input into the chamber by mixing the flows of the inducing and repressing media. The mixing ratio of the two media was governed by a software controlled, custom-designed pressurization system able to consistently produce time-varying waveforms.
mRNA degradation experiments
The degradation rates of GAL1 and GAL3 transcripts were measured using standard rt-qPCR techniques. Knockout strains for both genes were first created, and then ectopic GAL1 and GAL3 were placed back into the cell under the control of a doxycycline repressible promoter. mRNA half-lives were measured from cells grown in the presence or absence of glucose.
Complete details of all materials and methods used and the specifics of the computational model are available in the Supplementary Information.
Supplementary Material
Acknowledgements
We thank Dr. Alex Groisman for useful discussions regarding microfluidic design; Dr. Dmitri Volfson and Chris Grilly for aid in development and testing of image segmentation and tracking algorithms; and Mike Ferry for his suggestions on microbiology. This work was supported by the NIH NIGMS.
Footnotes
Supplementary Information Detailed fabrication, cell culture, image processing, and computational model calibration methods are available in the Supplemental Materials. Movies of cell growth and device operation are available online. Device photomasks and image processing software are freely available for academic use at http://biodynamics.ucsd.edu.
Competing Interests The authors declare that they have no competing financial interests.
References
- 1.Beadle GW, Tatum EL. Genetic control of biochemical reactions in Neurospora. Proc. Natl. Acad. Sci. USA. 1941;27:499–506. doi: 10.1073/pnas.27.11.499. [DOI] [PMC free article] [PubMed] [Google Scholar]
- 2.Jacob F, Monod J. Genetic regulatory mechanisms in the synthesis of proteins. J. Mol. Biol. 1961;3:318–56. doi: 10.1016/s0022-2836(61)80072-7. [DOI] [PubMed] [Google Scholar]
- 3.Douglas HC, Hawthorne DC. Regulation of genes controlling synthesis of the galactose pathway enzymes in yeast. Genetics. 1966;54:911–916. doi: 10.1093/genetics/54.3.911. [DOI] [PMC free article] [PubMed] [Google Scholar]
- 4.Thattai M, Shraiman BI. Metabolic switching in the sugar phosphotransferase system of escherichia coli. Biophys. J. 2003;85:744–754. doi: 10.1016/S0006-3495(03)74517-2. [DOI] [PMC free article] [PubMed] [Google Scholar]
- 5.Lipan O, Wong WH. The use of oscillatory signals in the study of genetic networks. Proc. Natl. Acad. Sci. USA. 2005;102:7063–8. doi: 10.1073/pnas.0403790102. [DOI] [PMC free article] [PubMed] [Google Scholar]
- 6.Kussell E, Leibler S. Phenotypic diversity, population growth, and information in fluctuating environments. Science. 2005;309:2075–2078. doi: 10.1126/science.1114383. [DOI] [PubMed] [Google Scholar]
- 7.Kruse K, Julicher F. Oscillations in cell biology. Curr. Opin. Cell Biol. 2005;17:20–26. doi: 10.1016/j.ceb.2004.12.007. [DOI] [PubMed] [Google Scholar]
- 8.Ronen M, Botstein D. Transcriptional response of steady-state yeast cultures to transient perturbations in carbon source. Proc. Natl. Acad. Sci. USA. 2006;103:389–394. doi: 10.1073/pnas.0509978103. [DOI] [PMC free article] [PubMed] [Google Scholar]
- 9.Thattai M, van Oudenaarden A. Stochastic gene expression in fluctuating environments. Genetics. 2004;167:523–530. doi: 10.1534/genetics.167.1.523. [DOI] [PMC free article] [PubMed] [Google Scholar]
- 10.Cookson S, Ostroff N, Pang WL, Volfson D, Hasty J. Monitoring dynamics of single-cell gene expression over multiple cell cycles. Mol. Sys. Biol. 2005;1(msb4100032):E1–E6. doi: 10.1038/msb4100032. [DOI] [PMC free article] [PubMed] [Google Scholar]
- 11.Groisman A, et al. A microfluidic chemostat for experiments with bacterial and yeast cells. Nat. Meth. 2005;2:685–689. doi: 10.1038/nmeth784. [DOI] [PubMed] [Google Scholar]
- 12.Sheff MA, Thorn KS. Optimized cassettes for fluorescent protein tagging in Saccharomyces cerevisiae. Yeast. 2004;21:661–670. doi: 10.1002/yea.1130. [DOI] [PubMed] [Google Scholar]
- 13.Raser JM, O'Shea EK. Control of stochasticity in eukaryotic gene expression. Science. 2004;304:1811–4. doi: 10.1126/science.1098641. [DOI] [PMC free article] [PubMed] [Google Scholar]
- 14.Hasty J, McMillen D, Isaacs F, Collins JJ. Computational studies of gene regulatory networks: in numero molecular biology. Nat. Rev. Genet. 2001;2:268–79. doi: 10.1038/35066056. [DOI] [PubMed] [Google Scholar]
- 15.Savageau MA. Comparison of classical and autogenous systems of regulation in inducible operons. Nature. 1974;252:546–9. doi: 10.1038/252546a0. [DOI] [PubMed] [Google Scholar]
- 16.de Atauri P, Orrell D, Ramsey S, Bolouri H. Evolution of ‘design’ principles in biochemical networks. Syst. Biol. 2004;1:28–40. doi: 10.1049/sb:20045013. [DOI] [PubMed] [Google Scholar]
- 17.Demir O, Kurnaz IA. An integrated model of glucose and galactose metabolism regulated by the GAL genetic switch. Comp. Biol. Chem. 2006;30:179–192. doi: 10.1016/j.compbiolchem.2006.02.004. [DOI] [PubMed] [Google Scholar]
- 18.Kaniak A, Xue Z, Macool D, Kim J, Johnston M. Regulatory network connecting two glucose signal transduction pathways in Saccharomyces cerevisiae. Euk. Cell. 2004;3:221–231. doi: 10.1128/EC.3.1.221-231.2004. [DOI] [PMC free article] [PubMed] [Google Scholar]
- 19.Verma M, Bhat OJ, Venkatesh KV. Steady-state analysis of glucose repression reveals hierarchical expression of proteins under Mig1p control in Saccharomyces cerevisiae. Biochem. J. 2005;388:843–849. doi: 10.1042/BJ20041883. [DOI] [PMC free article] [PubMed] [Google Scholar]
- 20.Scheffler IE, de la Cruz BJ, Preito S. Control of mRNA turnover as a mechanism of glucose repression in Saccharomyces cerevisiae. Biochem. Cell Biol. 1998;30:1175–1193. doi: 10.1016/s1357-2725(98)00086-7. [DOI] [PubMed] [Google Scholar]
- 21.de la Cruz BJ, Prieto S, Scheffler IE. The role of the 5′ untranslated region (UTR) in glucose-dependent mRNA decay. Yeast. 2002;19:887–902. doi: 10.1002/yea.884. [DOI] [PubMed] [Google Scholar]
- 22.Andrade RP, Kötter P, Entian KD, Casal M. Multiple transcripts regulate glucose-triggered mRNA decay of the lactate transporter JEN1 from Saccharomyces cerevisiae. Biochem. Bioph. Res. Co. 2005;332:254–262. doi: 10.1016/j.bbrc.2005.04.119. [DOI] [PubMed] [Google Scholar]
- 23.Rohde JR, Trinh J, Sadowski I. Multiple signals regulate gal transcription in yeast. Mol. Cell Biol. 2000;20:3880–3886. doi: 10.1128/mcb.20.11.3880-3886.2000. [DOI] [PMC free article] [PubMed] [Google Scholar]
- 24.Whitesides GM, Ostuni E, Takayama S, Jiang XY, Ingber DE. Soft lithography in biology and biochemistry. Ann. Rev. Biomed. Eng. 2001;3:335–373. doi: 10.1146/annurev.bioeng.3.1.335. [DOI] [PubMed] [Google Scholar]
- 25.Whitesides GM, et al. Soft lithography and bioanalysis. Abstr. Paper Am. Chem. Soc. 2004;227:U113–U113. [Google Scholar]
- 26.Xia Y, Whitesides GM. Soft lithography. Ang. Chem. Int. Ed. 1998;37:550–575. doi: 10.1002/(SICI)1521-3773(19980316)37:5<550::AID-ANIE550>3.0.CO;2-G. [DOI] [PubMed] [Google Scholar]
- 27.Boles E, Hollenberg CP. The molecular genetics of hexose transport in yeasts. FEMS Microbiol. Rev. 1997;21:85–111. doi: 10.1111/j.1574-6976.1997.tb00346.x. [DOI] [PubMed] [Google Scholar]
Associated Data
This section collects any data citations, data availability statements, or supplementary materials included in this article.