Abstract
The design and synthesis of a fluorescent probe Fl-Sal-AMS 6 based on the tight-binding inhibitor 5′-O-[N-(salicyl)sulfamoyl]adenosine (Sal-AMS) is described for the aryl acid adenylating enzymes (AAAEs) known as MbtA, YbtE, EntE, VibE, DhbE and BasE involved in siderophore biosynthesis from Mycobacterium tuberculosis, Yersinia pestis, Escherichia coli, Vibrio cholerae, Bacillus subtilis, and Acinetobacter baumannii respectively. The probe was successfully used to develop a fluorescence polarization assay for these six AAAEs and equilibrium dissociation constants were determined in direct binding experiments. Fl-Sal-AMS was effective for AAAEs, which utilize salicylic acid or 2,3-dihydroxybenzoic acid as native substrates, with dissociation constants ranging from 9–369 nM, but was ineffective for AsbC, the AAAE from Bacillus anthracis that activates 3,4-dihydroxybenzoic acid. Competitive binding experiments using a series of ligands including substrates, reaction products, and inhibitors provided the first comparative structure-activity-relationships for AAAEs. The fluorescence polarization assay was then miniaturized to a 384-well plate format and high-throughput screening was performed at the National Screening Laboratory for the Regional Centers of Excellence in Biodefense and Emerging Infectious Diseases (NSRB) against BasE, an AAAE from Acinetobacter baumannii involved in production of the siderophore acinetobactin. Several small molecule inhibitors with new chemotypes were identified and compound 23 containing a pyrazolo[5,4-a]pyridine scaffold emerged as the most promising ligand with a KD of 78 nM, which was independently confirmed by isothermal calorimetry and inhibition was also verified in an ATP-[32P]–pyrophosphate exchange steady-state kinetic assay.
Keywords: Fluorescence Polarization, Adenylation, Aryl Acid Adenylating Enzyme, Siderophore, High-throughput Screening
The emergence of multidrug-resistant strains of bacterial pathogens is a growing problem worldwide that is further compounded by the relative lack of new antibacterial agents, especially for Gram-negative organisms (1). Currently, most clinically used antibiotics act by one of a limited numbers of mechanisms including inhibition of protein-, DNA-, and cell-wall synthesis as well as RNA transcription. Targeting virulence, or the ability of a bacterium to cause disease, represents a novel strategy that fundamentally differs from existing approaches that target essential gene functions (2). Iron acquisition is critical for virulence of almost all known microorganisms since this vital micronutrient is typically abundant in many ecological niches, but highly restricted in a vertebrate host where the concentration is estimated at approximately 10-24 M, which is far to low to support bacterial colonization and growth (3, 4). Thus bacteria have evolved a variety of mechanisms, depending on their distinct niche occupied in the host, to obtain this vital nutrient. Surface pathogens such as Vibrio cholerae that colonize the small intestine, can utilize iron directly via specific ferric receptors, while septic pathogens typically scavenge iron from heme in red blood cells through dedicated hemophore receptors (5, 6). By contrast, many invasive intracellular pathogens such as Mycobacterium tuberculosis, Bacillus anthracis, Yersinia sp., Acinetobacter baumannii, and Escherichia coli obtain iron via an indirect process involving the synthesis, secretion, and reuptake of small molecule iron-chelators termed siderophores (7, 8). Consequently, inhibition of siderophore biosynthesis represents a promising new strategy for antibacterial drug development (8, 9).
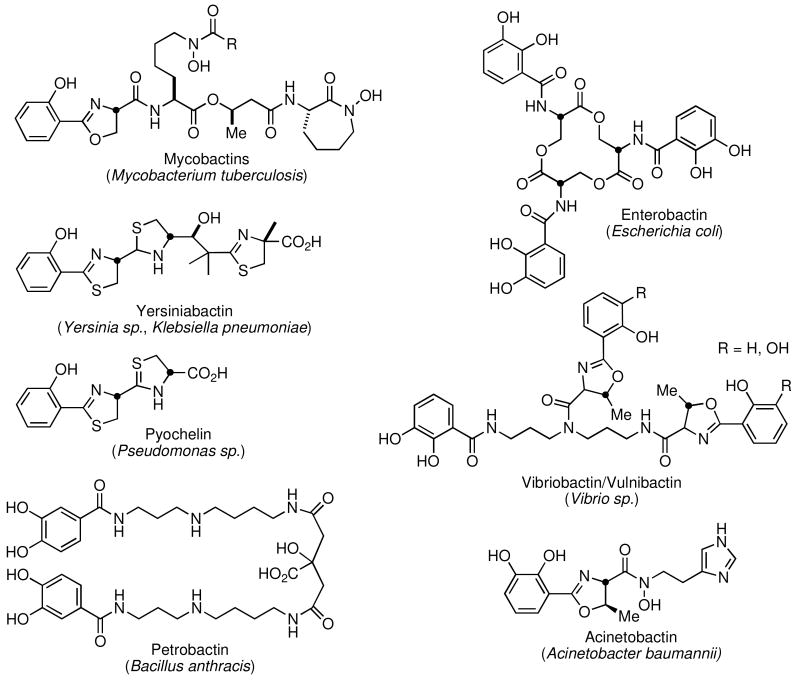
Siderophores are structurally diverse and contain carboxylates, hydroxamates, and/or catechol/phenols for iron coordination (Figure 1) (8). Escherichia coli biosynthesizes the prototypical aryl-capped siderophore enterobactin while Mycobacterium tuberculosis, the leading cause of bacterial infectious disease mortality synthesizes the mycobactins. The potential biowarfare agents Yersinia pestis and Bacillus anthracis, the etiological agents of the plague and anthrax respectively rely on yersiniabactin and petrobactin for iron acquisition in vivo. The most significant emerging Gram-negative nosocomial infections are caused by Klebsiella pneumoniae and Acinetobacter baumannii, which produce the yersiniabactins and acinetobactins respectively.
Figure 1.
Structure of representative aryl-capped siderophores.
Siderophore biosynthesis has been intensively investigated over the last decade revealing two operationally different mechanisms. The best understood is the thiotemplated assembly process catalyzed by nonribosomal peptide synthetases (NRPSs) sometimes in conjunction with polyketide synthases (PKSs), wherein the biosynthetic chain intermediates remain attached to carrier domains during assembly (10). Additionally, many carboxylate- and hydroxamate-containing siderophores such as the prototypical aerobactin (not shown) are synthesized by a non-templated route, referred to as an NRPS-independent pathway, utilizing freely diffusible biosynthetic intermediates (11).
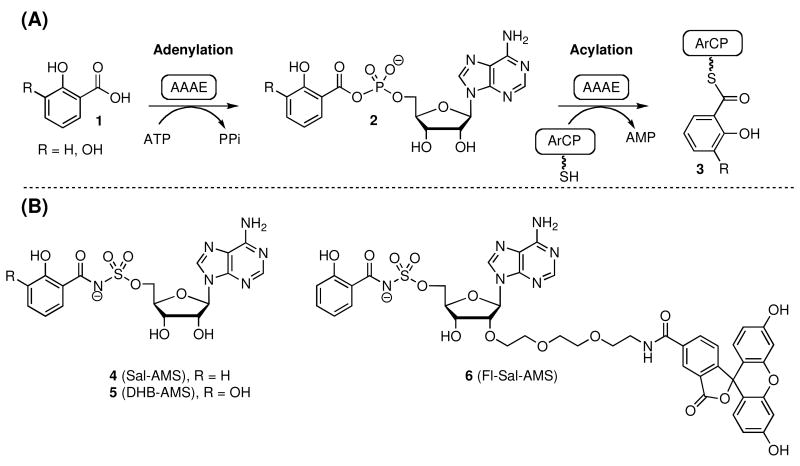
NRPS-templated siderophores biosynthesis is commonly initiated by an aryl acid adenylating enzyme (AAAE) that activates an aryl acid and loads this onto a downstream aryl carrier protein (ArCP) domain (see Table 1 for representative AAAEs and their native substrates) (10). AAAEs are members of the adenylate-forming enzyme superfamily, are typically 50–55 kDa, and contain a large N-terminal domain and smaller C-terminal domain (12). The two-step adenylation/acylation reaction catalyzed by AAAE is shown in Figure 2A (13). In the adenylation half-reaction, the AAAE first binds the substrate aryl acid and ATP, then catalyzes their condensation forming an acyladenylate intermediate and pyrophosphate. The acyladenylate remains tightly bound whereas pyrophosphate dissociates. Next, the AAAE binds the downstream aryl carrier protein (ArCP) domain of the NRPS assembly line and transfers the aroyl moiety onto a nucleophilic sulfur atom of a phosphopantetheinyl cofactor arm, which is attached to a conserved serine residue of the ArCP (Figure 2A).
Table 1.
Aryl-capped siderophores producing pathogens and corresponding AAAEs.
| Organism | Siderophore | AAAE | AAAE Substratea |
|---|---|---|---|
| M. tuberculosis | mycobactin | MbtA | SAL |
| Y. pestis | yersiniabactin | YbtE | SAL |
| Y. pseudotuberculosis | yersiniabactin | YbtE | SAL |
| E. coli | enterobactin | EntE | 2,3-DHB |
| K. pneumoniae | yersiniabactin | YbtE | 2,3-DHB |
| enterobactin | EntE | SAL | |
| P. aeruginosa | pyochelin | PchD | 2,3-DHB |
| V. cholerae | vibriobactin | VibE | 2,3-DHB |
| V. vulnificus | vulnibactin | VibE1 | 2,3-DHB |
| VibE2 | SAL | ||
| A. baumannii | acinetobactin | BasE | 2,3-DHB |
| B. subtilis | bacillibactin | DhbE | 2,3-DHB |
| B. anthracis | petrobactin | AsbC | 3,4-DHB |
SAL, salicylic acid; 2,3-DHB, 2,3-dihydroxybenzoic acid; 3,4-DHB, 3,4-dihydroxybenzoic acid.
Figure 2.
(A) Mechanism of aryl acid adenylation, catalyzed by AAAEs. (B) Chemical structures of Sal-AMS 4, 2,3-DHBAMS 5 and Fl-Sal-AMS 6.
Simple substrate-based mimetics, Sal-AMS 4 and 2,3-DHB-AMS 5 (Figure 1C) of the acyladenylate 2, have been prepared wherein the labile acylphosphate linkage has been replaced by the bioisosteric and chemically stabile acylsulfamate moiety (14-16). Extensive structure-activity-relationships (SAR) of Sal-AMS have systematically explored the impact of the aryl, linker, glycosyl, and base moieties on enzyme inhibition and biological activity toward M. tuberculosis and Yersinia sp. and served to demonstrate the exceptional potency of these bisubstrate inhibitors (15, 17-20). Additionally, a derivative of Sal-AMS incorporating a reactive functional group yielded a mechanism-based affinity probe of aryl carrier proteins (ArCP) relying on the AAAE to channel the inhibitor onto the phosphopantetheinyl cofactor arm of the downstream ArCP (21). Sal-AMS and derivatives have a limited spectrum of activity toward aryl-capped-siderophore-dependent organisms and these highly polar nucleoside derivatives may also suffer from poor pharmacokinetic (PK) behavior. The identification of cell-permeable inhibitors, with improved PK properties that are not substrate-based mimics, is therefore a current goal to validate siderophore biosynthesis as a viable strategy for antibiotic development.
Herein we report the design and synthesis of a fluorescent probe Fl-Sal-AMS 6 (Figure 2B) that has enabled the development of a fluorescence polarization assay for AAAEs. Fluorescence polarization (FP) assays have been increasingly used for studying protein–ligand interactions as these are homogenous, experimentally simple to implement, and can directly provide ligand dissociation constants (22). The equilibrium dissociation constants of FP probe 6 against several AAAEs including MbtA, YbtE, DhbE, EntE, BasE, and VibE were determined and the KD's for MbtA and BasE were independently confirmed via isothermal calorimetry. We also report on the first cloning, expression, and purification of BasE, the AAAE from A. baumannii responsible for incorporation of 2,3-dihydroxybenzoic acid into acinetobactin. Next, the equilibrium dissociation constants of a range of ligands including substrates, inhibitors, and reaction products were determined in a competitive displacement assay for all six aforementioned AAAEs providing the first comparative structure-activity relationships for this class of enzymes. Finally, the assay was miniaturized to a 384-well plate format, optimized for Z′ score (a statistical score that measures assay robustness, see equation 11), and a high-throughput screen of BasE was performed on approximately 85,000 compounds in duplicate at the Institute of Chemical and Cell Biology at Harvard Medical School. Several novel chemotypes were identified from this HTS campaign including a substituted pyrazolo[3,4-b]pyridine that exhibited potent nanomolar enzyme inhibition and represents an attractive lead for further development.
Methods
Cloning, Expression and Protein Purification
MbtA was expressed as an N-terminal SUMO fusion protein and purified as previously described (18). The expression construct for EntE containing an N-terminal (His)6-tag was kindly provided by Prof. Andrew Gulick (Hauptman-Woodward Institute, Buffalo, NY) and expressed and purified as described. The expression construct for AsbC containing an N-terminal (His)6-tag was kindly provided by Prof. David Sherman (University of Michigan, Ann Arbor, MI) and expressed and purified as described (23). VibE, and DhbE, were cloned, expressed and purified as described from genomic DNA purified from Vibrio cholerae (ATCC 39315) and Bacillus subtilis (ATCC 21332) respectively (24, 25).
The basE gene was PCR amplified from genomic DNA purified from Acinetobacter baumannii (ATCC 17978) and cloned into the PCR capture vector pCR2.1 TOPO (Invitrogen). Primers basE forward (GGCATATGAAAAAACAGTTGATTGAG) and basE reverse (GGCTCGAGTTAAGATGTTGTAGATGTATTTAAAATGC) were used to amplify the gene followed by restriction digest with the underlined restriction sites for insertion into pET28b, creating an N-terminal His fusion expression vector. The resulting plasmid pCDD058 was transformed into BL21 STAR (DE3), which was grown in 500 mL of LB containing kanamycin (50 μg/mL) at 37 °C to an OD600 of 0.6. The culture was induced with 0.4 mM IPTG and grown an additional 4 h at 30 °C. Cells were pelleted from the culture media and resuspended in 30 mL lysis buffer (50 mM HEPES, 300 mM NaCl, 10 mM Imidazole pH 8.0) supplemented with 1 mg/mL lysozyme. After 30 min on ice, cells were disrupted using a Branson Sonifier 250 [30% duty for 2 min at each output intensity of 3, 4, and 5] and the lysate was cleared by centrifugation. 50% Ni-NTA (4.0 mL) was added to the cleared lysate and the mixture was incubated at 4 °C for 1 h. The Ni-NTA resin was collected in a gravity column and washed with 16 mL wash buffer (50 mM HEPES, 300 mM NaCl, 20 mM Imidazole pH 8.0). The protein was eluted from the resin using 3 mL elution buffer (50 mM HEPES, 300 mM NaCl, 250 mM Imidazole pH 8.0). The protein was then desalted into storage buffer (10 mM Tris-HCl pH 8.0, 1 mM EDTA, 5% glycerol) using a PD-10 column (GE Healthcare) yielding approximately 80 mg/L by Bradford assay using bovine serum albumin as a standard.
The ybtE gene was PCR amplified from genomic DNA purified from Yersinia pseudotuberculosis (ATCC 907). Primers ybtE gateway forward ( CACCGAAAACCTGTATTTTCAGATGAATTCTTCCTTTGAATC) and ybtE reverse ( CTTATTGGGCAGAATGGCG) were used to amplify the gene for directional cloning into pENTR/D-TOPO (Invitrogen). The resultant gateway entrance vector was recombined using Gateway LR clonase II (Invitrogen) with pDEST17 (Invitrogen) using the manufacturer's instructions to give an N-terminal His fusion protein with a TEV cleavage site (pCDD060). pCDD060 was transformed into BL21 (DE3) pLysS for expression. Cultures were grown in LB containing ampicillin (100 μg/ml) and chloramphenicol (25 μg/ml) to an OD600 of 0.6 followed by induction with IPTG (1 mM) and expression at 18 °C overnight. Purification of YbtE followed the procedure used for BasE and yielded approximately 9 mg/L. YbtE was further purified by FPLC on a resource Q column (GE Healthcare) using the binary buffer system A (50 mM Tris-HCl pH 8.0) and B (50 mM Tris-HCl pH 8.0, 1 M NaCl). The column was washed with 10 column volumes (CV) 0% B after loading YbtE. A 5 CV gradient from 0% to 18% B, followed by further increase to 30% over 30 CV. YbtE eluted at approximately 22.5 mS/cm. The column was washed by further increasing B to 100% over 5 CV. The protein fractions were pooled, concentrated and desalted into storage buffer using Amicon Ultra–15 10,000 MWCO centrifugal filter devices (Millipore).
The His tags of EntE, DhbE, VibE, BasE and YbtE were not removed; however, the SUMO fusion was removed from MbtA as described employing SUMO protease.
ATP/PPi Exchange Assay (26)
Reactions were performed under initial velocity conditions in a total volume of 100 μL. The salicylating enzymes MbtA and YbtE were titrated with Sal-AMS 4 while the 2,3-dihydroxybenzoylating enzymes BasE, EntE, VibE, and DhbE were titrated with 2,3-DHB-AMS 5 in order to attain the accurate enzyme concentration. Titrations were performed in a volume of 100 μL, in assay buffer (75 mM Tris-HCl pH 7.5, 10 mM MgCl2, 2 mM DTT) along with 250 μM salicylic acid (for MbtA and YbtE) or 250 μM 2,3-dihydroxybenzoic acid (for VibE, EntE, DhbE, and BasE) and 0.2 mM ATP, with enough protein to attain a [E]/Kiapp ratio of ∼200. Sal-AMS 4 or 2,3-DHB-AMS 5, (1 μL) in DMSO or DMSO only as a control were added. The reaction components were allowed to equilibrate for 10 min at 23 °C. Reactions were initiated by the addition of 10 μL (0.5 μCi 32PPi, Perkin-Elmer 84.12 Ci/mmol) in 50 mM sodium phosphate buffer pH 7.8 and placed at 37 °C for 20 min. Reactions were quenched by the addition of 200 μL quenching buffer (350 mM HClO4, 100 mM PPi, 1.8% w/v activated charcoal). The charcoal was pelleted by centrifugation and washed once with 500 μL water. The washed pellet was resuspended in 200 μL water, transferred to a scintillation vial, mixed with 5 mL scintillation fluid (RPI), and counted on a Packard Tri-carb 2900TR. The counts from the bound [32P]-ATP were directly proportional to the initial velocity of the reaction. The fractional activity (vi/v0), where vi is the reaction velocity at a given [I] and v0 is the reaction velocity of the DMSO control, versus [I] were fit by linear regression analysis using GraphPad Prism version 4.0 to obtain [E] (27). The determination of the IC50 of compound 23 was performed using the procedure described above with 10 nM BasE, 1 mM ATP and 10 μM 2,3-dihydroxybenzoic acid and a 3-fold serial dilution of 23 from 20 μM down to 9 nM The fractional activity (vi/v0) versus [I] was fit to the four-parameter sigmoidal dose-response equation in GraphPad Prism 4.0 to obtain the IC50 for 23. The steady-state kinetic parameters KM and kcat of 2,3-dihydroxybenzoic acid (2,3-DHB) and salicylic acid for BasE under saturating concentrations of ATP (1 mM) were determined by measuring the initial velocity (v0) as a function of [2,3-DHB] and [salicylic acid] from 100 μM down to 0.78 μM to provide a saturation curve, which was fit by nonlinear regression analysis to the Michaelis–Menten equation.
Sequence Alignment of Aryl Acid-Adenylating Enzymes
The amino acid sequences of the six aryl-acid adenylating enzymes were aligned using the ClustalW2 program(28) and edited with Jalview 2.3 (29).
Fluorescence Polarization Assays
FP measurements were performed on a Molecular Devices SpectraMax M5e (Molecular Devices, Sunnyvale, CA), with excitation and emission wavelengths of 485 and 530 nm, respectively, using PMT sensitivity set to high and 100 readings per well. Assays were performed in flat bottom, black polystyrene 96-well plates (Costar, Corning Inc.), in FP buffer (30 mM Tris-HCl, pH 7.5, 1 mM MgCl2, 1 mM TCEP and 0.0025% Igepal CA-630). Igepal CA-630 (0.0025%) was included to prevent aggregation effects and variation of the meniscus shape in the wells, initially observed for the various protein concentrations tested. The final volume of the assay mixture was 100 μL. All measurements were performed in triplicate. The instrument specific G factor for Fl-Sal-AMS 6 was found to be 1.028 (96-well plate), and used for all anisotropy (A) calculations, according to Equation 1, where I∥ and I⊥ are the fluorescence intensities measured when the excitation and emission polarizers are parallel or perpendicular to one each other, respectively.
| (1) |
Equilibrium Dissociation Constant of Fl-Sal-AMS 6
The dissociation constants between 6 and adenylating enzyme (MbtA, YbtE, EntE, VibE, DhbE, and BasE) were determined in a direct binding experiment. Ligand 6 (20 nM) was titrated with adenylating enzyme and the experimentally observed anisotropies (AOBS) were fit to equations 2 and 3(30) by nonlinear regression analysis using Mathematica 6 (Wolfram Research Inc.) to provide the KD. In equation 2, AOBS is the experimentally measured anisotropy, Q is the ratio of the fluorescence intensity of the probe in the bound and free states, FSB is the fraction of bound 6, AB and AF, represent the anisotropies of bound and free 6, respectively. In Equation 3, KD1 is the equilibrium dissociation constant of compound 6 (FP probe), LST is the concentration of 6, and RT is the receptor protein concentration (30).
| (2) |
| (3) |
Determination of Dissociation Rate Constant of MbtA and Fl-Sal-AMS 6
The dissociation rate constant (koff) of 6 and MbtA was determined by incubating 10 μL of 150 nM MbtA solution and 10 μL of 100 nM 6 in 75 μL of FP buffer for 10 min. at 25 °C, then, 5 μL of 10 μM Sal-AMS solution was added and FP measurements were immediately started in the kinetic mode and taken every 10 s until a plateau was reached. Data was fit to a one-phase exponential decay equation (Equation 4), where AU is the anisotropy of Fl-Sal-AMS at the protein concentration tested, using GraphPad Prism version 4.0, to obtain the koff value. The association rate constant was calculated from the experimentally determined KD and koff (Equation 5).
| (4) |
| (5) |
Determination of Equilibrium Dissociation Constants in Competition Binding Experiments
Displacement of 6 by a panel of ligands was performed for each AAAE (MbtA, YbtE, EntE, VibE, BasE, and DhbE). Negative controls, containing protein and 6 and positive controls (Fl-Sal-AMS only) were also performed in each assay. A three-fold serial dilution of each compound was added to 6 (20 nM final concentration) and AAAE (∼200 nM, concentration adjusted for each AAAE to provide a bound fraction of 6 of at least 50%). The fluorescence anisotropy was measured after a 30 min incubation at 25 °C. The KD's of each compound tested were determined by fitting the displacement curves (AOBS vs. LT) to Equations 2 and 6 where KD2 is the compound's equilibrium dissociation constant and LT the respective concentration(30).
| (6) |
Isothermal Titration Calorimetry
ITC titration experiments were performed with a Microcal VP-ITC titration microcalorimeter (Microcal, Inc.). MbtA and BasE were dialyzed (2 × 1L) against 30 mM Tris·HCl pH 8.0, 1 mM MgCl2, and 1 mM TCEP for 24 h prior to titrations. Protein concentration was determined by active site titration as described. MbtA and 6 were diluted to 6.5 μM and 40 μM respectively with dialysate buffer immediately prior to the experiment. BasE was diluted to 4.0 μM and ligands 6 and 23 were diluted to 60 μM respectively with dialysate buffer immediately prior to the experiment. Protein and ligand solutions were degassed by vacuum aspiration (5–10 min) at rt prior to loading the samples in the ITC cell and syringe. All titrations were carried out at 25 °C with a stirring speed of 264 rpm and a 400–500 s interval between 10 μL injections. The initial injection was not used for data fitting. Titrations were run past the point of enzyme saturation to determine the heat of dilution. The heats of dilution were negligible in all cases and were subtracted from the respective titrations prior to data analysis. Thermodynamic parameters N (stoichiometry), KA (association constant) and ΔH (enthalpy change) were obtained by nonlinear least-squares fitting of the experimental data to the using the Origin software package (version 5.0) provided with the instrument. The free energy of binding (ΔG0) and entropy change were obtained from the Gibbs free energy equation (Equation 7). The affinity of the ligand to protein is given as the dissociation constant (KD = 1/KA). Three independent experiments were performed and analyzed independently, and the thermodynamic values obtained were averaged.
| (7) |
High-Throughput Screening
High-throughput screening of libraries of commercially available compounds was performed against BasE, at the Institute for Chemistry and Cell Biology, Harvard Medical Institute. The assay was performed with 384-well plates (Corning catalogue number 3575) in a final volume of 30 μL, in duplicate. A master mix containing all assay components (30 mM Tris-HCl pH 7.5, 1 mM MgCl2, 1 mM TCEP, 0.0025% (w/v) Igepal CA-630, 200 nM BasE, 20 nM Fl-Sal-AMS) was prepared immediately before the assay. The master mix (30 μL) was dispensed to all wells in the first 23 columns and the master mix (30 μL) containing 1 μM 2,3-DHB-AMS to column 24 of the 384-well plates, using a Matrix Wellmate liquid dispenser. To the first 22 columns of the assay plate were transferred 100 nL of DMSO stock solutions of the compound libraries using a pin array transfer robot (Epson or Seiko). This resulted in a final compound concentration of 25 μg/ml for most compounds tested, with columns 23 and 24 functioning as negative (no displacement) and positive (full displacement) controls, respectively. The plates were shaken for 30 sec on a Lab-Line plate shaker and incubated for 3 h at 25 °C. Fluorescence polarization was then determined in a Perkin-Elmer Envision plate reader with excitation and emission wavelengths of 480 and 535 nm, respectively. The polarization (P, in mP) was calculated using equation 8. Results were normalized by calculating the normalized percent inhibition (Equation 9)(31) plate by plate. A total of 85,045 compounds were screened over 5 days from the following libraries at ICCB: Biomol ICCB known bioactives 2, NINDS custom collection 2, Prestwick 1 collection, Asinex 1 (plates 1671-1705), ChemBridge 3, ChemDiv 4, ChemDiv 3 (plates 1473-1489), Enamine 2, Life Chemicals 1 (plates 1649-1659), Maybridge 5 (plates 1661-1669), Maybridge 4, Peakdale 2 (plate 1305), ChemDiv antimitotic collection (plate 1157). Library descriptions can be found at http://iccb.med.harvard.edu/screening/compound_libraries/index.htm.
| (8) |
| (9) |
The quality of the HTS assay was assessed by calculating the signal-to-noise ratio and the Z′ factor (Equations 10 and 11) (30, 32). In these equations, AU and AF are the top (negative control) and lower (positive control) limits of the anisotropy range at the assay conditions, and σU2 and σF2 are the respective standard deviations.
| (10) |
| (11) |
Selected hit compounds were purchased from Enamine (Kiev, Ukraine), ChemDiv (San Diego, CA) and ChemBridge (San Diego, CA), and the respective KD's determined against BasE using the FP competition assay described above, in the 96-well format.
Docking Studies
The MbtA structure obtained following QM/MM studies of the complex formed between MbtA (homology model) and 5′-O-[N-(2-hydroxybenzoyl)sulfamoyl]-2-phenyladenosine 34 (20) was used for docking studies with Glide (33). Docking was performed on a cubic box of 10 Å side, centered on the active site, using the default XP settings.
Results
Design and Synthesis of FP Probe
The AAAE FP probe design was based on the tight-binding bisubstrate inhibitor Sal-AMS 4 (14, 16, 18). A homology model of MbtA, an AAAE from M. tuberculosis, in complex with Sal-AMS (20), revealed that modification at the 2′-OH group of the ribofuranosyl moiety would likely be tolerated. Analysis of this structure suggested that attachment of an approximately 10 Å long linker at the 2′-oxygen atom of 4 would provide access to the solvent exposed surface of MbtA. Ideally, the linker should be of sufficient length to enable attachment of the sterically bulky fluorophore, yet not too long, otherwise the fluorophore may retain substantial local mobility. The approximately 12 Å triethyleneglycol linker was selected, as polyethers are advantageous over simple linear aliphatic linkers due to their greater aqueous solubility and conformational entropy. Fluorescein is the most commonly used fluorophore in FP assays due to its favorable photophysical properties, which include an optimal fluorescence lifetime (∼4 ns) and a large Stokes shift (45 nm) (30, 34). Based on the aforementioned considerations, Fl-Sal-AMS 6 was targeted for synthesis.
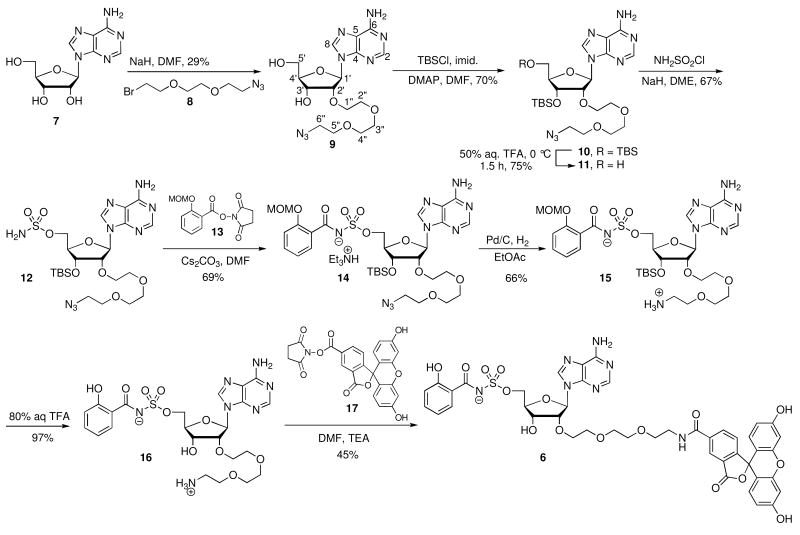
The synthesis of FP probe 6 began with alkylation of adenosine 7 with 2-[2-(2-azidoethoxy)ethoxy]bromoethane 8(35) yielding 9 (Scheme 1). Conversion of 9 to the bis-TBS 10 followed by regioselective deprotection of the primary TBS group by a carefully controlled hydrolysis with 50% aqueous TFA at 0 °C provided alcohol 11 (14). Sulfamoylation of the resultant alcohol furnished sulfamate 12, which was acylated with N-hydroxysuccimidyl (NHS) ester 13 mediated by Cs2CO3 in DMF to yield acylsulfamate 14 as the triethylammonium salt (15, 36). Hydrogenation of the azide in 14 with Pd/C in EtOAc afforded 15, isolated as the zwitterionic compound. Deprotection of the MOM acetal and TBS ether with 80% aqueous TFA furnished 16 that was coupled with the NHS ester of 5-carboxyfluorescein 17 to afford FP probe 6. This synthetic sequence proceeded in 2.0% overall yield from adenosine in 8 steps.
Scheme 1.
Synthesis of Fl-Sal-AMS 6.
Cloning, Expression, and Purification, of AAAEs
MbtA, EntE, and AsbC were overexpressed and purified as previously described (18, 23, 37). The vibE, dhbE, ybtE, and basE genes were cloned and the gene products overexpressed as described in the methods section. SDS-PAGE analysis of the purified enzymes demonstrated bands corresponding to the expected size for each His-tagged protein (see Supporting Information, Figure S1). Enzyme activity of MbtA, YbtE, EntE, VibE, DhbE, and AsbC were accessed using a [32P]-pyrophosphate exchange assay and all proteins exhibited activity commensurate with reported values (23-25, 38-40). BasE has not been previously biochemically characterized and exhibited substrate specificity consistent with predicted function providing KM and kcat values at saturating ATP concentrations of 1.51 ± 0.30 μM and 207 ± 9 min-1 for 2,3-DHB and 13.2 ± 1.9 μM and 75 ± 3 min-1 for salicylic acid (see Supporting Information, Figures S2–S3). However, BasE did not support pyrophosphate exchange (kcat < 1 min-1) with benzoic acid and 3,4-dihydroxybenzoic acid at substrates concentrations of 200 μM. For comparision, the prototypical aryl acid adenylating enzyme EntE, whose native substrate is also 2,3-DHB, is reported to have similar steady state kinetic values for 2,3-DHB (KM = 2.7 μM, kcat = 330 min-1), salicylic acid (KM = 91, kcat = 150 min-1), and benzoic acid (kcat < 1 min-1) (40).
Determination of KD for Fl-Sal-AMS 6
The equilibrium dissociation constants (KD) of 6 with adenylating enzymes MbtA, YbtE, VibE, BasE, EntE, and DhbE were determined in direct binding experiments by titration of 20 nM ligand 6 with the respective adenylating enzyme. The concentration of a FP ligand should not be much greater than 2 × KD, in order to prevent the stoichiometric titration of the ligand (41). Thus, as the KD for MbtA (9.3 nM) was lower than the probe concentration, this experiment was repeated over a range of probe 6 concentrations (5, 10, and 15 nM), which yielded identical results (data not shown). Representative experimental data and the fitted curve for MbtA are shown in Figure 3, for 20 nM of probe 6.
Figure 3.
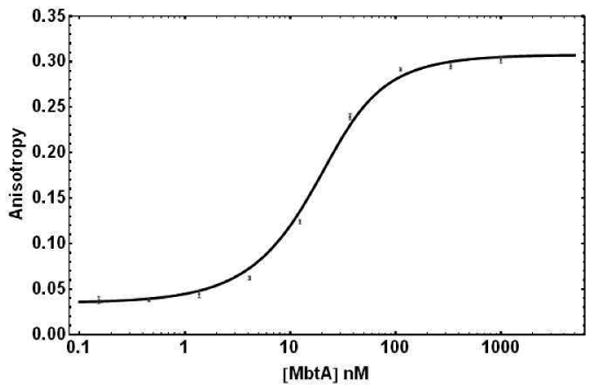
Direct binding of 20 nM Fl-Sal-AMS 6 to MbtA as measured by fluorescence polarization. Experimental points are shown with error bars, and the line is the result of fitting data to Equations 2 and 3.
The equilibrium dissociation constants of Fl-Sal-AMS with the six adenylating enzymes (Table 2) varied significantly, from 9.3 to 369 nM. The lowest values were obtained for the two adenylating enzymes that use salicylic acid as substrate (MbtA and YbtE). Binding of Fl-Sal-AMS was weaker for the four enzymes that use 2,3-dihydroxybenzoic acid, especially for EntE and DhbE.
Table 2.
AAAE FP Parameters for Fl-Sal-AMS 6.
| Protein | KD (nM) | Q | AB |
|---|---|---|---|
| MbtA | 9.26 ± 0.55 | 1.07 | 0.308 ± 0.002 |
| YbtE | 57.6 ± 3.4 | 1.07 | 0.240 ± 0.002 |
| EntE | 221 ± 8 | 1.21 | 0.210 ± 0.001 |
| BasE | 84.3 ± 6.3 | 1.02 | 0.222 ± 0.002 |
| VibE | 85.5 ± 5.6 | 1.27 | 0.200 ± 0.002 |
| DhbE | 369 ± 33 | 0.89 | 0.213 ± 0.005 |
The Q value, which is given by the ratio between the fluorescence intensity of the FP probe bound and free respectively, was very close to unity for MbtA, YbtE and BasE, showing that the fluorescence intensity of Fl-Sal-AMS is not significantly affected upon binding to these proteins (30). By contrast, EntE and VibE showed Q values of 1.21 and 1.27 respectively, whereas DhbE appears to slightly decrease the fluorescence of Fl-Sal-AMS, with a Q value of 0.89. The anisotropy of 6 when fully bound to protein (AB) was approximately 0.32 for MbtA, and substantially lower for other adenylating enzymes YbtE, EntE, BasE, VibE and DhbE, ranging from 0.20–0.24 suggesting greater local mobility of the protein–bound probe in the latter. Nevertheless, the large changes in anisotropy between free (0.03–0.04) and bound (0.20–0.31) probe were significant in all cases and enabled the successful development of a competitive displacement assay for all enzymes. The fluorescence anisotropy of Fl-Sal-AMS did not show a significant change in presence of up to 5 μM AsbC, the AAAE from Bacillus anthracis, which uses 3,4-dihydroxybenzoic acid as aryl acid substrate (data not shown).
Isothermal Titration Calorimetry
An accurate value of the FP probe KD is important to determine KD of ligands in competitive binding assays. Therefore, the KD's of 6 with MbtA and BasE were independently determined by isothermal calorimetry in triplicate, which afforded a KD of 16.5 ± 2.5 nM for MbtA and 178 ± 11 nM and BasE. The KD values determined by ITC were in relatively close agreement and less than 2-fold higher than found by FP. The ITC experiments confirmed binding proceeds with and 1:1 stoichiometry and also provided values for ΔH of −9.80 ± 1.06 kcal/mol (MbtA) and −4.88 ± 0.17 kcal/mol (BasE) as well as TΔS values of 0.71 ± 0.80 kcal/mol (MbtA) and 4.41 ± 0.18 kcal/mol (BasE). Representative ITC data for BasE and ligand 6 are shown in Figure 4.
Figure 4.
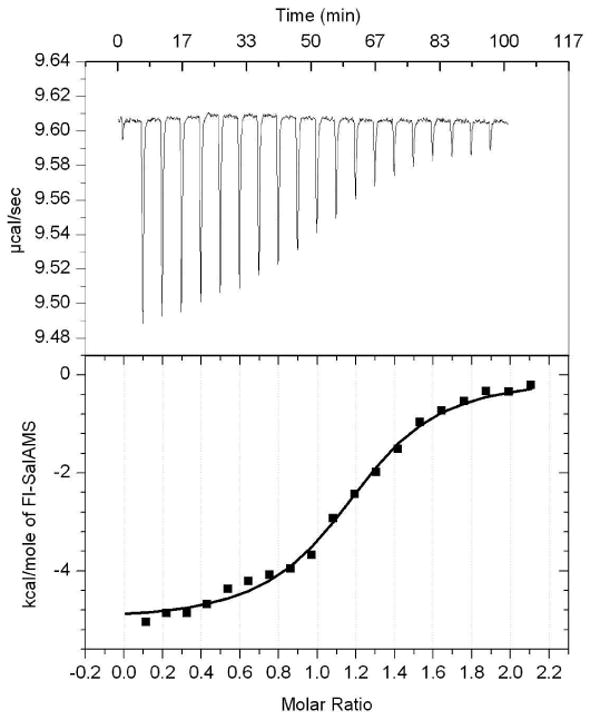
ITC data obtained for BasE, titrated with Fl-Sal-AMS 6.
Impact of Control Parameters
In order to optimize incubation time one needs to have information on the kinetics of ligand displacement. Tight binding ligands are often characterized by slow dissociation rates and consequently require long incubation times to reach equilibrium in displacement experiments. The FP probe provides a convenient spectroscopic handle to assess binding kinetics. The dissociation rate constant was measured under conditions where reassociation of the ligand 6 was negligible (Figure 5). This was accomplished by adding tight-binding ligand 4 to a solution of 6 and MbtA (the tightest-binding AAAE) such that the ratio of [4]/KD2 to [6]/KD1 was approximately 500,000. The time-dependent change in anisotropy was fit to a monoexponential decay equation to provide a koff = 0.51 ± 0.02 min-1 and t1/2 = 1.37 min. Thus incubation of all assay components for 30 minutes (i.e. > 8 × t1/2) was found to be sufficient to reach equilibrium for MbtA. Similar analysis with the other adenylating enzymes confirmed the rapid binding kinetics and demonstrated that a 30 minute incubation was sufficient to reach equilibrium (data not shown). Based on the experimentally determined values for KD and koff, we estimated kon from Equation 5 as 9.1 × 10⁵ M-1s-1 providing a half-life for association (t1/2) of approximately 4 seconds under the pseudo-first order conditions employed ([6]0 = 20 nM, [MbtA]0 = 200 nM) (42). This result is consistent with our observation of complete binding within 30 seconds (data not shown), which corresponded to the earliest possible initial time point of anisotropy measurements. The FP measurements remained unchanged over a 24 hour period and FP was measured at a single time point, 30–60 minute after mixing the assay mixture components, in both the direct binding and competition assays.
Figure 5.
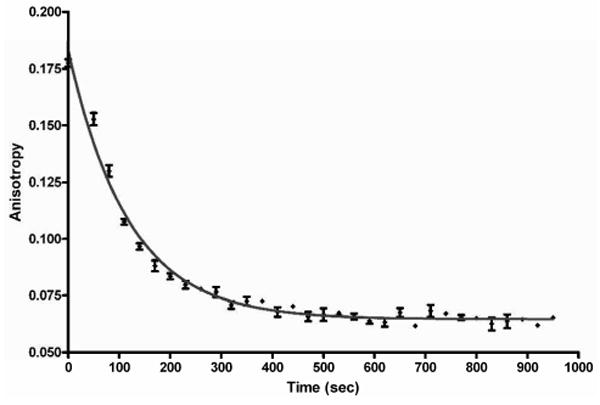
koff determination for Fl-Sal-AMS 6 and MbtA by fluorescence polarization.
The influence of increasing amounts of DMSO, commonly used as a co-solvent was also assessed in this work. Concentrations up to 10% (v/v) DMSO in the FP assay for all enzymes studied were tested, following the procedure described for the competitive displacement assay. DMSO concentrations up of to 2% were well tolerated by all enzymes, with anisotropy values within ± 5% of the control with no DMSO present. However, higher DMSO concentrations in the assay mixtures resulted in more substantial changes in anisotropy and were avoided to prevent misleading results.
Equilibrium Dissociation Constants Using FP Competitive Binding Assay
Next, competitive binding assays were performed with a range of ligands against each AAAE to provide comparative structure-activity relationships (SAR) for this class of adenylating enzymes (Figure 6 and Table 3) and to evaluate assay performance. Assay conditions, in particular the protein concentration employed, were chosen based on the direct binding assays results, in order to furnish a bound probe fraction (FSB) ≥ 0.5, so that the anisotropy variation during the competition assay (i.e. the anisotropy change caused by complete displacement of the probe by test ligand) was significant. Based on this consideration the final protein concentrations chosen were of 50 nM for MbtA, 100 nM for YbtE, 250 nM for EntE, 200 nM for BasE, 100 nM for VibE and 275 nM for DhbE. In FP competition assay for HTS, optimal protein concentrations should be carefully calculated depending on the putative target inhibitor KD's according to the tools developed by Roerhl and co-workers (30, 43).
Figure 6.
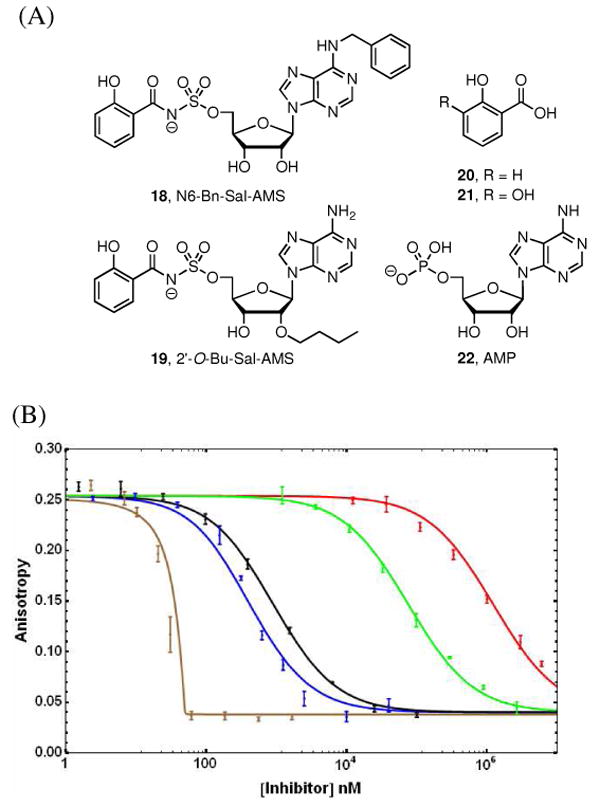
(A) Structure of ligands evaluated in competitive displacement assay. (B) Competitive displacement analysis of 6 from MbtA by various ligands: Sal-AMS 4 (brown), 6-Bn-Sal-AMS 18 (black), 2′-O-Bu-Sal-AMS 19 (blue), salicylic acid 20 (green) and AMP 22 (red). Experimental data is shown as the average and standard error of triplicate experiments. Lines resulted of fitting experimental data to equations 2 and 3, except for Sal-AMS, where the respective KD, independently determined by ITC, was used to generate the line.
Table 3.
Calculated Ligand-Protein Dissociation Constants (KD2 in nM).
| Compound | 4 | 5 | 18 | 19 | 20 | 21 | 22 |
|---|---|---|---|---|---|---|---|
| Protein | |||||||
| MbtA | n.d.a | n.d. | 136 ± 8 | 59.6 ± 4.3 | (11.9 ± 0.5) × 103 | > 300 × 103 | (183 ± 10) × 103 |
| YbtE | n.d. | n.d. | 1.34 ± 0.29 | 199 ± 17 | (43.7 ± 3.1) × 103 | (324 ± 25) × 103 | (260 ± 23) × 103 |
| EntE | 33.6 ± 6.0 | n.d. | 733 ± 45 | 696 ± 77 | (211 ± 22) × 103 | (8.18 ± 0.66) × 103 | (125 ± 14) × 103 |
| BasE | 16.7 ± 3.1 | n.d. | 87.6 ± 18.2 | 601 ± 153 | (57.5 ± 3.6) × 103 | (2.63 ± 0.18) × 103 | (173 ± 13) × 103 |
| VibE | n.d. | n.d. | 8.83 ± 1.29 | 475 ± 46 | (36.6 ± 3.6) × 103 | (1.64 ± 0.09) × 103 | (12.0 ± 1.0) × 103 |
| DhbE | −b | n.d. | (1.86 ± 0.22) × 103 | 401 ± 69 | − | (3.76 ± 0.65) × 103 | − |
not determined since the displacement curve could not be fit due to the tight-binding nature of the ligand.
Experiment not performed.
Dissociation constants against each adenylating enzyme were successfully determined for Sal-AMS derivatives 18 and 19, the substrates salicylic acid (SAL, 20) and 2,3-dihydroxybenzoic acid (2,3-DHB, 21) as well as the enzymatic reaction product adenosine monophosphate (AMP, 22) (Figure 6A). The parent compound Sal-AMS 4 and also 2,3-DHB-AMS 5 were confirmed to be potent tight-binding ligands for all adenylating enzymes investigated with KD's of 4 with EntE and BasE of 16.7 and 33.6 nM respectively. On the other extreme, the enzymatic reaction product AMP 22 was a weak ligand for all adenylating enzymes employed with KD's from 12–260 μM. In most cases, complete displacement was not achieved due to solubility limitations, but the partial displacement curves were successfully fit to equations 2 and 6 to provide the calculated KD (Figure 6B). The native aryl acid substrates salicylic acid (20, for MbtA and YbtE) and 2,3-dihydroxybenzoic acid (21, for EntE, BasE, VibE and DhbE) displayed moderate micromolar affinity to the respective enzymes with KD's of 1.6–43.7 μM, comparable to the reported KM values of these ligands and their cognate AAAE (24, 38). In all cases, the native aryl acid substrate for each AAAE was preferred. The extra hydroxyl group in 2,3-dihydroxybenzoic acid provided enhanced binding affinities relative to salicylic acid for AAAEs, thus the KD of salicylic acid varied from 11.9–43.7 μM for the salicylating enzymes MbtA and YbtE whereas the KD of 2,3-dihydroxybenzoic acid for the 2,3-dihydroxybenzoylating enzymes VibE, BasE, EntE, and DhbE was lower and varied from 1.6–8.2 μM. Evaluation of 18 revealed dramatic differences in activity between the adenylating enzymes. Among the salicylate adenylating enzymes, YbtE exhibited a KD 93-fold lower than MbtA suggesting important differences in the space available at the nucleoside-binding subdomains of these proteins. The 2,3-dihydroxybenzoylating enzymes EntE, BasE, VibE, and DhbE similarly showed a great variation in affinity for 18 with KD's ranging from 8–1860 nM. By contrast, 19 showed more modest changes in binding affinity across the six AAAEs, with MbtA displaying a KD of 59.6 nM that was 3–12 fold lower than the remaining enzymes examined. The finding that 19 displayed lower affinity than fluorescent probe 6 toward each adenylating enzyme suggests the 2′-O-ether linkage of 2 augments binding. Overall, these results show that FP-probe 6 is useful to accurately discriminate ligands spanning a range of KD's over 5-orders of magnitude against the six AAAEs investigated.
Evaluation of Statistical Parameters
The FP competition assay quality was assessed by calculating the signal-to-noise ratio (S/N) and Z′ factor for all protein/inhibitor pairs, according to Equations 11 and 12. The Z′ factor reflects the assay dynamic range and the data variation associated with the signal measurements (32). Z′ factors in the 0.5 to 1.0 range are considered excellent and that was the case for all the AAAEs and assay conditions described here (> 0.7 for all enzymes, in the 96-well plate based assay). The signal-to-noise ratio was also large (greater than 15 in all cases) giving good prospects for the use of this assay in high-throughput screening.
High-Throughput Screening of Libraries of Commercially Available Compounds
Based on the successful results obtained with Fl-Sal-AMS in a 100 μL 96-well format, the assay was miniaturized to a 30 μL 384-well plate format. A total of 85,045 compounds were screened in duplicate from libraries of commercially available compounds against BasE at the Institute for Chemistry and Cell Biology (ICCB) at Harvard Medical School. The assay performed extremely well with a calculated Z′ factor of 0.866. The normalized percent inhibition (NPI)(31), calculated for each experimental well, plate by plate, based on the respective positive and negative controls, was chosen as a scoring function to eliminate plate-to-plate variation. Library compounds, which exhibited NPI values larger than 25% in both assay replicates were initially selected for further analysis. This resulted in a set of 145 compounds, which were checked for possible auto-fluorescence or fluorescence quenching. This resulted in a final hit list of 92 compounds, a hit rate of 0.108%. A medicinal chemistry-oriented structural inspection of the hit list resulted in the selection of 29 compounds, which were purchased from the respective suppliers for further evaluation.
Table 4 summarizes the results obtained for the top eleven confirmed hits (23–33), with the respective structures, average NPI observed during the HTS and experimentally determined KD. The top-scoring hit 23 possessed an impressive KD of 78 ± 7 nM against BasE as determined using the FP displacement assay and was independently confirmed by ITC, which provided a KD of 99 ± 13 nM. Additionally 23 exhibited inhibition (IC50 = 420 nM) in a steady-state kinetic ATP/PPi exchange assay. The remaining hits from the HTS were structurally varied, but significantly weaker than 23 with KD ranging from 2.86 to 29.3 μM (Table 4). Interestingly, compound 29 had the same pyrazolo[3,4-b]pyridine scaffold as compound 23, but with a different substitution pattern and much lower KD (20.2 μM). Another scaffold yielded four compounds in the top 11 hits (27, 28, 30 and 33), with KD ranging from 14.1 to 29.3 μM.
Table 4.
Structure, NPI, and KD's of top hits discovered in HTS against BasE.
| Compound # | Structure | NPI (%)a | KD (μM)b |
|---|---|---|---|
| 23 | 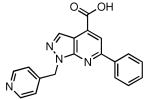 |
99 | 0.078 ± 0.007 |
| 24 |  |
80 | 2.86 ± 0.24 |
| 25 |  |
78 | 4.22 ± 0.28 |
| 26 |  |
76 | 4.95 ± 0.50 |
| 27 |  |
58 | 14.1 ± 1.6 |
| 28 |  |
61 | 15.0 ± 1.0 |
| 29 | 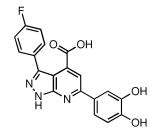 |
42 | 20.2 ± 1.3 |
| 30 |  |
44 | 22.1 ± 1.4 |
| 31 |  |
59 | 23.8 ± 1.8 |
| 32 | 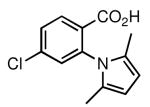 |
85 | 28.6 ± 2.1 |
| 33 |  |
40 | 29.3 ± 3.1 |
The NPI values determined from HTS data.
KD determined by a FP competitive binding assay in triplicate. Values represent the mean and standard error.
Discussion
AAAEs as Targets for Siderophore Biosynthesis Inhibition
Inhibition of siderophore biosynthesis represents an attractive strategy for antibacterial drug development due to the documented in vivo requirement of siderophores for virulence (8). Among the numerous enzymes involved in siderophore biosynthesis, aryl acid adenylating enzymes (AAAEs) have been intensively investigated due to the lack of human homologues, available structural information, and knowledge of enzyme mechanism (14-16, 44). AAAEs generally catalyze the first step of aryl-capped siderophore biosynthesis; however, installation of the aryl-cap moiety in petrobactin biosynthesis can proceed either as the first or last step due to the relaxed substrate specificity of AsbC, the AAAE in B. anthracis (23, 45). The acyladenylate mimics Sal-AMS 4 and 2,3-DHB-AMS 5 are potent bisubstrate AAAE inhibitors and possess in vitro antibacterial activity against M. tuberculosis, Y. pestis, and Y. pseudotuberculosis (14, 18). The observed minimum inhibitor concentrations (MICs) of Sal-AMS are several orders of magnitude above the Kiapp values for MbtA and YbtE demonstrating that intrinsic resistance mechanisms such as low permeability and presence of drug efflux pumps likely play a significant role in attenuating the effectiveness of these highly polar nucleoside derivatives. Small molecule AAAE inhibitors with favorable pharmacokinetic properties will be essential to elucidate the role that siderophores play in establishing and maintaining infection by pathogenic microorganisms in vivo.
New AAAE Inhibitor Chemotypes Discovered by High-Throughput Screening
Adaptation and miniaturization of the FP competition assay to a 384-well, 30 μL format, provided a robust HTS assay, with an excellent Z′ factor and high signal to noise ratio. BasE, the adenylating enzyme from A. baumanii was chosen as target for HTS due to excellent yields obtained in the respective heterologous expression in E. coli (80 mg/L culture), and also the increasing importance of this bacterial strain in multidrug-resistant bacterial infections (46). Initial identification of positive results (compounds that caused a displacement of Fl-Sal-AMS greater than 25%) yielded a set of 145 compounds, which were further reduced to a final list of 92 structurally diverse compounds by removing false positives, which we defined as compounds that caused a change in fluorescence intensity greater than 10% when compared to the average of the plate. The pyrazolo[5,4-a]pyridine scaffold of compound 23 appears as the most promising compound of a new generation of AAAE inhibitors, given its impressive BasE inhibition, observed both with the FP and the kinetic ATP/PPi exchange assay, and potential for SAR studies. Several of the top compounds identified such as 24–26 are promising given their low micromolar KD's as well as the homologous series 27, 28, 30 and 33.
Compound 23 bears a striking resemblance to 2-Ph-Sal-AMS 34, the most potent AAAE inhibitor yet identified (Figure 7) (20). In order to gain an insight of the binding mode of 34 to BasE, docking studies were performed on our MbtA homology model as described since the active sites are essentially identical (20). Our expectation was that that the pyrazolo[5,4-a]pyridine of 23 would dock into the nucleobase binding pocket of MbtA projecting the phenyl group analogously to 34 while we anticipated the pyridyl substituent would occupy the binding pocket occupied by the ribose moiety of 34. Indeed we have shown that the 2′-OH, 3′-OH, and ribofuranosyl ring oxygen are dispensable for potent activity (18). However, the docking result shows a binding mode different than expected based on the structural similarities between 23 and 34. The docked pose of 23 is shown in Figure 7, superimposed on the conformation of 34 bound to MbtA, as determined in our previous studies (20). In this model, the phenyl group of the pyrazolo[5,4-a]pyridine scaffold of 23 is placed in the salicylic acid binding pocket while the carboxylate is positioned precisely at the location of the negatively charged nitrogen atom of the sulfamate linker in 34. The pyrazolo[3,4-b]pyridine ring and 4-methylpyridine ring of 23 partially fill in the sugar and nucleobase binding regions of MbtA.
Figure 7.
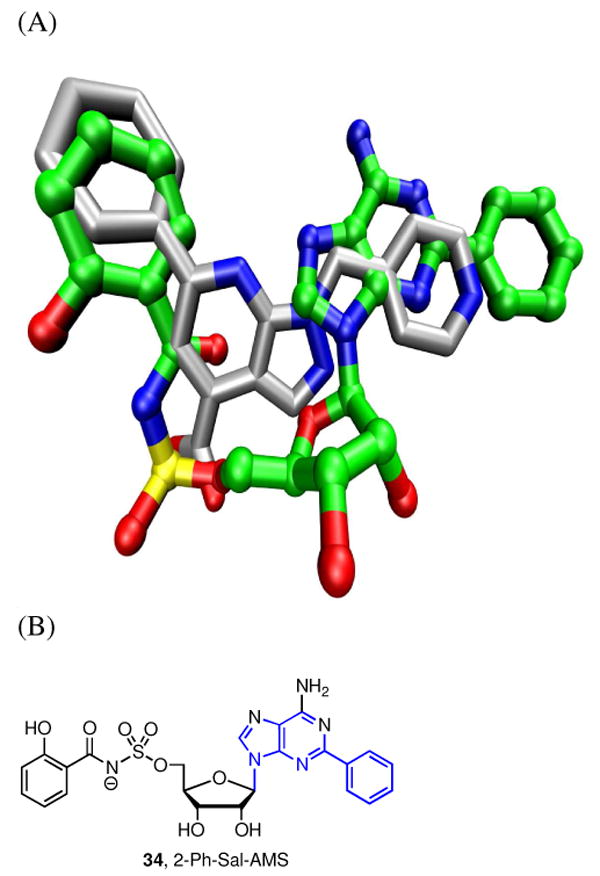
(A) Docked pose of 23 (grey, tube) superimposed on the MbtA-binding conformation of 34(20) (green, ball and stick) in a previously described model. (B) Structure of 2-Ph-Sal-AMS 34. The scaffold common to both compounds is shown in blue in the structure of 34.
Identification of False Positives in HTS
Autofluorescence and fluorescence quenching of test compounds is commonly observed in high-throughput screening campaigns with FP assays, and is illustrated in Figure 8, where the NPI calculated for all wells containing library compounds was plotted against fluorescence intensity. The fluorescence intensities of most wells were in the range of 2.7–3.2 × 10⁷ counts. Also noticeable is the significant number of possible auto-fluorescent compounds that caused an increase in fluorescence intensity (compared to the average values), and a much smaller number of compounds that quenched the fluorescence of Fl-Sal-AMS. Negative NPI values are caused by compounds that caused an increase in FP when compared to the negative control, a fact that might have been due to solubility issues. Compounds that caused a change in fluorescence intensity greater than 10% were considered false positives.
Figure 8.
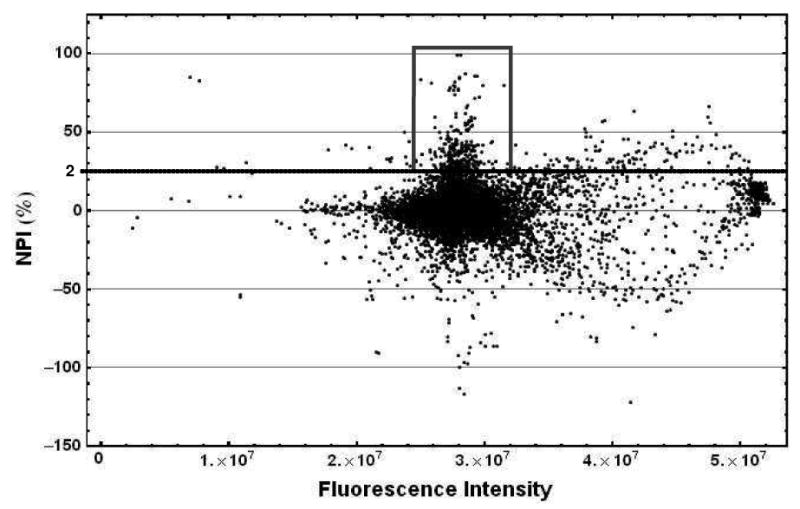
Plot of the normalized percentage inhibition versus fluorescence intensity for all the wells containing library compounds in the HTS performed against BasE. The box shows the position of the hit compounds in the screening, namely those with NPI > 25% and fluorescence intensity within +/- 10% of the average value for the plate.
Fl-Sal-AMS as a FP Probe for AAAEs
Fl-Sal-AMS was specifically designed for aryl acid adenylating enzymes such as MbtA and YbtE, that utilize salicylic acid as aryl acid substrate. Fl-Sal-AMS bound tightly to both enzymes with KD's of 9.3 and 57.6 nM respectively. Fl-Sal-AMS also bound to four AAAEs (DhbE, EntE, VibE and BasE) that utilize 2,3-dihydroxybenzoic acid as a native aryl acid substrate with KDs in the range of 84–369 nM. However, Fl-Sal-AMS was ineffective for AsbC, which uses 3,4-dihydroxybenzoic acid, consistent with earlier substrate specificity studies (23). In the case of MbtA, the KD value of 9.3 nM was below the Fl-Sal-AMS concentration of 20 nM, therefore this result was confirmed by performing the FP direct binding assay at lower probe concentrations and independently by isothermal calorimetry.
Having accurately determined the KD of Fl-Sal-AMS against six AAAEs in direct binding experiments, the probe was used in competitive displacement experiments to determine the KD's of a range of ligands including substrates, reaction products and inhibitors. Dissociation constants of the substrates salicylate (SAL, 20) and 2,3-dihydroxybenzoate (2,3-DHB, 21) as well as the reaction product adenosine monophosphate (AMP, 22) were successfully determined for all six AAAEs. In general, 2,3-DHB was a more potent ligand for AAAEs that utilize 2,3-DHB as the native substrate than SAL with its cognate AAAEs due to the presence of an additional hydrogen-bonding interaction. Adenosine monophosphate was an extremely weak ligand for MbtA, YbtE, EntE and BasE with KD's ranging from 125–260 nM; however, AMP was substantially more potent for VibE with a KD of 12 μM. The inability to obtain KD values for Sal-AMS 4 and 2,3-DHB-AMS 5 was not due to data quality issues, but rather to the intrinsic limitations of FP displacement assays, as the lower limit of the resolvable inhibitor potency is approximately equal to the KD of the fluorescent ligand (41). In all cases complete displacement of Fl-Sal-AMS by 4 and 5 was observed. However, Fl-Sal-AMS successfully was used to determine the KD's of the inhibitors N6-Bz-Sal-AMS 18 and 2′-O-Bu-Sal-AMS 19. While 19 showed relatively little variation between the six AAAE examined with KD's varying only 12-fold from 60 nM for MbtA to 696 nM for EntE, considerable more variation in potency was observed for 18 where the KD's varied almost 1400-fold from 1.34 nM for YbtE to 1.86 μM for DhbE. We have previously reported the existence of a relatively small hydrophobic pocket adjacent in MbtA to the N6-amino group of Sal-AMS based on the crystal structure of DhbE with 2,3-DHB-AMP (20, 47). We found that the optimal size for an alkyl substituent at this position was cyclopropyl, with ligand potency for MbtA sharply decreasing for larger groups, including the N6-benzyl moiety in 18 (20). Analysis of the protein sequence alignment (Figure 9) shows that the residues that form this pocket are conserved in the six adenylating enzymes reported here, namely G304, K309, Q328, V329 and Q353 (DhbE numbering). The significant differences in binding affinity are most likely caused by mutations in more remote residues, which modulate the available space in the nucleoside binding pocket.
Figure 9.
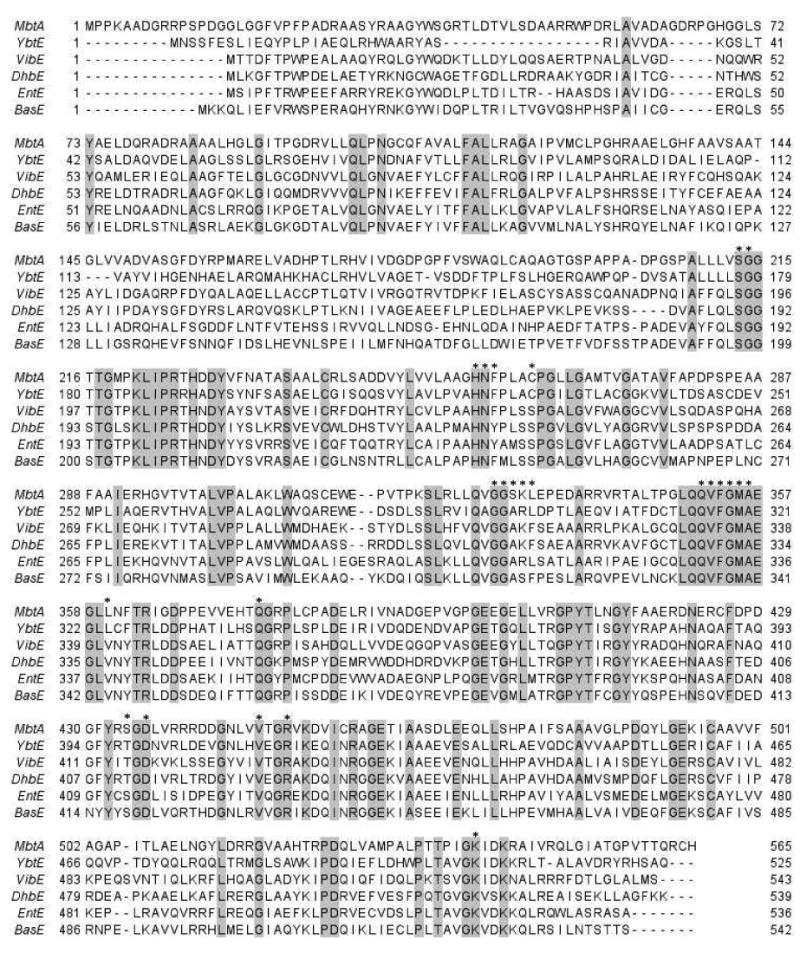
Sequence alignment of the aryl acid-adenylating enzymes (AAAE) evaluated in the present work. MbtA (M. tuberculosis), YbtE (Yersinia pestis), VibE (Vibrio cholerae), DhbE (Bacillus subtilis), EntE (Escherichia coli), BasE (Acinetobacter baumanii), with Genbank accession numbers NP_216900, NP_405468, AAC45927, NP_391078, NP_415126 and CAM86025, respectively. Residues within 4 Å of 2,3-DHBAMS 5 in the respective crystal structure(47) are marked with an asterisk. Alignment was performed with ClustalW2 (28), and edited with Jalview 2.3 (29).
AAAE Sequence Analysis and Comparison
The sequences of the six AAAEs evaluated in the present work, MbtA (M. tuberculosis), YbtE (Yersinia sp.), VibE (V. cholerae), DhbE (Bacillus sp.), EntE (E. coli) and BasE (A. baumanii), were aligned in order to gain insight into the differences in active-site residues of these proteins (Figure 9). Sequence alignment scores varied between 37% (DhbE–MbtA and BasE-YbtE pairs) and 55% (BasE–EntE). Of the 23 aminoacid residues within 4 Å of 2,3-DHB-AMP 2, in the co-crystal structure with DhbE (47), only seven are not conserved in the other five AAAEs. The key variation is S240C (for ease of interpretation using the DhbE X-ray structure, residues are numbered as in the DhbE sequence), observed for the two salicylic acid-utilizing enzymes, MbtA and YbtE. The hydroxyl group of S240 in VibE, DhbE, EntE and BasE is hydrogen-bonded to the meta-hydroxyl group of 2,3-DHB-AMP 2. The corresponding residue is a cysteine in MbtA and YbtE and therefore a weaker hydrogen-bonding partner. Furthermore, the nearby V337L substitution in both MbtA and YbtE reduces the space available for the meta-hydroxyl group. Together residues S240 and V337 likely contribute to the specificity differences between the salicylating (MbtA, YbtE) and 2,3-dihydroxybenzoylating (DhbE, BasE, VibE, EntE) proteins. The remaining variations at Y237, A308, K309, F310, and Y411 occur in residues whose sidechains do not interact directly with the ligand in the DhbE crystal structure. Therefore, these mutations in addition to others in the proteins are likely responsible for potential differences in active site shape and available space.
Adenylation Assays
Several assays have been described to measure adenylation activity including the previously described ATP/PPi exchange radioassay, as well as two coupled spectrophotometric assays that measure the formation of PPi and AMP based on the two-step reaction as shown in Figure 2A (48-50). However, the relatively complex nature of these assays (a third enzyme has to be added to measure PPi or AMP formation) coupled with the requirement for relatively high protein concentrations are the main drawbacks. By contrast, the FP assay described herein was exceptional due to: 1) the ability to identify a large structurally diverse number of inhibitors, 2) capacity to discriminate a wide range of KDs spanning five orders of magnitude, 3) experimental simplicity (mix and measure, two dispensing steps) and 4) assay robustness (the signal was stable from 30 min to 24 h). Another advantage of FP assays is the propensity to find active-site directed inhibitors of target enzymes. On the other hand, FP displacement assays are typically less likely to identify noncompetitive and uncompetitive inhibitors as could be found for instance in a steady-state kinetic assay. A limitation of the competition binding assay using Fl-Sal-AMS in particular, and any FP probe in general, lies in the determination of KD values of compounds, which bind to the protein target significantly more tightly than the probe itself as observed with both Sal-AMS and 2,3-DHBAMS toward the six AAAEs evaluated here (41).
FP assays require a fluorescently labeled active-site directed probe that generally requires a priori substantial structural knowledge of the target protein and previously identified ligand, neither of which is often available. Adenylate-forming enzymes by definition form a tight-binding acyladenylate intermediate, which can be easily mimicked by replacing the labile phosphate linkage with a sulfamate moiety to rapidly generate a potent ligand. Attachment of a fluorophore via the 2′-alcohol or to the nucleoside at the C-2 positions is readily performed enabling the preparation of a FP ligand for adenylate-forming enzymes. Adenylate-forming enzymes are ubiquitous in microorganisms and eukaryotes, where they are involved in protein synthesis (aminoacyl-tRNA synthetases), DNA synthesis (DNA ligases), coenzyme A biosynthesis (PanC), secondary metabolite biosynthesis (adenylation domains from NRPSs), protein degradation (E1 adenylating enzyme in the ubiquitin/proteosome pathway), and lipid metabolism (lipid catabolism via CoA synthetases and lipid biosynthesis via long-chain fatty acid adenylatine enzymes in Corynebacterineae) among numerous other biochemical processes. Thus, we expect the FP probe design and assay reported here to be widely applicable.
In this study, we have shown that the fluorescence polarization (FP) ligand Fl-Sal-AMS was an effective probe against six AAAEs enabling the determination of ligand dissociation constants spanning five orders of magnitude from low nanomolar to high micromolar. Significantly, the first comparative structure activity relationships of AAAE ligands against a large panel of AAAEs were reported and helped to define overall similarities between homologous AAAE proteins in terms of their ligand specificity as well as highlight differences such as found with ligand 18, whose binding affinity varied over 1000-fold between AAAEs. Knowledge of AAAE ligand specificity is central to developing inhibitors of AAAEs and also provides opportunities to enhance potency of the described nucleoside inhibitor Sal-AMS for a particular AAAE. High-throughput screening of the fluorescence polarization assay was successfully performed against BasE from Acinetobacter baumannii, an emerging nosocomial Gram-negative infection and several non-nucleoside small molecule inhibitors were identified and confirmed in competitive binding experiments. Pyrazolo[5,4-a]pyridine 23 emerged as the most promising ligand from this HTS campaign due to its potent nanomolar enzyme inhibition, favorable physicochemical properties, and chemical tractability. In closing, the general strategy outlined herein to prepare the fluorescence polarization ligand Fl-Sal-AMS can be applied to any adenylate-forming enzyme by simply replacing the salicyl cap of Fl-Sal-AMS with a cognate carboxylic acid substrate. Therefore, we expect the described FP assay will find broad utility since adenylate-forming are ubiquitous in both microorganisms and eukaryotes, where they play central roles in primary and secondary metabolism.
Supplementary Material
SDS-PAGE of AAAEs used in this study, Michaelis-Menten plots of 2,3-DHB and salicylic acid with BasE, and complete experimental details for the preparation of Fl-Sal-AMS (6) and all intermediates. This material is available free of charge via the Internet at http://pubs.acs.org.
Acknowledgments
We thank the Minnesota Supercomputing Institute for computing time. Facilities and compound libraries for high-throughput screening were made available through the NSRB and the New England Regional Center of Excellence in Biodefense and Emerging Infectious Disease (U54AI057159). We thank members of the NSRB and ICCB-Longwood (Harvard Medical School) for their ongoing advice.
Funding: This research was supported by a grant from the NIH (R01AI070219) to C.C.A.
Abbreviations
- AAAE
aryl acid adenylating enzyme
- ArCP
aryl carrier protein
- 2,3-DHB
2,3-dihydroxybenzoic acid
- 3,4-DHB
3,4-dihydroxybenzoic acid
- 2,3-DHB-AMS
5′-O-[N-(2,3-dihydroxybenzoyl)sulfamoyl]adenosine
- FP
fluorescence polarization
- Fl-Sal-AMS
2′-O-{2-[2-(2-{[(Fluorescein-5-yl)carbonyl]amino}ethoxy)ethoxy]ethoxy}-5′-O-[N-(2-hydroxybenzoyl)sulfamoyl]adenosine Triethylammonium Salt
- HTS
high-throughput screening
- MIC
minimum inhibitory concentration
- MOM
methoxymethyl
- NHS
N-hydroxysuccinimidyl
- NPI
normalized percent inhibition
- NRPS
non-ribosomal peptide synthetase
- PK
pharmacokinetics
- PKS
polyketide synthase
- SAL
salicylic acid
- Sal-AMS
5′-O-[N-(salicyl)sulfamoyl]adenosine
- TBS
tert-butyldimethylsilyl
- TFA
trifluoroacetic acid
References
- 1.Projan SJ, Bradford PA. Late stage antibacterial drugs in the clinical pipeline. Curr Opin Microbiol. 2007;10:441–446. doi: 10.1016/j.mib.2007.08.007. [DOI] [PubMed] [Google Scholar]
- 2.Clatworthy AE, Pierson E, Hung DT. Targeting virulence: a new paradigm for antimicrobial therapy. Nat Chem Biol. 2007;3:541–548. doi: 10.1038/nchembio.2007.24. [DOI] [PubMed] [Google Scholar]
- 3.Ratledge C, Dover LG. Iron metabolism in pathogenic bacteria. Annu Rev Microbiol. 2000;54:881–941. doi: 10.1146/annurev.micro.54.1.881. [DOI] [PubMed] [Google Scholar]
- 4.Raymond KN, Dertz EA, Kim SS. Enterobactin: An archetype for microbial iron transport. Proc Natl Acad Sci USA. 2003;100:3584–3588. doi: 10.1073/pnas.0630018100. [DOI] [PMC free article] [PubMed] [Google Scholar]
- 5.Wyckoff EE, Mey AR, Payne SM. Iron acquisition in Vibrio cholerae. Biometals. 2007;20:405–416. doi: 10.1007/s10534-006-9073-4. [DOI] [PubMed] [Google Scholar]
- 6.Cescau S, Cwerman H, Letoffe S, Delepelaire P, Wandersman C, Biville F. Heme acquisition by hemophores. Biometals. 2007;20:603–613. doi: 10.1007/s10534-006-9050-y. [DOI] [PubMed] [Google Scholar]
- 7.Crosa JH, Walsh CT. Genetics and assembly line enzymology of siderophore biosynthesis in bacteria. Microbiol Mol Biol Rev. 2002;66:223–249. doi: 10.1128/MMBR.66.2.223-249.2002. [DOI] [PMC free article] [PubMed] [Google Scholar]
- 8.Miethke M, Marahiel MA. Siderophore-based iron acquisition and pathogen control. Microbiol Mol Biol Rev. 2007;71:413–451. doi: 10.1128/MMBR.00012-07. [DOI] [PMC free article] [PubMed] [Google Scholar]
- 9.Monfeli RR, Beeson C. Targeting iron acquisition by Mycobacterium tuberculosis. Infect Disord Drug Targets. 2007;7:213–220. doi: 10.2174/187152607782110031. [DOI] [PubMed] [Google Scholar]
- 10.Quadri LE. Assembly of aryl-capped siderophores by modular peptide synthetases and polyketide synthases. Mol Microbiol. 2000;37:1–12. doi: 10.1046/j.1365-2958.2000.01941.x. [DOI] [PubMed] [Google Scholar]
- 11.Challis GL. A widely distributed bacterial pathway for siderophore biosynthesis independent of nonribosomal peptide synthetases. Chembiochem. 2005;6:601–611. doi: 10.1002/cbic.200400283. [DOI] [PubMed] [Google Scholar]
- 12.Babbitt PC, Kenyon GL, Martin BM, Charest H, Slyvestre M, Scholten JD, Chang KH, Liang PH, Dunaway-Mariano D. Ancestry of the 4-chlorobenzoate dehalogenase: analysis of amino acid sequence identities among families of acyl: adenyl ligases, enoyl-CoA hydratases/isomerases, and acyl-CoA thioesterases. Biochemistry. 1992;31:5594–5604. doi: 10.1021/bi00139a024. [DOI] [PubMed] [Google Scholar]
- 13.Sieber SA, Marahiel MA. Molecular mechanisms underlying nonribosomal peptide synthesis: approaches to new antibiotics. Chem Rev. 2005;105:715–738. doi: 10.1021/cr0301191. [DOI] [PubMed] [Google Scholar]
- 14.Ferreras JA, Ryu JS, Di Lello F, Tan DS, Quadri LEN. Small-molecule inhibition of siderophore biosynthesis in Mycobacterium tuberculosis and Yersinia pestis. Nat Chem Biol. 2005;1:29–32. doi: 10.1038/nchembio706. [DOI] [PubMed] [Google Scholar]
- 15.Somu RV, Boshoff H, Qiao CH, Bennett EM, Barry CE, Aldrich CC. Rationally designed nucleoside antibiotics that inhibit siderophore biosynthesis of Mycobacterium tuberculosis. J Med Chem. 2006;49:31–34. doi: 10.1021/jm051060o. [DOI] [PubMed] [Google Scholar]
- 16.Miethke M, Bisseret P, Beckering CL, Vignard D, Eustache J, Marahiel MA. Inhibition of aryl acid adenylation domains involved in bacterial siderophore synthesis. FEBS J. 2006;273:409–419. doi: 10.1111/j.1742-4658.2005.05077.x. [DOI] [PubMed] [Google Scholar]
- 17.Vannada J, Bennett EM, Wilson DJ, Boshoff HI, Barry CE, 3rd, Aldrich CC. Design, synthesis, and biological evaluation of beta-ketosulfonamide adenylation inhibitors as potential antitubercular agents. Org Lett. 2006;8:4707–4710. doi: 10.1021/ol0617289. [DOI] [PMC free article] [PubMed] [Google Scholar]
- 18.Somu RV, Wilson DJ, Bennett EM, Boshoff HI, Celia L, Beck BJ, Barry CE, Aldrich CC. Antitubercular nucleosides that inhibit siderophore biosynthesis: SAR of the glycosyl domain. J Med Chem. 2006;49:7623–7635. doi: 10.1021/jm061068d. [DOI] [PMC free article] [PubMed] [Google Scholar]
- 19.Qiao CH, Gupte A, Boshoff HI, Wilson DJ, Bennett EM, Somu RV, Barry CE, Aldrich CC. 5′-O-[(N-Acyl)sulfamoyl]adenosines as antitubercular agents that inhibit MbtA: An adenylation enzyme required for siderophore biosynthesis of the mycobactins. J Med Chem. 2007;50:6080–6094. doi: 10.1021/jm070905o. [DOI] [PMC free article] [PubMed] [Google Scholar]
- 20.Neres J, Labello NP, Somu RV, Boshoff HI, Wilson DJ, Vannada J, Chen L, Barry CEr, Bennett EM, Aldrich CC. Inhibition of siderophore biosynthesis in Mycobacterium tuberculosis with nucleoside bisubstrate analogues: Structure–activity relationships of the nucleobase domain of 5′-O-[-N-(Salicyl)sulfamoyl]adenosine. J Med Chem. 2008;51:5349–5370. doi: 10.1021/jm800567v. [DOI] [PMC free article] [PubMed] [Google Scholar]
- 21.Qiao CH, Wilson DJ, Bennett EM, Aldrich CC. A mechanism-based aryl carrier protein/thiolation domain affinity probe. J Am Chem Soc. 2007;129:6350–6351. doi: 10.1021/ja069201e. [DOI] [PMC free article] [PubMed] [Google Scholar]
- 22.Burke TJ, Loniello KR, Beebe JA, Ervin KM. Development and application of fluorescence polarization assays in drug discovery. Comb Chem High Throughput Screen. 2003;6:183–194. doi: 10.2174/138620703106298365. [DOI] [PubMed] [Google Scholar]
- 23.Pfleger BF, Lee JY, Somu RV, Aldrich CC, Hanna PC, Sherman DH. Characterization and analysis of early enzymes for petrobactin biosynthesis in Bacillus anthracis. Biochemistry. 2007;46:4147–4157. doi: 10.1021/bi6023995. [DOI] [PubMed] [Google Scholar]
- 24.May JJ, Wendrich TM, Marahiel MA. The dhb operon of Bacillus subtilis encodes the biosynthetic template for the catecholic siderophore 2,3-dihydroxybenzoate-glycine-threonine trimeric ester bacillibactin. J Biol Chem. 2001;276:7209–7217. doi: 10.1074/jbc.M009140200. [DOI] [PubMed] [Google Scholar]
- 25.Keating TA, Marshall CG, Walsh CT. Reconstitution and characterization of the Vibrio cholerae vibriobactin synthetase from VibB, VibE, VibF, and VibH. Biochemistry. 2000;39:15522–15530. doi: 10.1021/bi0016523. [DOI] [PubMed] [Google Scholar]
- 26.Linne U, Marahiel MA. Reactions catalyzed by mature and recombinant nonribosomal peptide synthetases. Methods Enzymol. 2004;388:293–315. doi: 10.1016/S0076-6879(04)88024-8. [DOI] [PubMed] [Google Scholar]
- 27.Copeland RA. Evaluation of Enzyme Inhibitors in Drug Discovery. Wiley; Hoboken, NJ: 2005. [PubMed] [Google Scholar]
- 28.Larkin MA, Blackshields G, Brown NP, Chenna R, McGettigan PA, McWilliam H, Valentin F, Wallace IM, Wilm A, Lopez R, Thompson JD, Gibson TJ, Higgins DG. Clustal W and clustal X version 2.0. Bioinformatics. 2007;23:2947–2948. doi: 10.1093/bioinformatics/btm404. [DOI] [PubMed] [Google Scholar]
- 29.Clamp M, Cuff J, Searle SM, Barton GJ. The Jalview Java alignment editor. Bioinformatics. 2004;20:426–427. doi: 10.1093/bioinformatics/btg430. [DOI] [PubMed] [Google Scholar]
- 30.Roehrl MHA, Wang JY, Wagner G. A general framework for development and data analysis of competitive high-throughput screens for small-molecule inhibitors of protein - Protein interactions by fluorescence polarization. Biochemistry. 2004;43:16056–16066. doi: 10.1021/bi048233g. [DOI] [PubMed] [Google Scholar]
- 31.Malo N, Hanley JA, Cerquozzi S, Pelletier J, Nadon R. Statistical practice in high-throughput screening data analysis. Nat Biotechnol. 2006;24:167–175. doi: 10.1038/nbt1186. [DOI] [PubMed] [Google Scholar]
- 32.Zhang JH, Chung TDY, Oldenburg KR. A simple statistical parameter for use in evaluation and validation of high throughput screening assays. J Biomol Screen. 1999;4:67–73. doi: 10.1177/108705719900400206. [DOI] [PubMed] [Google Scholar]
- 33.Schrödinger. Schrödinger LLC; New York: 2007. [Google Scholar]
- 34.Owicki JC. Fluorescence polarization and anisotropy in high throughput screening: Perspectives and primer. J Biomol Screen. 2000;5:297–306. doi: 10.1177/108705710000500501. [DOI] [PubMed] [Google Scholar]
- 35.Lu GL, Burgess K. A diversity oriented synthesis of 3 ′-O-modified nucleoside triphosphates for DNA ‘sequencing by synthesis’. Bioorg Med Chem Lett. 2006;16:3902–3905. doi: 10.1016/j.bmcl.2006.05.035. [DOI] [PubMed] [Google Scholar]
- 36.Okada M, Iwashita S, Koizumi N. Efficient general method for sulfamoylation of a hydroxyl group. Tetrahedron Lett. 2000;41:7047–7051. [Google Scholar]
- 37.Drake EJ, Nicolai DA, Gulick AM. Structure of the EntB multidomain nonribosomal peptide synthetase and functional analysis of its interaction with the EntE adenylation domain. Chem Biol. 2006;13:409–419. doi: 10.1016/j.chembiol.2006.02.005. [DOI] [PubMed] [Google Scholar]
- 38.Quadri LEN, Sello J, Keating TA, Weinreb PH, Walsh CT. Identification of a Mycobacterium tuberculosis gene cluster encoding the biosynthetic enzymes for assembly of the virulence-conferring siderophore mycobactin. Chem Biol. 1998;5:631–645. doi: 10.1016/s1074-5521(98)90291-5. [DOI] [PubMed] [Google Scholar]
- 39.Miller DA, Luo LS, Hillson N, Keating TA, Walsh CT. Yersiniabactin synthetase: A four-protein assembly line producing the nonribosomal peptide/polyketide hybrid siderophore of Yersinia pestis. Chem Biol. 2002;9:333–344. doi: 10.1016/s1074-5521(02)00115-1. [DOI] [PubMed] [Google Scholar]
- 40.Rusnak F, Faraci WS, Walsh CT. Subcloning, expression, and purification of the Enterobactin biosynthetic enzyme 2,3-dihydroxybenzoate-AMP ligase: Demonstration of enzyme-bound (2,3-dihydroxybenzoyl)adenylate product. Biochemistry. 1989;28:6827–6835. doi: 10.1021/bi00443a008. [DOI] [PubMed] [Google Scholar]
- 41.Huang XY. Fluorescence polarization competition assay: The range of resolvable inhibitor potency is limited by the affinity of the fluorescent ligand. J Biomol Screen. 2003;8:34–38. doi: 10.1177/1087057102239666. [DOI] [PubMed] [Google Scholar]
- 42.Copeland RA. Enzymes: A Practical Introduction to Structure, Mechanism and Data Analysis. 2nd. Wiley; New York, NY: 2000. [Google Scholar]
- 43.Roehrl MHA, Wang JY, Wagner G. Discovery of small-molecule inhibitors of the NFAT-calcineurin interaction by competitive high-throughput fluorescence polarization screening. Biochemistry. 2004;43:16067–16075. doi: 10.1021/bi048232o. [DOI] [PubMed] [Google Scholar]
- 44.Callahan BP, Lomino JV, Wolfenden R. Nanomolar inhibition of the enterobactin biosynthesis enzyme, EntE: Synthesis, substituent effects, and additivity. Bioorg Med Chem Lett. 2006;16:3802–3805. doi: 10.1016/j.bmcl.2006.04.024. [DOI] [PubMed] [Google Scholar]
- 45.Oves-Costales D, Kadi N, Fogg MJ, Song L, Wilson KS, Challis GL. Enzymatic logic of anthrax stealth siderophore biosynthesis: AsbA catalyzes ATP-dependent condensation of citric acid and spermidine. J Am Chem Soc. 2007;129:8416–8417. doi: 10.1021/ja072391o. [DOI] [PubMed] [Google Scholar]
- 46.Maragakis LL, Perl TM. Acinetobacter baumannii: Epidemiology, antimicrobial resistance, and treatment options. Clin Infect Dis. 2008;46:1254–1263. doi: 10.1086/529198. [DOI] [PubMed] [Google Scholar]
- 47.May JJ, Kessler N, Marahiel MA, Stubbs MT. Crystal structure of DhbE, an archetype for aryl acid activating domains of modular nonribosomal peptide synthetases. Proc Natl Acad Sci USA. 2002;99:12120–12125. doi: 10.1073/pnas.182156699. [DOI] [PMC free article] [PubMed] [Google Scholar]
- 48.Webb MR. A continuous spectrophotometric assay for inorganic phosphate and for measuring phosphate release kinetics in biological systems. Proc Natl Acad Sci USA. 1992;89:4884–4887. doi: 10.1073/pnas.89.11.4884. [DOI] [PMC free article] [PubMed] [Google Scholar]
- 49.Zheng RJ, Dam TK, Brewer CF, Blanchard JS. Active site residues in Mycobacterium tuberculosis pantothenate synthetase required in the formation and stabilization of the adenylate intermediate. Biochemistry. 2004;43:7171–7178. doi: 10.1021/bi049676n. [DOI] [PubMed] [Google Scholar]
- 50.Otten LG, Schaffer ML, Villiers BR, Stachelhaus T, Hollfelder F. An optimized ATP/PP(i)-exchange assay in 96-well format for screening of adenylation domains for applications in combinatorial biosynthesis. Biotechnol J. 2007;2:232–240. doi: 10.1002/biot.200600220. [DOI] [PubMed] [Google Scholar]
Associated Data
This section collects any data citations, data availability statements, or supplementary materials included in this article.
Supplementary Materials
SDS-PAGE of AAAEs used in this study, Michaelis-Menten plots of 2,3-DHB and salicylic acid with BasE, and complete experimental details for the preparation of Fl-Sal-AMS (6) and all intermediates. This material is available free of charge via the Internet at http://pubs.acs.org.


