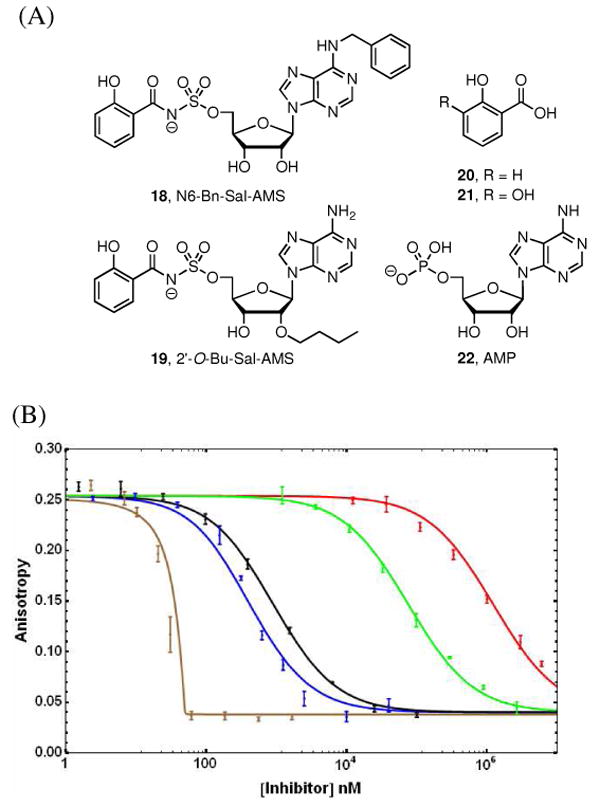
Figure 6.

(A) Structure of ligands evaluated in competitive displacement assay. (B) Competitive displacement analysis of 6 from MbtA by various ligands: Sal-AMS 4 (brown), 6-Bn-Sal-AMS 18 (black), 2′-O-Bu-Sal-AMS 19 (blue), salicylic acid 20 (green) and AMP 22 (red). Experimental data is shown as the average and standard error of triplicate experiments. Lines resulted of fitting experimental data to equations 2 and 3, except for Sal-AMS, where the respective KD, independently determined by ITC, was used to generate the line.
