Abstract
Purpose
To characterize the macular anatomy of retinal dystrophy eyes using high-speed, high-resolution, Fourier-domain optical coherence tomography (FD-OCT).
Design
Case control study.
Methods
Patients with retinal dystrophy and normal age and gender matched controls underwent FD-OCT imaging using the RTVue™ (Optovue, Inc.), which has an axial resolution of 5 microns. Vertical and horizontal eight mm scans of 1,024 lines/cross-section were obtained. Based on boundaries manually drawn on computer displays of OCT cross-sections, the thicknesses of the retina, inner retinal layer (IRL) and outer retinal layer (ORL) were averaged over both 5 and 1.5 millimeters regions centered at the fovea. The inner retina layer (IRL) was the sum of nerve fiber layer (NFL), ganglion cell layer (GCL) and inner plexiform layer (IPL) thicknesses. Total retinal thickness (RT) was measured between the inner edges of the NFL and the retinal pigment epithelium. Outer retinal layer (ORL) thickness was calculated by subtracting IRL thickness from RT.
Results
14 patients (7 retinal dystrophy patients and seven normal controls) underwent high resolution OCT imaging. Patients ranged in age from 33 to 84 years old. Retinal dystrophy diagnoses included retinitis pigmentosa (3), cone-rod degeneration (2), and Stargardt disease (2). The following thickness values reported are mean ± standard deviation. Mean foveal RT (foveal RT) averaged over a 1.5 mm area was 271.3+/-23.3μ for normal patients and 159.2+/-48.0 μ for dystrophy (p<0.001) patients. Mean macular RT (macular RT), averaged over the central 5-mm area, was 292.8+/-8.1 μ for normal patients and 199.1+/-32.7μ for dystrophy patients (p<0.001). Mean macular IRL was 109.9 ± 6.4 for normals and 98.0 +/-20.6μ for dystrophy patients (p=0.02); mean macular ORL was 182.9+/-4.7 μ for normals and 101.1+/-18.8μ for dystrophy patients (p<0.001).
Conclusion
Eyes with retinal dystrophy had a small (11%) decrease in macular IRL and severe (45 %) decrease in macular ORL compared to normals. The higher resolution and definition of the FD-OCT technology facilitated measurements of the thickness of retinal sublayers.
Introduction
Optical coherence tomography (OCT) was first developed as a research tool in 1991.1 Since then, improved resolution and speed have enabled the OCT to become widely used clinically. The prior standard in OCT retinal imaging was the Stratus™ (also known as the OCT3 by Carl Zeiss Meditec, Inc., Dublin, CA)2, which has an axial resolution of nine to ten microns. The machine acquires images at 400 axial scans (A-scans) per second. 2-3- Recently, a new technology called Fourier domain OCT (FD-OCT) has enabled much faster image acquisition, enabling both higher definition (more lines per image) and less motion error.4-7 The current study used the RTVue™ FD-OCT system (Optovue, Inc., Fremont, CA), which performs 26,000 A-scans per second, sixty-five times faster than the Stratus™. This Fourier domain OCT system also employs a higher bandwidth light source, thus providing a finer axial resolution of five microns - a two-fold improvement over the Stratus. Although ultrahigh resolution (three microns) OCT of the retina has been previously described, 8-14 UHR-OCT requires a femtosecond laser light source which is not practical clinically due to the high cost, bulk and maintenance requirements. In contrast, the RTVue utilizes a superluminescent diode that is compact, reliable and more economical.
Previous histopathological studies in eyes with retinal degeneration showed loss of photoreceptor segments early in the disease.15-18 We used the Fourier domain OCT to explore structural changes in the macular anatomy of retinal dystrophy patients. A second goal of the study was to determine whether structural findings on OCT correlated with visual acuity.
Patients and Methods
Patients with retinal dystrophies were prospectively enrolled into the study. Eligible patients included those with retinitis pigmentosa, cone-rod degeneration and Stargardt disease. Normal control subjects were selected from the database of the Advanced Imaging for Glaucoma Study (AIGS) to match the age and gender of the dystrophy subjects. Normal controls were defined as having both eyes free of ocular pathology after a comprehensive eye exam, intraocular pressures (IOP) less than 21 mm Hg, full visual fields and normal central corneal thickness greater than 500 microns (μ). (A detailed description of the enrollment criteria can be obtained from the AIGS Manual of Procedures (www.AIGStudy.net).) IRB approval from the University of Southern California was obtained for this study. All patients signed a written informed consent form prior to entry into the study.
Both eyes of every patient were scanned three times with two scan patterns, the line scan and the cross-hairs scan. We choose the best of the three scans of each patient for analysis. These patients have poor fixation in general. The line scan consists of 1,024 a-scans over an eight millimeter length. The line was oriented horizontally. The cross-hairs scan consists of two line scans (vertical and horizontal). All scans are centered at fovea. To reduce the speckle noise, the study images were averaged from several scans. Up to eight frames were averaged for cross-hairs scans and up to 16 frames were averaged for line scans.
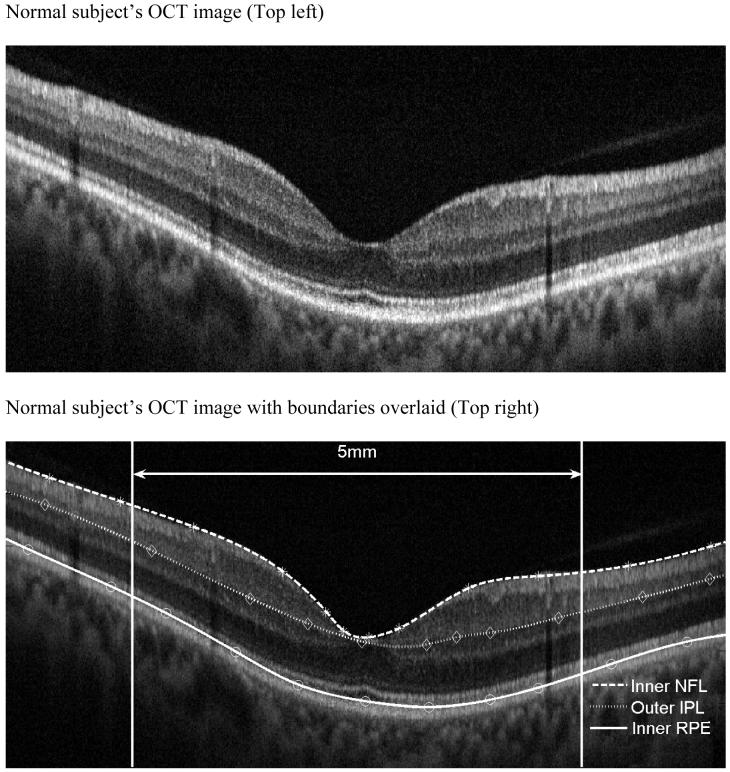
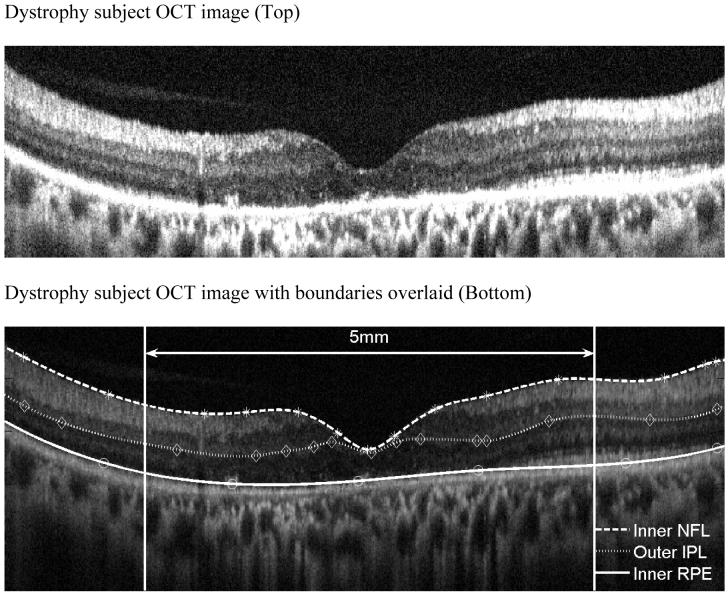
The OCT images of each patient were exported from the RTVue™ OCT to a computer. A computer program was used to display and draw the inner retina boundary based on image intensity on the OCT. For each boundary, points are selected and a thin spline plate fitting was applied to these points to create a smooth boundary. Three boundaries, the inner boundary of the nerve fiber layer (NFL), outer boundary of the inner plexiform layer (IPL) and inner boundary of the retinal pigment epithelium (RPE) were drawn as shown on Figure 1. The outer plexiform layer (OPL) was excluded from boundary detection and not drawn as it could not be clearly demarcated on some dystrophy patients. Total retinal thickness, inner retinal layer thickness (IRL) and outer retinal layer thickness (ORL) measurements were calculated. The total retinal thickness (RT) was measured from the inner NFL to the inner RPE boundary, which is an accepted boundary. The IRL was measured from the inner NFL to the outer boundary of the IPL, and represents the sum of the nerve fiber layer (NFL), ganglion cell layer (GCL) and inner plexiform layer (IPL) thicknesses. Outer retinal thickness (ORL) was the value obtained from RT minus IRL thickness.
FIGURE 1.
Boundary drawing and retinal thickness measurement
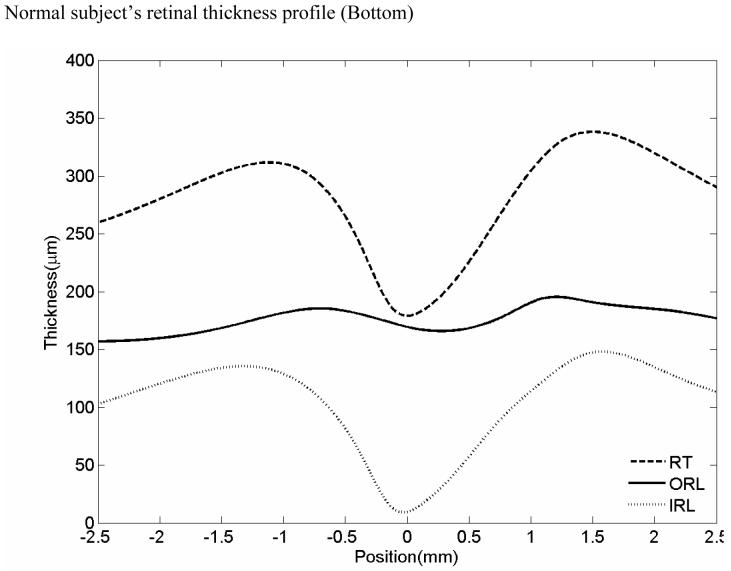
OCT image of a normal patient (Top left). Inner Nerve fiber layer (NFL), outer inner pelxiform layer (IPL) and inner retinal pigment epithelium (RPE) boundaries are indicated on the figure as the dashed colored lines (Top right). Normal subject’s OCT image with boundaries overlaid. Mean retinal thickness plotted as a function of eccentricity from the foveal center (microns) (Bottom). Mean value is the central dashed line. Flanking lines represent the 95 % confidence intervals.
A prior study on reproducibility of macular thickness showed only small variations in measurements. In 125 normal and 112 glaucoma eyes, IRL, ORL and RT measurements had standard deviations less than 1.7 microns and the coefficient variance was less than 1.1%. 19
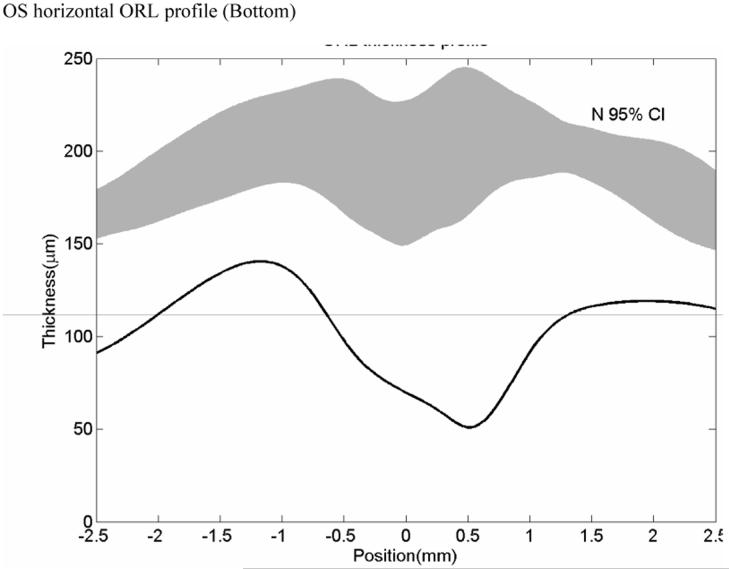
At the foveal center, since there is no IRL, IRL thickness is zero and the foveal retinal thickness (RT) is equal to the ORL thickness. The average thickness of central foveal point measured in the horizontal and vertical scan was designated central retinal thickness (cRT). The macular IRL, ORL and RT measurements were averaged (area-weighed) over a 5-mm region. The foveal IRL, ORL and RT measurements were averaged over a 1.5 mm diameter area. These thickness measurements of the dystrophy cases were compared with those of the normal cases. For each patient, an OCT thickness profile was created. On this profile, OCT thickness is plotted across various distances from the fovea. The range of normal retinal thicknesses are plotted on the same graph and shaded in grey to allow for a rapid comparison of the patient’s retinal thickness with normal retinal thicknesses.
LogMAR visual acuities were calculated from the Snellen visual acuities for each eye. In order to determine whether there was a correlation between visual acuity and retinal thickness, correlations were calculated for macular thickness and LogMAR acuities and for foveal thickness and LogMAR acuities.
Results
Twenty-eight eyes of fourteen patients underwent RTVue imaging. The fourteen eyes with retinal degeneration included retinitis pigmentosa (six eyes), cone-rod dystrophy (four eyes) and Stargardt disease (four eyes). There were fourteen normal eyes. Patients ranged in age from 33 to 84 years old. There were 3 male and 4 female patients, with age 51 +/- 14 years old in the dystrophy group. There were 3 male and 4 female patients, with age 54 +/- 10 years old in the normal group.
A representative OCT of a normal patient is shown on Figure 1 with the retinal boundaries also shown. Figure 2 shows a representative example of a dystrophy patient with the boundaries drawn. A retinal profile shows that the thickness of the dystrophy patient is significantly thinner as compared to the normal range of thicknesses.
FIGURE 2.
Representative dystrophy patient showing lack of clear demarcation of the outer plexiform layer OPL (Top) Strophy patient’s OCT image with boundaries overlaid (Bottom).
Table 1 enumerates the actual retinal thickness measurements for each of the dystrophy patients. Representative case studies for the different dystrophy patients are presented below.
Table 1.
Retinal thickness Measurements of Dystrophy Patients
| patient | site | Diagnosis | macular IRL(μ) | macular ORL(μ) | macular RT(μ) | foveal IRL(μ) | foveal ORL(μ) | foveal RT(μ) | cRT(μ) | Log MAR |
|---|---|---|---|---|---|---|---|---|---|---|
| KL | OD | RP | 132 | 114 | 246 | 70 | 112 | 182 | 108 | 0.70 |
| KL | OS | RP | 121 | 112 | 233 | 66 | 78 | 144 | 99 | 1.30 |
| LP | OD | RP | 116 | 120 | 237 | 85 | 129 | 214 | 131 | 0.30 |
| LP | OS | RP | 102 | 103 | 205 | 54 | 101 | 155 | 91 | 0.18 |
| JW | OD | RP | 121 | 96 | 216 | 85 | 142 | 227 | 148 | 0.00 |
| JW | OS | RP | 112 | 98 | 210 | 83 | 143 | 226 | 150 | 0.00 |
| RQ | OD | Cone Rod | 90 | 99 | 188 | 52 | 76 | 128 | 74 | 2.00 |
| DK | OD | Cone Rod | 79 | 94 | 173 | 77 | 92 | 169 | 131 | 1.00 |
| DK | OS | Cone Rod | 90 | 92 | 182 | 95 | 98 | 193 | 157 | 1.00 |
| LW | OD | Stargardts | 78 | 51 | 129 | 58 | 39 | 97 | 57 | 2.00 |
| LW | OS | Stargardts | 65 | 94 | 159 | 52 | 83 | 135 | 90 | 2.00 |
| MM | OD | Stargardts | 86 | 119 | 205 | 45 | 53 | 98 | 41 | 0.54 |
| MM | OS | Stargardts | 81 | 123 | 204 | 51 | 46 | 98 | 36 | 0.70 |
RP = retinitis pigmentosa
Cone Rod=cone-rod systrophy
Stargardt=Stargardt macular dystrophy
OD = right eye
OS = left eye
Case studies
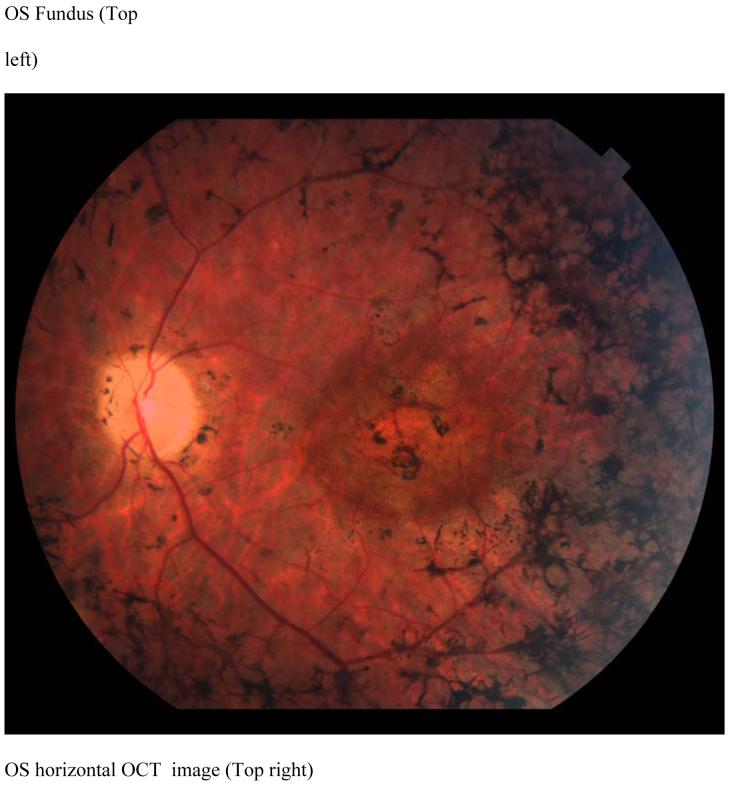
Case 1 Retinitis Pigmentosa : not very typical ?? i would suggest we remove this case and figures with it
KL is a 46 year old man with a diagnosis of RP since 1992, has visual acuities of 20/ 100 in the right eye and 20/ 400 in the left eye. His poor vision has precluded driving an automobile for the past two years. Dilated fundus examination revealed bilateral vitreous cells, waxy optic atrophy, atrophic macular bull’s eye lesions, epiretinal membranes, severe vascular attenuation and marked peripheral pigmentary changes (Figure 3, top left). The patient saw none of the Ishihara color plates. ERG testing was consistent with RP. The OCT scans showed marked thinning of the retina (Figure 3, top right). The retinal thickness profile showed the patient’s retinal thickness is uniformly severely thinned as compared with the normal retinal thickness (Figure 3 bottom).
FIGURE 3.
Case 1 (KL)
Fundus photograph of patient KL shows a bullseye maculopathy with surrounding bone spicules (Top left). Horizontal OCT scan shows corresponding hyperreflectivity of the choroidal layer with overlying marked retinal and RPE thinning (Top right) The corresponding retinal thickness profile of KL (solid line) compared with normal controls (mean with 95 % CI shown as grey band) (Bottom).
Case 2 JW Retinitis Pigmentosa
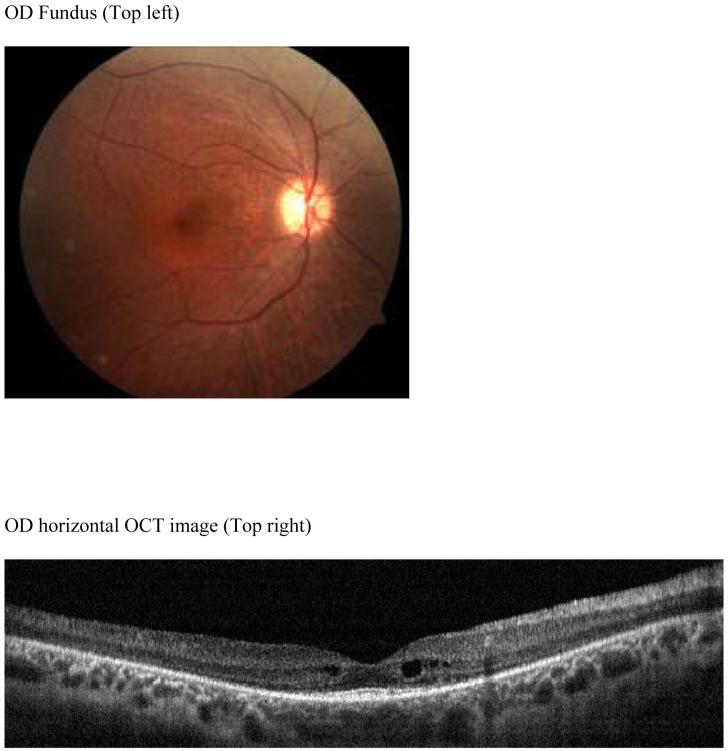
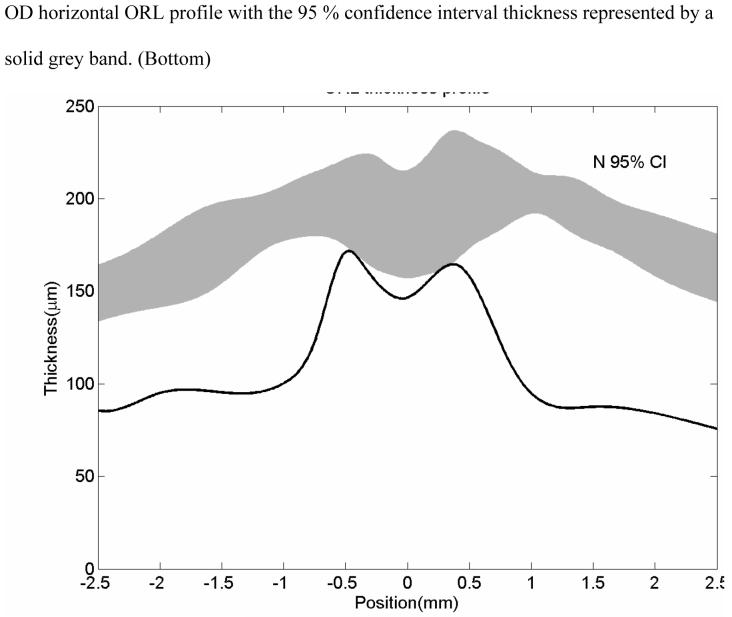
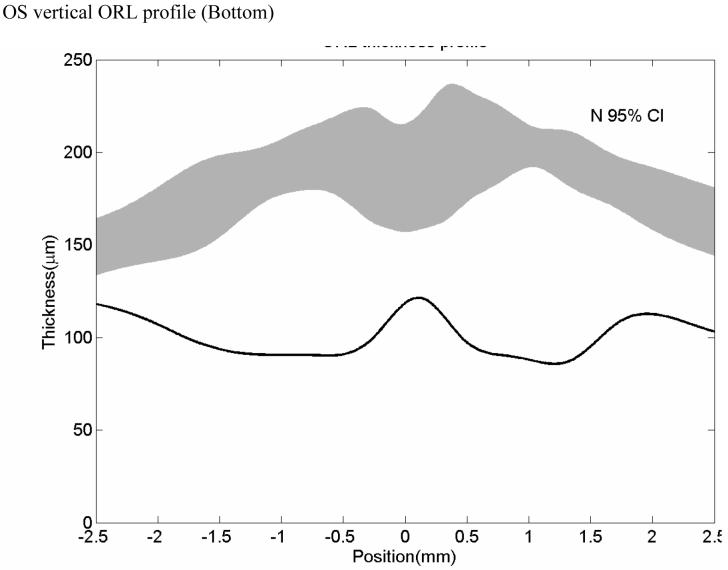
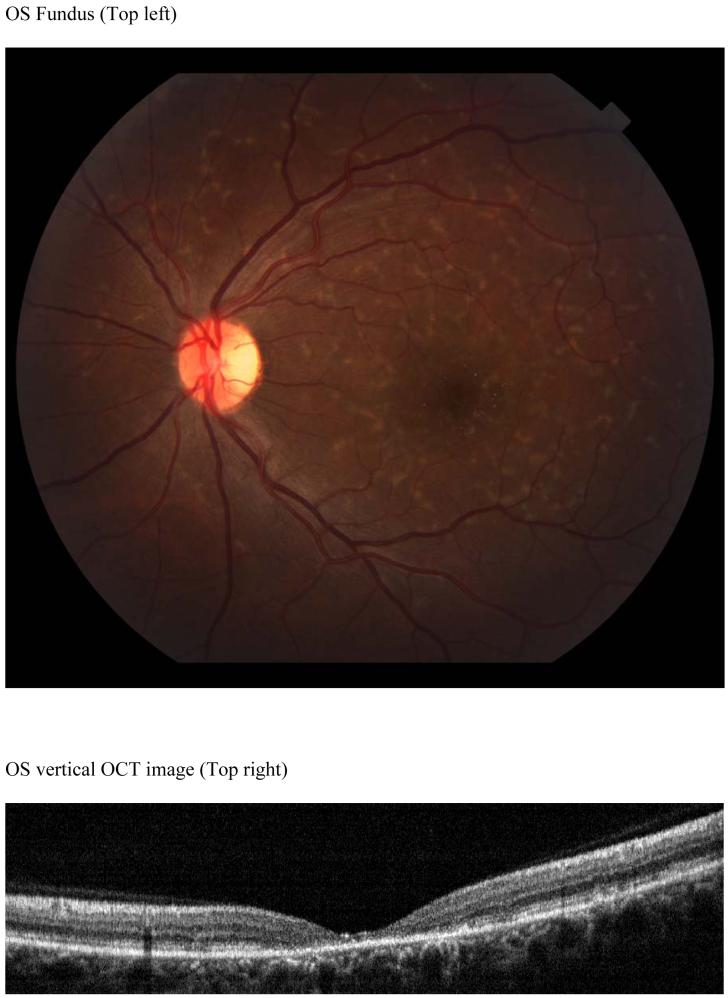
JW is a 31 year old man with a lifelong history of nyctalopia who was diagnosed five years ago with RP. Visual acuities were 20/20 bilaterally. He has no family history of RP. Retinal examination revealed bilateral optic disc pallor, peripheral bone spicules, vascular attenuation and mild epiretinal membranes (Figure 4, top left). There were also drusen in the right macular region. An ERG showed a barely detectable rod response and a significantly delayed photopic response. Dark adaptation was delayed in both eyes. Goldmann visual field testing showed bilateral mild concentric visual field contraction with superior field depression. OCT scans (Figure 4, top left) showed a mildly atrophic retina with some perifoveal cysts present. On the retinal thickness profile, these cystic areas appear as peaks. The remainder of the retinal thickness profile showed the retina was thinner as compared to the normal range. (Figure 4 bottom).
FIGURE 4.
case 2 JW RP 20/20 OU
Patient JW, early RP. Color fundus photo shows a mild macular bullseye lesion with arterial attenuation but no bone spicules (Top left). Horizontal OCT scan shows macular thinning and perifoveal cysts (Top right). Horizontal ORL profile shows that the mean values of this patient with early RP is below the normal average (normal 95 % confidence interval thickness represented by a solid grey band.) (Bottom).
Case 3 DK Cone rod dystrophy
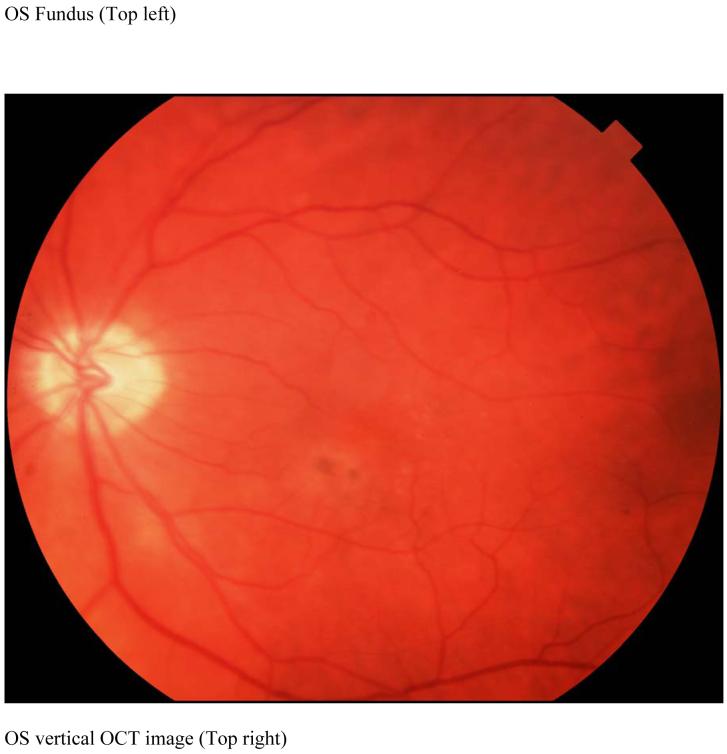
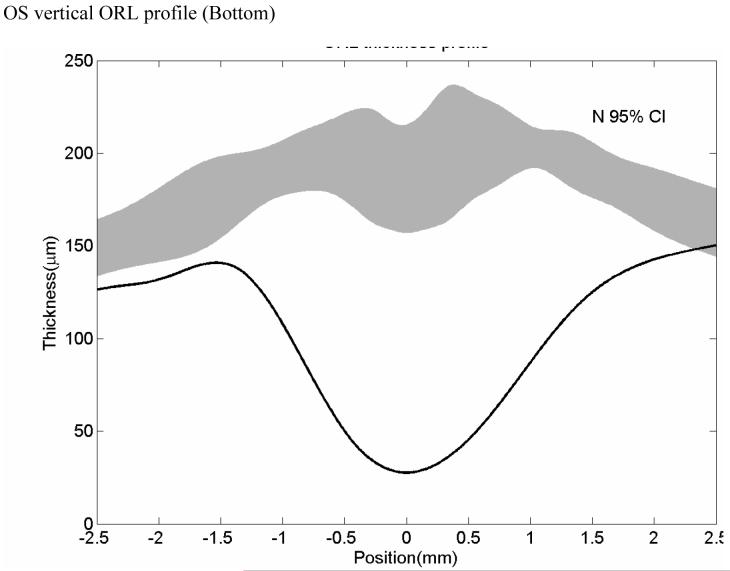
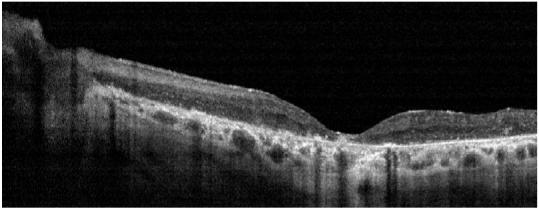
DK is a 69 year old man with a history of amblyopia in his right eye and photopsias six years ago with progressive visual acuity loss. In March 2005, visual acuities were 20/80-2 OD and 20/60 OS. Ishihara color plate testing showed only one correct response in each eye. One year later, visual acuities were 20/200 in each eye. Dilated ophthalmoscopy revealed a bull’s eye lesion in the right eye, and an atrophic macula in the left eye (Figure 5, top left), and bilateral peripheral pigmentary changes. ERG testing showed decreased photopic and scotopic function consistent with cone-rod dystrophy. Fluorescein angiography showed a bull’s eye maculopathy. OCT scans (Figure 5, top right) showed marked choriocapillaris attenuation and central macular thinning. The retinal thickness profile showed generalized thinning as compared with normals (Figure 5 bottom).
FIGURE 5.
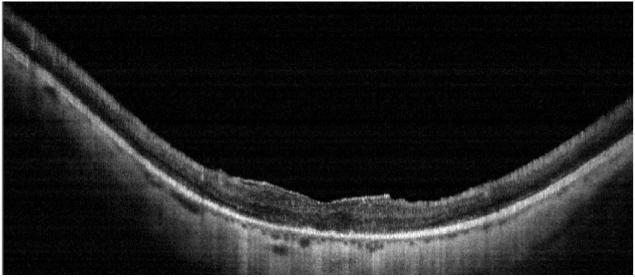
Case 4 DK, Cone-rod, 20/200 no choriocapillaris
Patient DK. Color fundus photo shows macular atrophy, vascular attenuation and absence of RPE pigment spicules (Top left). Horizontal OCT scan shows macular thinning and marked loss of the choriocapillaris. An overlying epiretinal membrane is visible (Top right). Horizontal ORL profile shows marked thinning of the macular area as compared with normals (solid grey band) (Bottom).
Case 4 MM Stargardt Disease: more typical
MM is a 39 year old woman with a history of metamorphopsia for three years, glare but no nyctalopia. Visual acuities were 20/ 70 in the right eye and 20/100 in the left eye. Ishihara color vision testing showed 12 of 14 correct responses in the right eye and 11 of 14 correct responses in the left eye. Ophthalmoscopy showed pisciform flecks and crystalline retinal deposits (Figure 6). A fluorescein angiogram showed a dark choroid. OCT scans revealed central macular thinning with loss of perifoveal structures but with maintained thickness further from the foveal center. The retinal thickness profile showed abnormal thinning within 1.5 mm of the fovea and more normal retinal thickness more eccentric to that area (Figure 8 bottom).
FIGURE 6.
Case 6 MM Stargardt, 20/ 70
MM (Stargardt) Color fundus photo shows numerous pisciform yellow flecks, normal appearing RPE and absence of atrophy (Top left). Horizontal OCT scan reveals a thinned perifoveal retina with normal adjacent retinal thickness (Top right). Retinal thickness profile shows this marked retinal thinning centrally (deep central dip) as compared with normal controls (grey band) (Bottom).
Controls
The seven age-matched (43 to 73 years old) controls had visual acuities ranging from 20/20 to 20/25. Except for one patient who had an early nuclear sclerotic cataract in one eye and was pseudophakic in the left eye, the eye exams were normal.
Quantitative Results
In Tables 2 and 3, the average of the macular retinal thickness measurements for the dystrophy patients are presented next to the values for the normal control patients. Except for macular IRL, average retinal thickness measurements (macular ORL, macular RT, foveal cRT, foveal ORL, foveal RT) of dystrophy patients were significantly thinner than normal patients (p<0.001). There was a 45 % decrease of macular ORL in retinal degeneration patients versus an 11 % decrease in IRL.
Table 2.
Average macular retinal thickness of dystrophy patients and normal subjects
| Group name | macular IRL(μ) | macular ORL(μ) | macular RT(μ) |
|---|---|---|---|
| normal | 109.9±6.4 | 182.9±4.7 | 292.8±8.1 |
| dystrophy | 98.0 ±20.6 | 101.1±18.8 | 199.1±32.7 |
| p-value | 0.065 | <0.001 | <0.001 |
| 95% CI of difference in means. | -29.7 ,5.8 | -97.8 ,-65.7 | -121.7,-65.8 |
| FD(95% CI) | -0.11(-0.27, 0.05 ) | -0.45(-0.53, -0.36) | -0.32(-0.42, -0.22) |
| Standardized deviation (95% CI) | -1.87 (-4.65, 0.91 ) | -17.28(-20.68, -13.89) | -11.52(-14.95, -8.08 ) |
Macular averages are computed in the central 5-mm diameter area.cRT: Central retinal thickness
macular IRL: macular inner retina layer thickness
macular ORL: macular outer retina layer thickness
macular RT: macular retinal thickness
FD: Fractional Deviation
CI =confidential interval
Table 3.
Foveal thickness measurements for dystrophy patients and normals eyes
| Group name | foveal IRL (μ) | foveal ORL(μ) | foveal RT(μ) | cRT (μ) |
|---|---|---|---|---|
| normal | 71.8 ±10.2 | 199.6±14.1 | 271.3±23.3 | 195.2±17.5 |
| dystrophy | 67.1 ±16.4 | 92.3 ±35.0 | 159.2±48.0 | 101.0±41.1 |
| p-value | 0.395 | <0.001 | <0.001 | <0.001 |
| 95% CI of difference in means. | -19.9, 10.6 | -137.7, -77.9 | -154.8, -70.1 | -130.4, -58.2 |
| FD(95% CI) | -0.06(-0.28, 0.15 ) | -0.54(-0.69, -0.39) | -0.41 (-0.57, -0.26) | -0.48(-0.67, -0.30) |
| Standardized deviation (95% CI) | -0.46 (-1.94 , 1.03 ) | -7.64 (-9.76, - 5.52 ) | -4.82 (-6.64, - 3.00 ) | -5.39 (-7.45, - 3.32 ) |
Foveal averages are computed in the central 1.5-mm diameter area.
foveal IRL: foveal Inner retina layer
foveal ORL: foveal outer retina layer
foveal RT: foveal retinal thickness
cRT: Retinal thickness at the central point of fovea
We also calculated the fractional deviation (FD) and standardized deviation of for these retinal thickness measurements in retinal dystrophy compared with normal controls (Table 2 and 3). FD was the deviation of the retinal dystrophy group value from the normal controls group value, expressed as a fraction of the average normal controls value. Standardized deviation was defined as the deviation of the retinal dystrophy value from the normal controls value divided by the standard deviation in the normal controls group. FD for cRT, foveal ORL, foveal RT, macular ORL and macular RT yielded statistically significant results for retinal dystrophy patients compared with the normal controls. Of all the parameters we evaluated, standardized deviation of the macular ORL showed the most statistically significant difference in retinal dystrophy compared with normal controls.
The correlation coefficient values (R2) between Log MAR visual acuities and retinal thickness measurements are given in Table 4. The R2 were modest and most significant for macular IRL.
Table 4.
| R2 | slope | p-value | |
|---|---|---|---|
| macular IRL | 0.34 | -16.36 | 0.04 |
| macular ORL | 0.24 | -12.46 | 0.08 |
| macular RT | 0.42 | -28.94 | 0.02 |
| foveal IRL | 0.18 | -9.36 | 0.15 |
| foveal ORL | 0.40 | -29.32 | 0.02 |
| foveal RT | 0.36 | -38.71 | 0.03 |
| cRT | 0.16 | -22.46 | 0.17 |
Discussion
OCT imaging has enabled in vivo cross-sectional analysis of retinal pathology in various diseases. In this pilot study, Fourier domain OCT with its higher resolution and definition facilitated measurements of the thickness of retinal sublayers allowing us to precisely map the loss of retinal sublayers in retinal degeneration patients as compared to normal patients. In the case of retinal degenerations, the OCT findings parallel those found on histopathology. Milam et al showed us that the earliest change noted is shortening of the outer segments of rods and cones.16 Our finding of a 45 % decrease of macular ORL in retinal degeneration patients versus an 11 % decrease in IRL is consistent with histopathology results of retinal degeneration patients. The macular ORL thinning was seen even in eyes with good central acuity and very early RP disease as compared to normal controls. This mimics the histopathology in early disease, where thinning and loss of photoreceptors is seen early in this disease process before visual acuity is affected.
The finding of reduced macular ORL and foveal ORL thicknesses is similar to the reduced foveal outer segment/ pigment epithelial thickness (FOSPET) found using the UHR-OCT.8 Although central foveal thickness was not significantly different between RP patients and normal subjects (P = .103), the difference in FOSPET was significant (52.8 +/- 8.3 RP versus 78.6 +/- 5.1 normals; p = 0.003). The authors noted that FOSPET was a way to quantify photoreceptor loss. However, since the inner segment / outer segment (IS/ OS) junction is often obliterated in advanced cases of retinal dystrophy, measurement of FOSPET may be problematic in these patients. In our present study, both macular ORL and foveal ORL were significantly different between the dystrophy and normal patients. Macular ORL and foveal ORL may therefore be more useful and can quantify photoreceptor loss in retinal dystrophy patients. Macular and foveal ORL can be obtained using the RTVue and do not require UHR-OCT.
Although the five microns resolution of the RTVue system is slightly lower as compared with the three microns resolution of the UHR-OCT 12systems, the resolution is fine enough to clearly identify the retinal layers and result in statistically significant retinal thickness differences between retinal dystrophy and normal controls. The machine’s software allows the determination of IRL, ORL and retinal thicknesses at various locations using either automated computer map output or computer-aided caliper spot measurements.
In Witkin et al’s study8, visual acuity showed a fair correlation with cRT (Pearson r = -0.43, r (2) = 0.187, P = .245) and an excellent correlation with FOSPET (Pearson r = -0.942, r (2) = 0.887, P < .0001). FOSPET was statistically thinner in RP patients than in normal control eyes and showed correlation with Log MAR visual acuity. In our study, LogMAR visual acuity correlated with foveal ORL (1.5 millimeters) better than with macular ORL (5 millimeters) or with cRT. Ergun and coworkers have found central FT was correlated with visual acuity in eyes with Stargardt disease.13 Transverse photoreceptor atrophy did not correlate with visual acuity. It remains to be determined whether these transverse areas of atrophy, which were also seen in our present study, are predictive of future progression of the disease.
The ORL thickness profiles were helpful in comparing the location of retinal thinning in dystrophy patients with normals. In patients with RP, the ORL thickness profiles show a pattern of more thinning of the macular ORL than he foveal ORL early in the disease process. This finding is consistent with the visual field losses beginning peripherally and concentrically contracting in RP. In contrast, the early loss of foveal ORL in cone-rod and Stargardt disease with relative preservation of the macular ORL is consistent with the central visual loss early in these diseases. We also noted thinning of the macular choriocapillaris in the cone-rod patients as compared to the RP patients and controls. Further work is needed to determine the implications of our OCT findings as prognostic indicators for visual progression in patients with retinal dystrophy.
Acknowledgments
Support:
National Eye Institute of the National Institutes of Health R01 EY013516, EY495707 and EY03040, Research to Prevent Blindness, Age-related Macular Degeneration Research Fund, Optovue, Inc.
Financial interests:
Dr. Huang has research grants, stock options, consulting relationship, travel support and potential patent royalty interest in Optovue, Inc. (Fremont, CA).
References
- 1.Huang D, Swanson EA, Lin CP, et al. Optical coherence tomography. Science. 1991;254(5035):1178–81. doi: 10.1126/science.1957169. [DOI] [PMC free article] [PubMed] [Google Scholar]
- 2.Fujimoto JG, Huang D, Hee MR, et al. Physical properties of optical coherence tomography. In: Schuman JS, Pulido CA, Fujimoto JG, editors. Optical Coherence Tomography of Ocular Diseases. 2nd ed. SLACK Inc.; Thorofare, NJ: 2004. pp. 677–88. [Google Scholar]
- 3.Huang D, Ou T, Fujimoto J, et al. Optical Coherence Tomography. In: Huang D, Kaiser PK, Lowder CY, Traboulsi EI, editors. Retinal Imaging. Mosby Elsevier; Philadelphia: 2006. pp. 47–65. [Google Scholar]
- 4.Wojtkowski M, Leitgeb R, Kowalczyk A, et al. In vivo human retinal imaging by Fourier domain optical coherence tomography. Journal of Biomedical Optics. 2002;7(3):457–63. doi: 10.1117/1.1482379. [DOI] [PubMed] [Google Scholar]
- 5.Choma MA, Sarunic MV, Yang C, Izatt JA. Sensitivity advantage of swept-source and Fourier-domain optical coherence tomography. Optics Express. 2003;11(18):2183–9. doi: 10.1364/oe.11.002183. [DOI] [PubMed] [Google Scholar]
- 6.Leitgeb R, Hitzenberger CK, Fercher AF. Performance of fourier domain vs. time domain optical coherence tomography. Optics Express. 2003;11(8):889–94. doi: 10.1364/oe.11.000889. [DOI] [PubMed] [Google Scholar]
- 7.Wojtkowski M, Srinivasan V, Fujimoto JG, et al. Three-dimensional retinal imaging with high-speed ultrahigh-resolution optical coherence tomography. Ophthalmology. 2005;112(10):1734–46. doi: 10.1016/j.ophtha.2005.05.023. [DOI] [PMC free article] [PubMed] [Google Scholar]
- 8.Witkin AJ, Ko TH, Fujimoto JG, Chan A, Drexler W, Schuman JS, Reichel E, Duker JS. Ultra-high Resolution Optical Coherence Tomography Assessment of Photoreceptors in Retinitis Pigmentosa and Related Diseases. Am J Ophthalmol. 2006;142:945–952. doi: 10.1016/j.ajo.2006.07.024. [DOI] [PMC free article] [PubMed] [Google Scholar]
- 9.Drexler W, Morgner U, Ghanta RK, et al. Ultrahigh-resolution ophthalmic optical coherence tomography. Nat Med. 2001;7:502–7. doi: 10.1038/86589. [DOI] [PMC free article] [PubMed] [Google Scholar]
- 10.Drexler W, Sattmann H, Hermann B, et al. Enhanced visualization of macular pathology with the use of ultrahigh -resolution optical coherence tomography. Arch Ophthalmol. 2003;121:695–706. doi: 10.1001/archopht.121.5.695. [DOI] [PubMed] [Google Scholar]
- 11.Srinivasan VJ, Wojtkowski M, Witkin AJ, Duker JS, Ko TH, Carvalho M, Schuman JS, Kowalczyk A, Fujimoto JG. High-definition and 3-dimensional imaging of macular pathologies with high-speed ultrahigh-resolution optical coherence tomography. Ophthalmology. 2006 Nov;113(11):2054.e1–14. doi: 10.1016/j.ophtha.2006.05.046. [DOI] [PMC free article] [PubMed] [Google Scholar]
- 12.Ko TH, Fujimoto JG, Schuman JS, Paunescu LA, Kowalevicz AM, Hartl I, Drexler W, Wollstein G, Ishikawa H, Duker JS. Comparison of ultrahigh- and standard-resolution optical coherence tomography for imaging macular pathology. Ophthalmology. 2005 Nov;112(11):1922. doi: 10.1016/j.ophtha.2005.05.027. Epub 2005 Sep 23. [DOI] [PMC free article] [PubMed] [Google Scholar]
- 13.Ergun E, Hermann B, Wirtitsch M, et al. Assessment of central visual function in Stargardt disease / fundus flavimaculatus with ultrahigh-resolution optical coherence tomography. Invest Ophthalmol Vis Sci. 2005;45:310–316. doi: 10.1167/iovs.04-0212. [DOI] [PubMed] [Google Scholar]
- 14.Huber R, Adler DC, Fujimoto JG. Buffered Fourier domain mode locking: Unidirectional swept laser sources for optical coherence tomography imaging at 370,000 lines/s. Opt Lett. 2006;31(20):2975–7. doi: 10.1364/ol.31.002975. [DOI] [PubMed] [Google Scholar]
- 15.Pagon RA. Retinitis pigmentosa. Surv Ophthalmol. 1988;33:137–177. doi: 10.1016/0039-6257(88)90085-9. [DOI] [PubMed] [Google Scholar]
- 16.Milam AH, Li ZY, Fariss RN. Histopathology of the human retina in retinitis pigmentosa. Prog Retin Eye Res. 1998;17:175–205. doi: 10.1016/s1350-9462(97)00012-8. [DOI] [PubMed] [Google Scholar]
- 17.Tucker GS, Jacobson SG. Morphological findings in retinits pigmentosa with early diffuse rod dysfunction. Retina. 1988;8:30–41. doi: 10.1097/00006982-198808010-00007. [DOI] [PubMed] [Google Scholar]
- 18.Heckenlively JR. Retinitis pigmentosa. J.B. Lippincott co.; Philadelphia: 1988. [Google Scholar]
- 19.Reproducibility article


