

Abstract
Context
Fruit and vegetable intake is an important part of a healthy diet and is associated with numerous positive health outcomes. MyPyramid provides recommendations for fruit and vegetable consumption based on individual calorie requirements as determined by an individual's age, sex, and physical activity level.
Objectives
To determine (1) median fruit and vegetable consumption from all dietary sources among adolescent and adult consumers and the percentage of adolescents and adults meeting individual recommended intake levels based on caloric requirements and (2) consumption levels among various demographic groups, intake levels from subtypes of fruits and vegetables, and primary contributors to fruit and vegetable intake.
Design
Analysis of 2-day, 24-hour recall data from the 2003–2004 National Health and Nutrition Examination Survey (NHANES), a continuous, nationally representative, cross-sectional survey.
Results
This study included dietary contributions of fruits and vegetables from all dietary sources. Fewer than 1 in 10 Americans meet their calorie-specific MyPyramid fruit or vegetable recommendations. Higher intake was not observed in subgroups with higher recommendations for fruit and vegetable consumption based on caloric requirements. The primary contributors to total fruit intake were whole fruits among adults and fruit juices among adolescents. The largest single contributor to overall fruit intake was orange juice. Potatoes dominated vegetable consumption, particularly among adolescents, in whom fried potatoes increased the median vegetable intake from 0.72 cup to 1.21 cups per day. Dark green and orange vegetables and legumes accounted for a small portion of vegetable intake, and few people met the recommendations.
Conclusions
Few American adolescents or adults reported consuming the recommended amounts of fruits or vegetables. Increasing consumption will probably require multifaceted approaches that augment educational campaigns with policy and environmental strategies aimed at the food system at large, from farm to plate, including schools, worksites, and retail establishments. Increasing America's fruit and vegetable consumption is an important public health strategy for weight management and reduction of risk for chronic disease.
Introduction
Fruit and vegetable intake is an important part of a healthy diet and is associated with numerous positive health outcomes. These outcomes include reduced risk for chronic diseases and benefits to weight management.[1–10] As a result of these important health benefits, the Dietary Guidelines for Americans 2005 (DGA 2005) have included fruits and vegetables in the “Food Groups to Encourage” guideline, and the US Department of Agriculture's (USDA's) food guide, the current version of which is called MyPyramid, has increased the recommended amounts from previous guidelines.[10,11] MyPyramid provides recommendations for fruits and vegetables based on individual calorie requirements as determined by an individual's age, sex, and physical activity level (Figure) and includes specific recommendations about the types of vegetables (eg, dark green, orange). The increase in the recommended intake of fruits and vegetables from the earlier Food Guide Pyramid to MyPyramid was primarily due to the establishment of Adequate Intake levels for fiber and potassium by the Food and Nutrition Board of the Institute of Medicine.[12,13] MyPyramid's use of age, sex, and physical activity level to individualize fruit and vegetable recommendations is intended to help all Americans consume a nutrient-dense diet to aid and meet the Dietary Reference Intakes for all nutrients.
Figure 1.
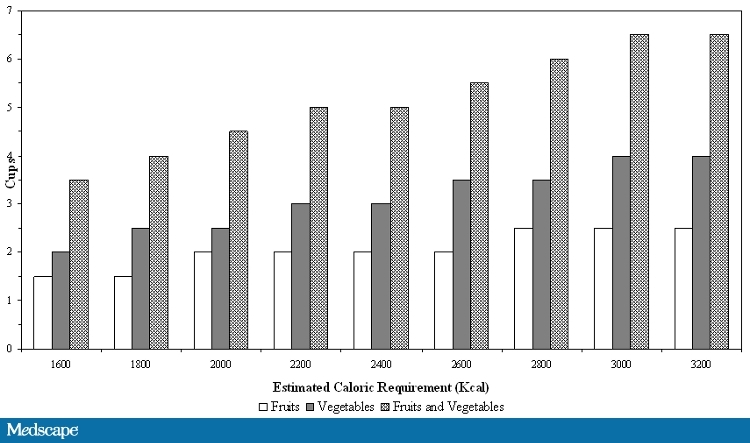
Recommended amounts of fruits and vegetables by MyPyramid caloric requirements for adults and adolescents.
Recent examinations of fruit and vegetable intake have relied on the single-day dietary recall data (with variance adjustments from previous studies) from the 1999–2002 National Health and Nutrition Examination Survey (NHANES) and have assessed the proportion of individuals consuming fruits and vegetables based on age and sex but not activity level, or have not included all sources of fruits and vegetables.[14,15] In the current analysis, we used nationally representative 2-day, 24-hour dietary recall data from the 2003–2004 NHANES to examine total fruit and vegetable consumption from all sources by American adolescents and adults.[16] The primary objective of this paper is to present the percentage of adolescents and adults meeting their fruit, vegetable, and vegetable subtype recommended intake based on the MyPyramid calorie requirements based on age, sex, and self-reported physical activity. We report fruit and vegetable median consumption, the primary contributors to consumption, and the amounts of concurrently consumed sugar and fat that have been added. Also reported are the demographic characteristics of persons meeting fruit and vegetable recommendations. This report is intended to serve as a baseline assessment for the fruit and vegetable recommendations presented in MyPyramid.
Methods
Study Population and Design
This analysis examined fruit and vegetable intake among adolescents (12–18 years of age) and adults (≥19 years of age) using 2 nonconsecutive days of 24-hour dietary recall from the 2003–2004 NHANES. NHANES is a continuous, nationally representative, cross-sectional survey.[17] Children under the age of 12 were not included in this study because physical activity and dietary data were collected by proxy. The data were collected in “What We Eat in America,” the dietary interview component of NHANES. What We Eat in America is conducted as a partnership between the USDA and the US Department of Health and Human Services. The information from the first day is collected in person at the NHANES Mobile Examination Center, and information from the second day is collected by telephone (usually 3–10 days later and on a different day of the week). Eighty-seven percent of Mobile Examination Center participants have 2 days of complete and reliable intakes, as determined by NHANES staff who prepared the data sets. Special sample weights were used to adjust for the additional dietary interview-specific nonresponse and the day of the week of the dietary intake interview. Further details of the dietary collection methods and NHANES have been described elsewhere.[16–18]
Dietary Assessment
The dietary intakes from the 2 days of the 24-hour recall were averaged to estimate fruit and vegetable intake. Mixed dishes were disaggregated to determine the quantities of fruit and vegetable intake. Serving intakes from the NHANES database were then converted into cups. Where appropriate, cup equivalents were used to estimate cup intake, as suggested by the Dietary Guidelines and MyPyramid: 2 cups of leafy salad greens equals 1 cup equivalent of vegetables, and a 1/2 cup of dried fruit or vegetables equals a 1-cup equivalent. Total fruit and vegetable intake includes all dietary sources, regardless of form (ie, whole, juice), processing (eg, canned, frozen, fresh), or other ingredients. Fruit and vegetable subtypes were defined on the basis of USDA food codes. Legumes were included in the total vegetable intake. Definitions for dark green vegetables, orange vegetables, legumes, starchy vegetables, and other vegetables are taken from Appendix A-2 of the DGA 2005.[10] We used the USDA pyramid servings database, version 2, for values of fruit and vegetable servings and cups. This database captures all foods reported in the Continuing Survey of Food Intakes by Individuals (CSFII) 1994–1996 and 1998, and the NHANES 1999–2002 surveys. Thirty-six additional foods present in the NHANES 2003–2004 dietary recall data were not represented in the pyramid servings database, of which 13 foods contained any fruit or vegetable. For these 13 foods, we imputed fruit and vegetable serving and cup values from similar foods in the pyramid servings database. In nearly all cases, this imputation consisted of direct substitution from a similar food (ie, the fruit serving value for yogurt made with fruit and low-fat milk and sweetened with low-calorie sweetener was substituted from yogurt, fruited, nonfat milk, low-calorie sweetener).
Variable Definitions
The MyPyramid Web site provides fruit and vegetable recommendations for specific calorie requirements. The Web site generates the daily fruit and vegetable recommendations based on the user's sex, age, and activity level.[11] Physical activity was determined by asking participants about the duration, frequency, type, and intensity (moderate or vigorous) of their leisure time physical activity over the last 30 days. Because MyPyramid does not distinguish between the intensity of physical activity, the total physical activity was summed and then divided to produce the minutes per day. Categories of physical activity were defined to match those given on the MyPyramid Web site: sedentary (<30 minutes/day), moderately active (30–60 minutes/day), and active (≥60 minutes/day).[11]
On the basis of the average of the 2-day recall, we examined the percentage of individuals meeting the recommended number of fruits and vegetables for their caloric requirements (Figure) and the median consumption of fruits, vegetables, and vegetable subtypes. We used the median among consumers because in most fruit and vegetable subtypes the median for the entire sample was zero. Commonly reported sources of fruit and vegetable intake were estimated by comparing the percentage intake from each type of food at the population level compared with the total population intake.
In addition, we assessed fruits and vegetables concurrently consumed with sugar (added sugar) and fats (discretionary fat). The added sugars included all sugars not naturally occurring (sugar used as ingredients in processed and prepared foods, such as breads, cakes and other grain desserts, soft drinks, jams and jellies, candies, and ice cream). The discretionary fats included all “excess” fats beyond the amounts that would be consumed if only the lowest-fat forms, as defined by MyPyramid, were eaten (vegetable group, 0.218 g per serving, and fruit group, 0.280 g per serving, as determined by USDA Center for Nutrition Policy and Promotion).
We categorized study participants' race/ethnicity as non-Hispanic white, non-Hispanic black, Mexican American, and other, which includes those who report being multiracial. The poverty-to-income ratio (PIR), based on family size, is the poverty level expressed as a ratio of income to the family's poverty threshold level as determined by the US Census Bureau. PIR categories used in this analysis represent approximate quartiles. Study participants' body mass index (BMI) was calculated by dividing their measured weight in kilograms by the square of their measured height in meters. We categorized adults into 3 categories: normal weight (BMI < 25), overweight (BMI 25–29.9), and obese (BMI ≥ 30).[19] We categorized adolescents by using percentiles based on the CDC growth charts as follows: BMI< 85th percentile, 85th ≤ BMI < 95th, and BMI ≥ 95th.[20]
Statistical Analyses
The initial NHANES 2003–2004 sample of adults and adolescents included 6990 persons. The following persons were excluded: pregnant or breast-feeding females (n = 320) and those missing data on pregnancy (n = 134), activity level (n = 4), education (n = 11), height or weight (n = 123), or smoking status (n = 186). Those missing 1 or more 24-hour recalls and those with a 24-hour recall who were determined to be unreliable were also excluded (n = 861). Our final analytic sample consisted of 5576 participants (1667 adolescents and 3909 adults) with 2-day 24-hour dietary recalls. Some participants were excluded on the basis of more than 1 criterion.
All statistics were calculated by using the sampling weights that reflect the probability of selection, nonresponse, and post-stratification adjustments. All standard errors accounted for the complex, multistage cluster sampling. Descriptive statistics included medians, means, standard errors, and confidence intervals. Multivariable logistic regression was used to generate odds ratios, and covariates included sex (adolescents only), age, race, PIR, BMI, physical activity, smoking status, and adults' education levels. P values < .05 were considered to represent a statistically significant difference. SAS software, version 9.1 (SAS Institute, Cary, North Carolina), and SUDAAN software, version 9.0 (Research Triangle Institute, Research Triangle Park, North Carolina), were used for all analyses.
Results
Of the analytic sample, 50.6% were male, the mean age was 42.5 years, 74% were non-Hispanic white, 11.4% were non-Hispanic black, and 7.9% were Mexican American. Twenty-four percent of the sample fell below 1.5 times the poverty-income ratio, and 20.9% fell at or above 5 times the PIR. On the basis of the average of 2 days of dietary recall, the (weighted) percentage of participants meeting recommendations for both fruits and vegetables was very low in all groups: 0.9% of adolescents, 2.2% of adult men, and 3.5% of adult women (Table 1). The percentage of participants meeting fruit recommendations alone was higher, ranging from 6.2% (adolescents) to 12.3% (adult women). Among individuals who consumed fruit, the median intake ranged from 0.51 cup among adolescents to 0.61 cup among adults, and the pattern of intake was similar by subtype for whole fruits and 100% fruit juices, although adolescents consumed less whole fruit and more juice than adults (Table 1). A slightly higher percentage of adults, but not adolescents, met recommendations for vegetable intake than for fruit intake (Table 1). Among consumers, both adolescents and adults consumed higher median quantities of vegetables than fruits, although median vegetable intake among adolescents was much less when fried potatoes were not included. The percentage meeting recommendations for vegetable subtypes was lowest for dark green vegetables, orange vegetables, and legumes but higher for starchy and other vegetables (Table 1).
Table 1.
Percentage of Adolescents and Adults Meeting MyPyramid Calorie-Specific Recommendations and Median Cup Intakes for Fruits, Vegetables, Fruits/Vegetables, and Subtypes*
| Adolescents 12–18 Years | Men ≥19 Years | Women ≥ 19 Years | |||||||
|---|---|---|---|---|---|---|---|---|---|
| (n = 1667) | (n = 2005) | (n = 1904) | |||||||
| Variable | Percentage Consuming† | Median Cups‡ (SE) | Percentage Meeting Recommendations (SE)§ | Percentage Consuming† | Median Cups (SE)‡ | Percentage Meeting Recommendations (SE)§ | Percentage Consuming† | Median Cups (SE)‡ | Percentage Meeting Recommendations (SE)§ |
| Fruits and vegetables | 99.9 | 1.74 (0.06) | 0.9 (0.3)‖ | 99.8 | 2.47 (0.07) | 2.2 (0.5) | 99.8 | 2.16 (0.08) | 3.5 (0.6) |
| Fruits | 89.2 | 0.51 (0.05) | 6.2 (1.0) | 86.4 | 0.61 (0.04) | 8.6 (1.0) | 91.7 | 0.61 (0.06) | 12.3 (1.6) |
| Whole fruit¶ | 45.4 | 0.49 (0.04) | NA | 53.8 | 0.59 (0.03) | NA | 62.0 | 0.62 (0.03) | NA |
| 100% fruit juice | 40.3 | 0.54 (0.04) | NA | 34.0 | 0.50 (0.01) | NA | 38.2 | 0.41 (0.02) | NA |
| All other fruit products** | 73.8 | 0.06 (0.01) | NA | 69.1 | 0.06 (0.01) | NA | 74.0 | 0.06 (0.01) | NA |
| Vegetables | 98.5 | 1.21 (0.04) | 5.8 (0.7) | 99.3 | 1.77 (0.04) | 14.7 (0.9) | 99.6 | 1.42 (0.04) | 18.6 (1.5) |
| Vegetables without fried potatoes†† | 98.0 | 0.72 (0.04) | 2.2 (0.3) | 99.1 | 1.39 (0.03) | 9.0 (0.8) | 99.2 | 1.19 (0.04) | 13.4 (1.4) |
| Vegetable subtypes | |||||||||
| Dark green vegetables | 23.6 | 0.06 (0.02) | 3.6 (0.8) | 35.7 | 0.19 (0.01) | 8.8 (1.1) | 39.5 | 0.25 (0.02) | 12.1 (0.9) |
| Orange vegetables | 32.0 | 0.05 (0.01) | 4.0 (0.8) | 45.4 | 0.08 (0.01) | 7.0 (1.0) | 51.1 | 0.09 (0.01) | 9.0 (0.9) |
| Legumes | 18.9 | 0.25 (0.02) | 5.0 (0.9) | 31.7 | 0.30 (0.02) | 10.9 (1.1) | 28.2 | 0.19 (0.02) | 6.3 (0.7) |
| Starchy vegetables‡‡ | 76.9 | 0.62 (0.04) | 35.2 (2.3) | 77.4 | 0.67 (0.03) | 33.1 (1.7) | 75.3 | 0.50 (0.01) | 42.3 (1.8) |
| Other vegetables | 96.7 | 0.46 (0.03) | 17.3 (1.6) | 97.8 | 0.81 (0.03) | 36.3 (1.6) | 98.0 | 0.69 (0.03) | 37.2 (2.1) |
Data obtained from National Health and Nutrition Examination Survey 2003–2004. Recommendations from Dietary Guidelines for Americans 2005, MyPyramid. NA = not available (no separate recommendations for fruit subtypes); SE = standard error.
Percentage consuming any amount of fruits or vegetables.
Among consumers.
Percentage meeting recommendations among the entire sample, specific recommendations from MyPyramid based on sex, age, and physical activity.
Unstable estimate.
All nonjuice fruit, citrus fruits, dried fruits, berries, and mixtures of fruits, but does not include mixtures of fruit and nonfruit (eg, pies, cakes, yogurt with fruit).
Includes non-100% fruit juice and mixtures of fruit and nonfruit (eg, pies, cakes, yogurt with fruit).
Percentage meeting recommendations without fried potatoes is provided to demonstrate the contribution of fried potatoes; MyPyramid recommendations do include fried potatoes.
Includes all potato products.
Among adults, whole fruit consumption was the highest contributor to fruit consumption, providing about 35% of total intake (Table 2). Overall, most fruits were consumed without added sugar. Among consumers of vegetables, dark green and orange vegetables and legumes represented a small contribution to the total vegetable intake (Table 2). Adolescent vegetable intake was dominated by fried potatoes, tomato products, and other vegetables. The major contributors to adult intake were fried and nonfried potatoes, tomato products, and other vegetables (Table 2). Discretionary grams of fat from vegetable sources ranged from 16.0 g or 144 kcal (women) to 22.3 g or 200 kcal (men).
Table 2.
Contribution to Intake of Fruits and Vegetables Among Consumers*
| Variable | Adolescents 12–18 Years | Men Age ≥ 19 Years | Women Age ≥ 19 Years |
|---|---|---|---|
| Fruit | |||
| Whole raw fruit | 27.3 (2.0) | 34.2 (1.3) | 36.6 (1.7) |
| Mixed fruit | 7.5 (1.1) | 9.7 (0.7) | 11.6 (1.2) |
| Mixed fruit without added sugar | 4.9 (0.8) | 6.2 (0.6) | 7.4 (0.7) |
| Mixed fruit with added sugar | 2.6 (0.6) | 3.5 (0.5) | 4.2 (0.7) |
| 100% fruit juice | 31.3 (2.3) | 22.1 (1.6) | 21.1 (1.0) |
| Non-100% fruit juice | 7.3 (1.2) | 4.0 (0.6) | 3.7 (0.4) |
| All other fruit | 26.6 (1.8) | 30.0 (2.2) | 27.0 (2.1) |
| All other fruit without added sugar† | 1.8 (0.5) | 3.7 (0.7) | 2.3 (0.5) |
| All other fruit with added sugar† | 24.8 (1.8) | 26.3 (1.9) | 24.7 (1.9) |
| Teaspoons of added sugar from fruit† | 4.5 (0.3) | 3.8 (0.2) | 3.1 (0.2) |
| Grams of discretionary fat from fruit‡ | 2.5 (0.2) | 3.6 (0.2) | 3.3 (0.2) |
| Vegetables | |||
| Dark green | 2.6 (0.3) | 5.3 (0.5) | 7.1 (0.3) |
| Orange vegetables | 2.8 (0.3) | 3.7 (0.3) | 5.0 (0.2) |
| Legume | 4.4 (0.6) | 6.6 (0.5) | 5.1 (0.4) |
| Nonfried potatoes | 8.5 (0.9) | 11.4 (0.7) | 11.5 (0.7) |
| Fried potatoes§ | 28.1 (1.5) | 17.8 (1.0) | 14.1 (1.2) |
| Other starchy | 4.0 (0.5) | 4.2 (0.3) | 4.6 (0.3) |
| Tomato | 24.3 (1.0) | 19.8 (0.6) | 18.3 (0.8) |
| Other | 25.3 (1.2) | 31.3 (0.8) | 34.4 (0.7) |
| Teaspoons of added sugar from vegetables† | 0.8 (0.1) | 1.0 (0.1) | 0.7 (0.0) |
| Grams of discretionary fat from vegetables‡ | 21.3 (0.9) | 22.3 (0.6) | 16.0 (0.4) |
Unless otherwise noted, values are the percentage (standard error). Foods were considered sources of fruit or vegetable intake if they contained more than one tenth of a cup per 100 g of food.
Added sugars, which include all sugars used as ingredients in processed and prepared foods, such as breads, cakes, and other grain desserts; soft drinks; jams and jellies; candies; and ice cream sugars, eaten separately or added to foods at the table.
Discretionary fat, which includes all “excess” fat from the 5 major food groups beyond amounts that would be consumed if only the lowest-fat forms were eaten (vegetable group, 0.218 g per serving; fruit group, 0.280 g per serving) and fats added to foods in preparation or at the table, including cream, butter, margarine, regular or low-fat cream cheese, oil, lard, meat drippings, cocoa, and chocolate.
Fried potatoes include French fries, hash browns, home fries, and potato chips.
The main contributor to the percentage of total fruit intake in all age and sex groups was 100% orange juice, generally followed by apples and apple juice, bananas, watermelon, and oranges (Table 3). The top contributor to the total vegetable intake was fried and nonfried potatoes, followed by lettuce, and tomatoes and tomato products (pizza, pasta sauces, and salsa).
Table 3.
Top 10 Reported Fruit and Vegetable Sources as a Percentage of Total Fruit and Vegetable Intake*
| Adolescents (Age 12–18 Years) | Percentage of Total Cup Intake | Men (Age ≥ 19 Years) | Percentage of Total Cup Intake | Women (Age ≥19 Years) | Percentage of Total Cup Intake |
|---|---|---|---|---|---|
| Fruit | |||||
| Orange juice, 100% juice | 26.7 | Orange juice, 100% juice | 22.2 | Orange juice, 100% juice | 17.7 |
| Apple, raw | 9.9 | Banana, raw | 12.7 | Banana, raw | 10.2 |
| Apple juice | 8.1 | Apple, raw | 9.7 | Apple, raw | 8.5 |
| Banana, raw | 6.2 | Orange, raw | 4.6 | Watermelon, raw | 5.4 |
| Orange, raw | 5.5 | Watermelon, raw | 3.8 | Orange, raw | 4.5 |
| Fruit juice drink† | 4.9 | Grapes, raw | 3.5 | Cantaloupe (muskmelon) | 4.0 |
| Grapes, raw | 3.8 | Cantaloupe (muskmelon) | 3.1 | Grapes, raw | 3.4 |
| Watermelon, raw | 3.1 | Apple juice | 2.9 | Cranberry juice drink, cocktail | 3.4 |
| Cranberry juice drink, cocktail | 2.4 | Cranberry juice drink, cocktail | 2.8 | Apple juice | 2.4 |
| Orange juice† | 2.0 | Strawberries, raw | 1.6 | Strawberries, raw | 2.2 |
| Percentage of total reported fruit intake | 72.4 | Percentage of total reported fruit intake | 66.9 | Percentage of total reported fruit intake | 61.6 |
| Vegetables | |||||
| White potato, French fries, chips, hash browns, home fries | 27.7 | White potato, French fries, chips, hash browns, home fries | 18.9 | White potato, French fries, chips, hash browns, home fries | 13.8 |
| White potato, baked/boiled | 13.1 | White potato, baked/boiled | 8.8 | Lettuce, mixed salad greens, raw spinach | 11.7 |
| Lettuce, mixed salad greens, raw spinach | 6.3 | Lettuce, mixed salad greens, raw spinach | 8.5 | White potato, baked/boiled | 8.6 |
| Pasta sauces, various | 5.1 | Beans, various | 5.3 | Tomatoes, raw | 5.8 |
| Pizza | 4.8 | Tomatoes, raw | 4.4 | Beans, various | 3.7 |
| Beans, various | 4.6 | Pasta sauces, various | 2.9 | Pasta sauces, various | 2.7 |
| Tomatoes, raw | 3.0 | Pizza | 2.7 | Cucumber, raw and pickled | 2.6 |
| Tomato catsup | 2.1 | Salsa | 2.1 | Beans, string | 2.3 |
| Salsa | 1.8 | Beans, string | 2.0 | Broccoli | 1.9 |
| Cucumber, raw and pickled | 1.6 | Corn | 1.9 | Pizza | 1.9 |
| Percentage of total vegetable intake | 70.1 | Percentage of total vegetable intake | 57.4 | Percentage of total vegetable intake | 54.9 |
Contribution to total fruits and vegetables consumed by sex and age group. Percentages represent the sum of like items from the 100 top reported foods.
Not further specified.
Among consumers and nonconsumers (combined) of fruits, reported median fruit intake differed little as recommendations increased, although some decline was observed in the percentage meeting recommended intakes among women (Table 4). Among consumers and nonconsumers (combined) of vegetables, median vegetable intakes tended to be higher among those with higher recommended intakes; however, those with higher recommended intakes were still less likely to meet their recommendations (Table 4).
Table 4.
Median Fruit and Vegetable Intake Among All Participants and Percentage Meeting Calorie-Specific MyPyramid Recommendations, as Determined by an Individual's Age, Sex, and Physical Activity Level (n = 5576)*
| Recommendations | Number of Participants | Percentage Distribution of Subgroup | Median (SE)† | Interquartile Range | Percentage Meeting Recommendations (SE) |
|---|---|---|---|---|---|
| Cups of Fruit | |||||
| Male and female adolescents (age 12–18 years) | |||||
| 1.5 | 481 | 29.1 | 0.40 (0.09) | 0.05–0.82 | 7.5 (1.6) |
| 2 | 832 | 49.5 | 0.48 (0.07) | 0.12–0.98 | 5.9 (1.3) |
| 2.5 | 354 | 21.5 | 0.39 (0.08) | 0.02–1.08 | 5.0 (2.3) |
| Men (age ≥19 years) | |||||
| 2 | 1717 | 84.1 | 0.47 (0.04) | 0.03–1.09 | 8.3 (0.9) |
| 2.5 | 288 | 15.9 | 0.47 (0.08) | 0.08–1.08 | 10.2 (3.2) |
| Women (age ≥ 19 years) | |||||
| 1.5 | 1421 | 72.5 | 0.54 (0.07) | 0.15–1.18 | 14.5 (2.0) |
| 2 | 483 | 27.5 | 0.50 (0.07) | 0.10–1.04 | 6.5 (1.9) |
| Cups of vegetables | |||||
| Male and female adolescents (age 12–18 years) | |||||
| 2 | 129 | 7.2 | 0.82 (0.12) | 0.44–1.48 | 5.4 (1.9) |
| 2.5 | 621 | 37.2 | 1.16 (0.08) | 0.57–1.65 | 7.0 (1.7) |
| 3 | 491 | 29.1 | 1.19 (0.08) | 0.65–1.82 | 6.3 (1.9) |
| 3.5 | 189 | 11.8 | 1.24 (0.27) | 0.69–2.45 | 3.4 (1.6) |
| 4 | 237 | 14.7 | 1.45 (0.08) | 0.89–2.24 | 3.6 (2.4) |
| Men (age ≥19 years) | |||||
| 2.5 | 504 | 14.6 | 1.40 (0.08) | 0.88–2.14 | 19.4 (4.0) |
| 3 | 993 | 58.7 | 1.80 (0.04) | 1.16–2.57 | 15.3 (1.2) |
| 3.5 | 344 | 17.4 | 1.89 (0.14) | 1.15–3.06 | 15.3 (2.6) |
| 4 | 164 | 9.2 | 1.75 (0.18) | 1.19–2.85 | 2.7 (1.2) |
| Women (age ≥19 years) | |||||
| 2 | 773 | 32.0 | 1.35 (0.08) | 0.84–1.98 | 24.3 (2.6) |
| 2.5 | 926 | 56.4 | 1.43 (0.05) | 0.93–2.18 | 17.7 (2.0) |
| 3 | 205 | 11.5 | 1.54 (0.11) | 1.02–2.17 | 7.0 (2.5) |
SE = standard error.
Median among entire sample.
Among adolescents, median fruit and vegetable intakes were similar between females and males (Table 5). Odds ratios for the percentage of adolescents meeting fruit or vegetable recommendations did not differ significantly for any demographic characteristic (Table 5).
Table 5.
Median Fruit and Vegetable Intake in Cups Among the Entire Sample and Prevalence and Adjusted Odds of Meeting Calorie-Specific MyPyramid Recommendations, as Determined by Age, Sex, and Physical Activity Level, in Demographic Categories*
| Fruit | Vegetables | |||||
|---|---|---|---|---|---|---|
| Variable | Median Cups (SE) | Percentage Meeting Recommendations (SE) | Odds Ratio (95% CI)† | Median Cups (SE) | Percentage Meeting Recommendations (SE) | Odds Ratio (95% CI) |
| Male and female adolescents (age 12–18 years) | ||||||
| Total | 0.44 (0.05) | 6.2 (1.0) | 1.19 (0.05) | 5.8 (0.7) | ||
| Sex | ||||||
| Male | 0.43 (0.06) | 6.8 (1.5) | 1.00 | 1.29 (0.08) | 5.1 (1.1) | 1.00 |
| Female | 0.44 (0.05) | 5.5 (0.9) | 0.73 (0.42–1.26) | 1.06 (0.08) | 6.5 (1.1) | 1.19 (0.62–2.26) |
| Ethnicity | ||||||
| Non-Hispanic white | 0.39 (0.05) | 5.5 (1.4) | 1.00 | 1.19 (0.07) | 5.6 (1.1) | 1.00 |
| Non-Hispanic black | 0.50 (0.07) | 6.6 (1.1) | 1.11 (0.56–2.17) | 1.16 (0.06) | 4.4 (1.4) | 0.88 (0.41–1.89) |
| Mexican American | 0.49 (0.02) | 6.6 (1.7) | 1.08 (0.46–2.57) | 1.28 (0.08) | 10.2 (1.5) | 1.90 (0.95–3.80) |
| Other‡ | 0.56 (0.11) | 10.4 (3.9) | 1.92 (0.70–5.25) | 1.28 (0.17) | 3.4 (1.9) | 0.57 (0.14–2.31) |
| PIR§ | ||||||
| <1.5 | 0.42 (0.06) | 6.7 (1.4) | 1.79 (0.58–5.56) | 1.27 (0.06) | 6.3 (1.3) | 0.98 (0.32–3.03) |
| v≥1.5 < 3.0 | 0.38 (0.08) | 8.5 (2.3) | (0.63–8.67) | 1.07 (0.08) | 6.9 (1.8) | 1.14 (0.32–4.05) |
| ≥3.0 and < 5.0 | 0.47 (0.05) | 5.4 (1.4) | 1.43 (0.37–5.59) | 1.04 (0.15) | 4.5 (1.5) | 0.86 (0.19–3.77) |
| ≥ 5.0 | 0.53 (0.08) | 3.6 (2.0) | 1.00 | 1.33 (0.15) | 5.4 (2.3) | 1.00 |
| BMI | ||||||
| <85th percentile | 0.46 (0.05) | 6.7 (1.1) | 1.00 | 1.19 (0.06) | 5.3 (0.9) | 1.00 |
| ≥85th and <95th percentile | 0.40 (0.13) | 4.8 (1.8) | 0.67 (0.28–1.61) | 1.30 (0.11) | 9.6 (2.1) | 1.79 (0.92–3.50) |
| ≥95th percentile | 0.35 (0.07) | 5.5 (2.6) | 0.71 (0.28- 1.81) | 1.05 (0.10) | 3.0 (1.1) | 0.51 (0.23–1.13) |
| Leisure-time physical activity | ||||||
| None | 0.39 (0.07) | 8.1 (1.6) | 1.59 (0.63- 3.98) | 1.20 (0.07) | 7.3 (1.3) | 1.91 (0.84–4.32) |
| Moderately active | 0.41 (0.06) | 2.9 (1.1) | (0.16- 1.67) | 1.17 (0.09) | 5.9 (2.1) | 1.49 (0.50–4.47) |
| Active | 0.48 (0.06) | 5.7 (2.1) | 1.00 | 1.24 (0.09) | 3.8 (1.3) | 1.00 |
| Smoking status | ||||||
| Current | 0.34 (0.07) | 7.5 (3.3) | 1.22 (0.48- 3.09) | 1.34 (0.12) | 7.3 (2.3) | 1.50 (0.57–3.90) |
| Former | 0.35 (0.09) | 3.3 (1.7) | 0.47 (0.16- 1.34) | 1.07 (0.16) | 7.2 (1.8) | 1.27 (0.49–3.31) |
| Never | 0.47 (0.06) | 6.3 (1.0) | 1.00 | 1.19 (0.04) | 5.2 (1.0) | 1.00 |
| Men (age ≥19 years) | ||||||
| Total | 0.47 (0.04) | 8.6 (1.0) | 1.76 (0.04) | 14.7 (0.9) | ||
| Age group | ||||||
| 19–30 years | 0.31 (0.08) | 6.7 (1.6) | 1.00 | 1.77 (0.06) | 13.1 (1.8) | 1.00 |
| 31–50 years | 0.42 (0.07) | 9.8 (1.6) | 1.66 (0.88–3.14) | 1.82 (0.05) | 14.2 (1.8) | 1.04(0.54–2.01) |
| 51–70 years | 0.58 (0.04) | 8.4 (1.4) | (0.80–3.72) | 1.77 (0.12) | 16.6 (2.1) | 1.28 (0.72–2.29) |
| ≥ 70 years | 0.74 (0.09) | 8.8 (1.7) | 1.87 (0.91–3.83) | 1.22 (0.10) | 16.0 (3.2) | 1.18 (0.53–2.65) |
| Ethnicity | ||||||
| Non-Hispanic white | 0.46 (0.05) | 8.5 (1.1) | 1.00 | 1.81 (0.05) | 16.1 (1.2) | 1.00 |
| Non-Hispanic black | 0.44 (0.07) | 9.1 (1.7) | 1.08 (0.73–1.61) | 1.29 (0.07) | 7.9 (1.3) | 0.46 (0.31–0.67) |
| Mexican American | 0.62 (0.09) | 10.4 (3.9) | 1.41 (0.53–3.74) | 1.87 (0.14) | 12.4 (3.1) | 0.76 (0.40–1.46) |
| Other‡ | 0.41 (0.09) | 6.2 (2.2) | 0.66 (0.25–1.76) | 1.71 (0.08) | 12.4 (4.0) | 0.79 (0.33–1.86) |
| Education | ||||||
| < High school | 0.41 (0.08) | 5.9 (1.7) | 0.45 (0.23–0.86) | 1.44 (0.09) | 11.7 (2.2) | 0.86 (0.43–1.70) |
| High school graduate | 0.28 (0.05) | 6.0 (1.2) | 0.55 (0.29–1.04) | 1.73 (0.06) | 16.5 (2.3) | 1.26 (0.82–1.93) |
| > High school | 0.61 (0.04) | 10.6 (1.4) | 1.00 | 1.87 (0.07) | 14.8 (1.3) | 1.00 |
| PIR§ | ||||||
| <1.5 | 0.50 (0.07) | 11.0 (2.6) | 2.50 (1.07–5.82) | 1.59 (0.07) | 13.0 (1.9) | 0.83 (0.41–1.66) |
| ≥ 1.5 and <3.0 | 0.45 (0.08) | 7.5 (1.9) | 1.39 (0.63–3.09) | 1.66 (0.07) | 15.9 (2.1) | 0.94 (0.48–1.84) |
| ≥ 3.0 and <5.0 | 0.45 (0.08) | 8.6 (1.8) | 1.35 (0.61–2.99) | 1.71 (0.07) | 10.4 (2.3) | 0.54 (0.28–1.04) |
| ≥ 5.0 | 0.49 (0.07) | 7.8 (1.9) | 1.00 | 2.00 (0.11) | 17.5 (2.7) | 1.00 |
| BMI | ||||||
| < 25.0 | 0.49 (0.07) | 8.8 (1.6) | 1.00 | 1.76 (0.08) | 13.3 (1.8) | 1.00 |
| ≥ 25.0 and < 30.0 | 0.51 (0.05) | 8.9 (1.7) | 0.96 (0.53–1.72) | 1.84 (0.08) | 14.3 (1.7) | 1.05 (0.62–1.78) |
| ≥ 30.0 | 0.39 (0.06) | 8.0 (1.6) | 0.90 (0.41–1.96) | 1.63 (0.08) | 16.7 (2.6) | 1.26 (0.69–2.30) |
| Leisure-time physical activity | ||||||
| None | 0.41 (0.05) | 8.0 (1.3) | 0.81 (0.39–1.70) | 1.70 (0.05) | 15.6 (1.7) | 1.67 (0.83–3.37) |
| Moderately active | 0.72 (0.12) | 10.3 (2.4) | 0.93 (0.48–1.81) | 1.81 (0.13) | 16.7 (4.1) | 1.67 (0.68–4.11) |
| Active | 0.59 (0.06) | 9.1 (2.2) | 1.00 | 1.96 (0.16) | 9.8 (2.3) | 1.00 |
| Smoking status | ||||||
| Current | 0.25 (0.05) | 5.4 (1.7) | 0.42 (0.18–0.97) | 1.69 (0.06) | 13.0 (1.0) | 0.72 (0.45–1.15) |
| Former | 0.72 (0.05) | 6.2 (1.5) | 0.43 (0.20–0.94) | 1.69 (0.11) | 14.3 (1.8) | 0.70 (0.42–1.17) |
| Never | 0.59 (0.07) | 12.8 (2.0) | 1.00 | 1.88 (0.07) | 16.6 (2.0) | 1.00 |
| Women (age ≥19 years) | ||||||
| Total | 0.53 (0.05) | 12.3 (1.6) | 1.42 (0.04) | 18.6 (1.5) | ||
| Age group | ||||||
| 19–30 years | 0.33 (0.07) | 4.5 (1.2) | 1.00 | 1.39 (0.11) | 17.1 (4.4) | 1.00 |
| 31–50 years | 0.50 (0.08) | 11.1 (2.3) | 2.81 (1.34–5.92) | 1.47 (0.06) | 15.1 (2.2) | 0.76 (0.36–1.58) |
| 51–70 years | 0.60 (0.07) | 14.9 (3.4) | 4.05 (1.91–8.56) | 1.46 (0.07) | 23.3 (2.1) | 1.22 (0.55–2.68) |
| ≥ 70 years | 0.87 (0.07) | 21.3 (2.4) | 6.53 (3.37–12.64) | 1.24 (0.07) | 20.1 (3.9) | 1.02 (0.47–2.23) |
| Ethnicity | ||||||
| Non-Hispanic white | 0.49 (0.06) | 11.8 (1.8) | 1.00 | 1.43 (0.05) | 19.2 (1.7) | 1.00 |
| Non-Hispanic black | 0.57 (0.06) | 12.2 (2.5) | 1.45 (0.78–2.72) | 1.21 (0.08) | 13.5 (2.8) | 0.73 (0.45–1.17) |
| Mexican American | 0.57 (0.05) | 15.3 (3.5) | 2.08 (0.86–5.06) | 1.44 (0.13) | 22.7 (3.4) | 1.46 (0.75–2.84) |
| Other‡ | 0.82 (0.18) | 14.9 (4.7) | 1.42 (0.62–3.24) | 1.46 (0.13) | 16.1 (3.6) | 0.85 (0.51–1.42) |
| Education | ||||||
| < High school | 0.51 (0.06) | 11.9 (2.8) | 0.61 (0.33–1.15) | 1.18 (0.08) | 14.9 (1.6) | 0.65 (0.48–0.87) |
| High school grad | 0.50 (0.06) | 10.4 (1.7) | 0.68 (0.48–0.94) | 1.24 (0.09) | 19.3 (3.3) | 0.94 (0.54–1.61) |
| > High school | 0.55 (0.06) | 13.3 (1.9) | 1.00 | 1.56 (0.04) | 19.4 (1.9) | 1.00 |
| PIR§ | ||||||
| <1.5 | 0.50 (0.07) | 10.7 (2.0) | 1.08 (0.50–2.34) | 1.20 (0.05) | 51.5 (3.3) | 0.79 (0.50–1.24) |
| ≥ 1.5 and < 3.0 | 0.49 (0.08) | 11.5 (2.3) | 1.04 (0.67–1.62) | 1.41 (0.09) | 20.0 (3.2) | 0.94 (0.58–1.50) |
| ≥ 3.0 and < 5.0 | 0.54 (0.11) | 15.1 (2.6) | 1.33 (0.74–2.39) | 1.52 (0.07) | 17.7 (2.3) | 0.76 (0.47–1.23) |
| ≥ 5.0 | 0.58 (0.08) | 12.0 (3.0) | 1.00 | 1.56 (0.08) | 21.6 (2.5) | 1.00 |
| BMI | ||||||
| < 25.0 | 0.53 (0.08) | 12.6 (2.2) | 1.00 | 1.42 (0.09) | 17.9 (1.9) | 1.00 |
| ≥ 25.0 and < 30.0 | 0.57 (0.04) | 13.7 (2.0) | 0.88 (0.52–1.50) | 1.41 (0.06) | 19.2 (3.0) | 1.01 (0.58–1.75) |
| ≥ 30.0 | 0.46 (0.08) | 10.5 (2.1) | 0.68 (0.45–1.03) | 1.47 (0.05) | 18.9 (3.2) | 1.04 (0.60–1.78) |
| Leisure-time physical activity | ||||||
| None | 0.51 (0.06) | 13.7 (2.0) | 1.11 (0.44–2.77) | 1.37 (0.06) | 19.9 (1.9) | 3.14 (1.56–6.32) |
| Moderately active | 0.53 (0.06) | 6.0 (1.4) | 0.42 (0.14–1.26) | 1.49 (0.07) | 19.6 (3.3) | 2.66 (1.42–4.97) |
| Active | 0.71 (0.09) | 12.0 (4.4) | 1.00 | 1.60 (0.08) | 8.2 (2.1) | 1.00 |
| Smoking status | ||||||
| Current | 0.26 (0.04) | 7.1 (1.8) | 0.58 (0.29–1.17) | 1.19 (0.06) | 11.9 (2.5) | 0.56 (0.29–1.09) |
| Former | 0.67 (0.06) | 15.7 (2.4) | 1.02 (0.66–1.57) | 1.58 (0.07) | 21.3 (3.0) | 0.99 (0.57–1.75) |
| Never | 0.62 (0.08) | 13.3 (2.2) | 1.00 | 1.43 (0.05) | 20.5 (2.7) | 1.00 |
Data obtained from the National Health and Nutrition Examination Survey, 2003–2004. Bold represents unstable estimates. BMI = body mass index; CI = confidence interval; PIR = poverty-to-income ratio.
Adjusted for sex (adolescents only), age, race, PIR, BMI, physical activity, smoking status, and, for adults, education.
Includes multiracial.
Missing category was included in the analysis but is not reported as a subgroup.
Men with less than a high school education had lower odds of meeting fruit recommendations than those with more than a high school education. Odds of meeting fruit recommendations were higher in men with the lowest PIR (<1.5) than in those with the highest PIR (≥5.0) and lower odds in current and former smokers compared with never-smokers (Table 5). Finally, non-Hispanic black men had lower odds of meeting vegetable recommendations than non-Hispanic white men (Table 5).
The odds of women meeting fruit recommendations were higher for all older age groups compared with women 19–30 years of age, and women with a high school education had lower odds of meeting recommendations than those with more than a high school education (Table 5).
Discussion
This analysis of nationally representative dietary data found that fewer than 1 in 10 Americans met their calorie specific MyPyramid fruit or vegetable recommendations. Depending on caloric requirements, daily recommendations for adolescents and adults range from 1.5 cups to 2.5 cups of fruits and from 2.0 cups to 4.0 cups of vegetables.[11] Fruit and vegetable consumption in these ranges is associated with a reduced risk for stroke, cardiovascular disease, some cancers, and type 2 diabetes and may be a useful component of programs to achieve or maintain weight loss.[1–11] In this study we demonstrate that the higher fruits and vegetables recommendations at higher caloric requirements corresponded to a lower percentage of persons with the higher recommendations meeting their recommendations. Furthermore, we found relatively small differences in the levels of consumption by demographic characteristics, which highlight the need for all Americans to consume more fruits and vegetables.
Whole fruits were the primary contributors to adult fruit intake, and fruit juices were the primary contributors to adolescent fruit intake. The largest single contributor to overall fruit intake was orange juice. Potatoes dominated vegetable consumption, particularly among adolescents, in whom median intake decreased by over half when fried potatoes were not included in vegetable intake. Dark green and orange vegetables and legumes accounted for only a small portion of vegetable intake, and few people met the recommendations for those subtypes. Our use of median intakes among consumers provides an estimate of the amounts that are actually consumed, at least as reported in a 2-day recall, without the values being skewed because of nonconsumers. It is notable that even after considering only consumers, the level of consumption for some vegetable subtypes was very low.
Specific health-promoting elements, such as vitamins, minerals, dietary fibers, carbohydrates, fats, proteins, prebiotics, and phytochemicals, vary greatly among fruits and vegetables, as do the health benefits they promote. The nutrients and bioactive compounds found in fruits and vegetables can vary both positively and negatively because of preparation and processing techniques, including the addition of fats, sugars, and cooking techniques.[21–27] Therefore, in estimating fruit and vegetable intake, this study included all sources of fruits and vegetables regardless of form or preparation method. Notably, we found that, on average, vegetable sources contributed to a large proportion of the discretionary fat and in turn, a large proportion of the discretionary calories allowed in MyPyramid.[11] Determining what foods or ingredients should be counted as contributing toward fruit and vegetable consumption has been inconsistent in nutritional research. For example, earlier surveillance reports have included fried potatoes but excluded potato chips, condiments (eg, catsup), candy, and sweets containing fruit in which fruit was not the main ingredient.[14,28]
Our results from 2003–2004 NHANES largely agree with recent examinations of fruit and vegetable intake, such as those by Casagrande and Guenther and their colleagues, although direct comparison is difficult because of analytic differences and differences in the recommendations employed.[14,15] Guenther and Casagrande and associates relied on earlier data from both the 1999–2000 and the 1999–2002 NHANES, respectively, and used only a single day of dietary recall. Our analysis examined data from 2 nonconsecutive days of 24-hour dietary recalls from the 2003–2004 NHANES. Guenther and colleagues assumed a sedentary activity level for all participants, which can lead to a general underestimation of requirements. In addition, Casagrande and coworkers did not include fruit from sweets in which fruit was not the main ingredient, did not stratify by sex, and used means as a measure of central tendency, as did Gunther and colleagues. Regarding the latter, we present the median as a measure of central tendency because consumption levels of fruits and vegetables are not normally distributed. With these differences noted, our results are similar although more specific, particularly in regard to the comparison to individual recommendations.
Unfortunately, prior assessments of national data failed to demonstrate increases in fruit or vegetable consumption over the past 15 years. Both Casagrande and colleagues' analysis of NHANES data from the 1988–1994 and the 1999–2002 time frames and Serdula and colleagues' analysis of Behavioral Risk Factor Surveillance System (BRFSS) data from 1994 to 2000 showed flat trends in consumption despite the initiation of the national fruit and vegetable program in 1991 and reported increases in knowledge of the recommendations.[14,29,30] This time period, however, has also been characterized by increasing availability of inexpensive, appealing low-nutrient-dense foods and beverages, while fruits and vegetables have increased in cost.[31–34]
Reviews of fruit and vegetable interventions have reported minimal success from approaches limited to educational strategies.[35,36] Interventions that have included multiple strategies, however, tend to result in greater increases in fruit and vegetable consumption.[37–40] These multiple component approaches underscore the need to augment education with community and societal approaches that alter the foodscape.[41,42] Such multifaceted approaches include policy and environmental strategies aimed at the food system at large, from farm to plate and including environments such as schools, worksites, and retail establishments.[43–49] For example, gardening at home, in the community, or at school is a promising approach shown to familiarize and educate about, increase consumption of, and increase access to fruits and vegetables.[49–54] Appropriate rural and urban planning can stimulate local agricultural production, marketed through farmers markets and other direct marketing methods, such as farm-to-institution programs and community-supported agriculture. This planning's goal is to increase the quality, diversity, and availability of fruits, vegetables, and other foods, while giving the consumer a sense of participating in the local economy.[45,55–57] In worksite cafeterias, schools, and restaurants, the food preparation industry needs to meet the challenge to create gastronomically competitive as well as healthy offerings that meet and then inspire the consumers' demand for fruits and vegetables.[58]
In addition to the public health messages to increase fruit and vegetable intake for long-term chronic disease benefit, palatability, preferences, and exposure also play a role in decisions concerning purchasing, preparing, and consuming fruits and vegetables.[52,59–61] Thus, strategies that incorporate the gastronomic attributes inherent in fruits and vegetables, such as culinary customs and cultural identities, may be a more enticing and holistic way to influence the decisions of individuals. For example, the promotion of family meals as a way to build healthy relationships to food, increases fruit and vegetable consumption, and increase the nutritional quality of the diet has been shown to be beneficial.[62–67]
Limitations of this study include the possibility of over- and underreporting of dietary data recall methods.[68] Although this paper relies on expertly collected dietary information, our results may also be limited by having only 2 days of dietary recall, at least for episodically consumed foods. For example, the strength of vegetable subgroup results are limited because the frequency with which some of these foods is consumed is apt to be low; thus, the 2 days of recall used may not adequately capture so-called usual consumption patterns. However, this analysis did not attempt to estimate “usual” intake as suggested by Tooze and colleagues[69]; instead, we chose to rely directly on the large sample of 2-day recalls as a proxy for what is consumed by the population and population subgroups. The heterogeneity of individual dietary practices averaged across a large nationally representative study population, as used in this study, should adequately capture fruit and vegetable consumption patterns, even for subgroups.
Conclusions
In summary, this work augments previous examinations of the American diet by demonstrating that few people are consuming the recommended intake of fruits and vegetables.[70] Increasing fruit and vegetable consumption may require increases in access and availability achieved through policy and environmental incentives focusing on numerous areas in the food system, including farms, distribution networks, midsized processing facilities, retail and institutional food service, and promotion through nutrition assistance programs such as the Food Stamp Nutrition Education Program and Special Supplemental Nutrition Program for Women, Infants, and Children.[71–76]
Increasing Americans' consumption of fruits and vegetables is an important public health strategy for chronic disease risk reduction and weight management. We recommend the application of policy, environmental, and educational approaches to increase fruit and vegetable consumption by making the healthy choice the easy choice, as well as continued monitoring to detect changes in intake.
Disclaimer
CDC Disclaimer: The findings and conclusions in this report are those of the authors and do not necessarily represent the views of the Centers for Disease Control and Prevention.
Footnotes
Reader Comments on: Fruit and Vegetable Intake Among Adolescents and Adults in the United States: Percentage Meeting Individualized Recommendations See reader comments on this article and provide your own.
Contributor Information
Joel Kimmons, Division of Nutrition, Physical Activity, and Obesity, Centers for Disease Control and Prevention, National Center for Chronic Disease Prevention and Health Promotion, Atlanta, Georgia Author's email: jkimmons@cdc.gov.
Cathleen Gillespie, Division for Heart Disease and Stroke Prevention, Centers for Disease Control and Prevention, National Center for Chronic Disease Prevention and Health Promotion, Atlanta, Georgia.
Jennifer Seymour, Division of Nutrition, Physical Activity, and Obesity, Centers for Disease Control and Prevention, National Center for Chronic Disease Prevention and Health Promotion, Atlanta, Georgia.
Mary Serdula, Division of Nutrition, Physical Activity, and Obesity, Centers for Disease Control and Prevention, National Center for Chronic Disease Prevention and Health Promotion, Atlanta, Georgia.
Heidi Michels Blanck, Division of Nutrition, Physical Activity, and Obesity, Centers for Disease Control and Prevention, National Center for Chronic Disease Prevention and Health Promotion, Atlanta, Georgia.
References
- 1.Hu FB. Plant-based foods and prevention of cardiovascular disease: an overview. Am J Clin Nutr. 2003;78(3 Suppl):544S–551S. doi: 10.1093/ajcn/78.3.544S. [DOI] [PubMed] [Google Scholar]
- 2.Riboli E, Norat T. Epidemiologic evidence of the protective effect of fruit and vegetables on cancer risk. Am J Clin Nutr. 2003;78:559–569. doi: 10.1093/ajcn/78.3.559S. [DOI] [PubMed] [Google Scholar]
- 3.Glade MJ. Food, nutrition, and the prevention of cancer: a global perspective. Nutrition. 1999;15:523–526. doi: 10.1016/s0899-9007(99)00021-0. [DOI] [PubMed] [Google Scholar]
- 4.He FJ, Nowson CA, MacGregor GA. Fruit and vegetable consumption and stroke: meta-analysis of cohort studies. Lancet. 2006;367:320–326. doi: 10.1016/S0140-6736(06)68069-0. [DOI] [PubMed] [Google Scholar]
- 5.He K, Hu FB, Colditz GA, Manson JE, Willett WC, Liu S. Changes in intake of fruits and vegetables in relation to risk of obesity and weight gain among middle-aged women. Int J Obes Relat Metab Disord. 2004;28:1569–1574. doi: 10.1038/sj.ijo.0802795. [DOI] [PubMed] [Google Scholar]
- 6.Hung H-C, Joshipura KJ, Jiang R, et al. Fruit and vegetable intake and risk of major chronic disease. J Natl Cancer Inst. 2004;96:1577–1584. doi: 10.1093/jnci/djh296. [DOI] [PubMed] [Google Scholar]
- 7.Sargeant LA, Khaw KT, Bingham S, et al. Fruit and vegetable intake and population glycosylated haemoglobin levels: the EPIC-Norfolk Study. Eur J Clin Nutr. 2001;55:342–348. doi: 10.1038/sj.ejcn.1601162. [DOI] [PubMed] [Google Scholar]
- 8.Rolls BJ, Ello-Martin JA, Tohill BC. What can intervention studies tell us about the relationship between fruit and vegetable consumption and weight management? Nutr Rev. 2004;62:1–17. doi: 10.1111/j.1753-4887.2004.tb00001.x. [DOI] [PubMed] [Google Scholar]
- 9.Tohill BC, Seymour J, Serdula M, Kettel-Khan L, Rolls BJ. What epidemiologic studies tell us about the relationship between fruit and vegetable consumption and body weight. Nutr Rev. 2004;62:365–374. doi: 10.1111/j.1753-4887.2004.tb00007.x. [DOI] [PubMed] [Google Scholar]
- 10.US Department of Health and Human Services and US Department of Agriculture. Dietary Guidelines for Americans, 2005. 6th ed. Washington, DC: US Government Printing Office; 2005. [Google Scholar]
- 11.US Department of Agriculture. MyPyramid. Available at: http://www.mypyramid.gov/index.html Accessed January 15, 2009.
- 12.Institute of Medicine, Food and Nutrition Board. Dietary Reference Intakes for Water, Potassium, Sodium, Chloride, and Sulfate. Washington, DC: National Academies Press; 2004. [Google Scholar]
- 13.Institute of Medicine, Food and Nutrition Board. Dietary Reference Intakes for Energy, Carbohydrate, Fiber, Fat, Fatty Acids, Cholesterol, Protein, and Amino Acids. Washington, DC: National Academies Press; 2005. [Google Scholar]
- 14.Casagrande SS, Wang Y, Anderson C, Gary TL. Have Americans increased their fruit and vegetable intake?: The trends between 1988 and 2002. Am J Prev Med. 2007;32:257–263. doi: 10.1016/j.amepre.2006.12.002. [DOI] [PubMed] [Google Scholar]
- 15.Guenther PM, Dodd KW, Reedy J, Krebs-Smith SM. Most Americans eat much less than recommended amounts of fruits and vegetables. J Am Diet Assoc. 2006;106:1371–1379. doi: 10.1016/j.jada.2006.06.002. [DOI] [PubMed] [Google Scholar]
- 16.National Center for Health Statistics. NHANES 2003–2004 public data release file documentation, 2007.
- 17.Centers for Disease Control and Prevention National Center for Health Statistics. National health and nutrition examination survey. Available at: www.cdc.gov/nchs/nhanes.htm Accessed July 31, 2008.
- 18.Dwyer J, Picciano MF, Raiten DJ. Collection of food and dietary supplement intake data: what we eat in America – NHANES. J Nutr. 2003;133:590–600. doi: 10.1093/jn/133.2.590S. [DOI] [PubMed] [Google Scholar]
- 19.The National Heart, Lung and Blood Institute. Clinical guidelines on the identification, evaluation, and treatment of overweight and obesity in adults. doi: 10.1093/ajcn/68.4.899. Available at: http://www.nhlbi.nih.gov/guidelines/obesity/ob_gdlns.pdf Accessed February 22, 2008. [DOI] [PubMed]
- 20.Kuczmarski RJ, Ogden CL, Guo SS, et al. 2000 CDC growth charts for the United States: methods and development. Vital Health Stat 11. 2002:1–190. [PubMed] [Google Scholar]
- 21.O'Connell OF, Ryan L, O'Brien NM. Xanthophyll carotenoids are more bioaccessible from fruits than dark green vegetables. Nutr Res. 2007;27:258–264. [Google Scholar]
- 22.Castenmiller JJM, West CE, Linssen JPH, van het Hof KH, Voragen AG. The food matrix of spinach is a limiting factor in determining the bioavailability of beta-carotene and to a lesser extent of lutein in humans. J Nutr. 1999;129:349–355. doi: 10.1093/jn/129.2.349. [DOI] [PubMed] [Google Scholar]
- 23.Edwards AJ, Nguyen CH, You CS, Swanson JE, Emenhiser C, Parker RS. Alpha- and beta-carotene from a commercial carrot puree are more bioavailable to humans than from boiled-mashed carrots, as determined using an extrinsic stable isotope reference method. J Nutr. 2002;132:159–167. doi: 10.1093/jn/132.2.159. [DOI] [PubMed] [Google Scholar]
- 24.Brown MJ, Ferruzzi MG, Nguyen ML, et al. Carotenoid bioavailability is higher from salads ingested with full-fat than with fat-reduced salad dressings as measured with electrochemical detection. Am J Clin Nutr. 2004;80:396–403. doi: 10.1093/ajcn/80.2.396. [DOI] [PubMed] [Google Scholar]
- 25.Zaripheh S, Erdman JW Jr. Factors that influence the bioavailablity of xanthophylls. J Nutr. 2002;132:531–534. doi: 10.1093/jn/132.3.531S. [DOI] [PubMed] [Google Scholar]
- 26.van het Hof KH, West CE, Weststrate JA, Hautvast JG. Dietary factors that affect the bioavailability of carotenoids. J Nutr. 2000;130:503–506. doi: 10.1093/jn/130.3.503. [DOI] [PubMed] [Google Scholar]
- 27.Hedren E, Mulokozi G, Svanberg U. In vitro accessibility of carotenes from green leafy vegetables cooked with sunflower oil or red palm oil. Int J Food Sci Nutr. 2002;53:445–453. doi: 10.1080/09637480220164334. [DOI] [PubMed] [Google Scholar]
- 28.Krebs-Smith SM, Cook A, Subar AF, Cleveland L, Friday J. US adults' fruit and vegetable intakes, 1989 to 1991: a revised baseline for the Healthy People 2000 objective. Am J Public Health. 1995;85:1623–1629. doi: 10.2105/ajph.85.12.1623. [DOI] [PMC free article] [PubMed] [Google Scholar]
- 29.Serdula MK, Gillespie C, Kettel-Khan L, Farris R, Seymour J, Denny C. Trends in fruit and vegetable consumption among adults in the United States: behavioral risk factor surveillance system, 1994–2000. Am J Public Health. 2004;94:1014–1018. doi: 10.2105/ajph.94.6.1014. [DOI] [PMC free article] [PubMed] [Google Scholar]
- 30.Stables GJ, Subar AF, Patterson BH, et al. Changes in vegetable and fruit consumption and awareness among US adults: results of the 1991 and 1997 5 a day for better health program surveys. J Am Diet Assoc. 2002;102:809–817. doi: 10.1016/s0002-8223(02)90181-1. [DOI] [PubMed] [Google Scholar]
- 31.Drewnowski A. The real contribution of added sugars and fats to obesity. Epidemiol Rev. 2007;29:160–171. doi: 10.1093/epirev/mxm011. [DOI] [PubMed] [Google Scholar]
- 32.Monsivais P, Drewnowski A. The rising cost of low-energy-density foods. J Am Diet Assoc. 2007;107:2071–2076. doi: 10.1016/j.jada.2007.09.009. [DOI] [PubMed] [Google Scholar]
- 33.Putnam J, Allshouse J. Food Consumption, Prices, and Expenditures, 1970–97. Washington, DC: Food and Rural Economic Division, US Department of Agriculture; 1999. [Google Scholar]
- 34.Putnam J, Allshouse J, Kantor L. U.S. per capita food supply trends: more calories, refined carbohydrates, and fats. Food Rev. 2002;25:2–15. [Google Scholar]
- 35.Pomerleau J, Lock K, Knai C, McKee M. Interventions designed to increase adult fruit and vegetable intake can be effective: a systematic review of the literature. J Nutr. 2005;135:2486–2495. doi: 10.1093/jn/135.10.2486. [DOI] [PubMed] [Google Scholar]
- 36.Bowen DJ, Beresford SA. Dietary interventions to prevent disease. Annu Rev Public Health. 2002;23:255–286. doi: 10.1146/annurev.publhealth.23.100901.140555. [DOI] [PubMed] [Google Scholar]
- 37.Knai C, Pomerleau J, Lock K, McKee M. Getting children to eat more fruit and vegetables: a systematic review. Prev Med. 2006;42:85–95. doi: 10.1016/j.ypmed.2005.11.012. [DOI] [PubMed] [Google Scholar]
- 38.Blanchette L, Brug J. Determinants of fruit and vegetable consumption among 6–12-year-old children and effective interventions to increase consumption. J Hum Nutr Diet. 2005;18:431–443. doi: 10.1111/j.1365-277X.2005.00648.x. [DOI] [PubMed] [Google Scholar]
- 39.Burchett H. Increasing fruit and vegetable consumption among British primary schoolchildren: a review. Health Educ J. 2003;103:99–109. [Google Scholar]
- 40.Moore LV, Diez Roux AV, Nettleton JA, Jacobs DR., Jr Associations of the local food environment with diet quality. Am J Epidemiol. 2008;167:917–924. doi: 10.1093/aje/kwm394. [DOI] [PMC free article] [PubMed] [Google Scholar]
- 41.Pothukuchi K, Kaufman JL. Placing the food system on the urban agenda: the role of municipal institutions in food systems planning. Agr Human Values. 1999;16:213–224. [Google Scholar]
- 42.Jetter KM, Cassady DL. The availability and cost of healthier food alternatives. Am J Prev Med. 2006;30:38–44. doi: 10.1016/j.amepre.2005.08.039. [DOI] [PubMed] [Google Scholar]
- 43.Sobal J, Kettel Khan L, Bisogni C. A conceptual model of the food and nutrition system. Soc Sci Med. 1998;47:853–863. doi: 10.1016/s0277-9536(98)00104-x. [DOI] [PubMed] [Google Scholar]
- 44.Brownson RC, Haire-Joshu D, Luke DA. Shaping the context of health: a review of environmental and policy approaches in the prevention of chronic diseases. Annu Rev Public Health. 2006;27:341–370. doi: 10.1146/annurev.publhealth.27.021405.102137. [DOI] [PubMed] [Google Scholar]
- 45.O'Hara SU, Stagl S. Endogenous preferences and sustainable development. J Socio Econ. 2002;31:511–527. [Google Scholar]
- 46.Bazzano LA. The high cost of not consuming fruits and vegetables. J Am Diet Assoc. 2006;106:1364–1368. doi: 10.1016/j.jada.2006.06.021. [DOI] [PubMed] [Google Scholar]
- 47.French SA, Story M, Jeffery RW. Environmental influences on eating and physical activity. Annu Rev Public Health. 2001;22:309–335. doi: 10.1146/annurev.publhealth.22.1.309. [DOI] [PubMed] [Google Scholar]
- 48.Cassady D, Vogt R, Oto-Kent D, Mosley R, Lincoln R. The power of policy: a case study of healthy eating among children. Am J Public Health. 2006;96:1570–1571. doi: 10.2105/AJPH.2005.072124. [DOI] [PMC free article] [PubMed] [Google Scholar]
- 49.Gustafson A, Cavallo D, Paxton A. Linking homegrown and locally produced fruits and vegetables to improving access and intake in communities through policy and environmental change. J Am Diet Assoc. 2007;107:584–585. doi: 10.1016/j.jada.2007.02.023. [DOI] [PubMed] [Google Scholar]
- 50.Nanney MS, Johnson S, Elliott M, Haire-Joshu D. Frequency of eating homegrown produce is associated with higher intake among parents and their preschool-aged children in rural Missouri. J Am Diet Assoc. 2007;107:577–584. doi: 10.1016/j.jada.2007.01.009. [DOI] [PubMed] [Google Scholar]
- 51.McAleese JD, Rankin LL. Garden-based nutrition education affects fruit and vegetable consumption in sixth-grade adolescents. J Am Diet Assoc. 2007;107:662–665. doi: 10.1016/j.jada.2007.01.015. [DOI] [PubMed] [Google Scholar]
- 52.Cooke L. The importance of exposure for healthy eating in childhood: a review. J Hum Nutr Diet. 2007;20:294–301. doi: 10.1111/j.1365-277X.2007.00804.x. [DOI] [PubMed] [Google Scholar]
- 53.Graham H, Zidenberg-Cherr S. California teachers perceive school gardens as an effective nutritional tool to promote healthful eating habits. J Am Diet Assoc. 2005;105:1797–1800. doi: 10.1016/j.jada.2005.08.034. [DOI] [PubMed] [Google Scholar]
- 54.Hermann JR, Parker SP, Brown BJ, Siewe YJ, Denney BA, Walker SJ. After-school gardening improves children's reported vegetable intake and physical activity. J Nutr Educ Behav. 2006;38:201–202. doi: 10.1016/j.jneb.2006.02.002. [DOI] [PubMed] [Google Scholar]
- 55.Cohen L, Larijani S, Aboelata M, Mikkelsen L. Cultivating common ground: linking health and sustainable agriculture. Oakland, California: Prevention Institute; 2004. [Google Scholar]
- 56.US Department of Agriculture. Rural Development Theme Paper. Available at: http://www.usda.gov/documents/Farmbill07ruraldevelopment.pdf Accessed January 15, 2009.
- 57.Harmon AH, Gerald BL. Position of the American Dietetic Association: food and nutrition professionals can implement practices to conserve natural resources and support ecological sustainability. J Am Diet Assoc. 2007;107:1033–1043. doi: 10.1016/j.jada.2007.04.018. [DOI] [PubMed] [Google Scholar]
- 58.Glanz K, Resnicow K, Seymour J, et al. How major restaurant chains plan their menus: the role of profit, demand, and health. Am J Prev Med. 2007;32:383–388. doi: 10.1016/j.amepre.2007.01.003. [DOI] [PubMed] [Google Scholar]
- 59.Drewnowski AA. Energy density, palatability, and satiety: implications for weight control. Nutr Rev. 1998;56:347–353. doi: 10.1111/j.1753-4887.1998.tb01677.x. [DOI] [PubMed] [Google Scholar]
- 60.Kristjansdottir AG, Thorsdottir I, De Bourdeaudhuij I, Due P, Wind M, Klepp K. Determinants of fruit and vegetable intake among 11-year-old schoolchildren in a country of traditionally low fruit and vegetable consumption. Intl J Behav Nutr Phys Act. 2006;3:1–9. doi: 10.1186/1479-5868-3-41. [DOI] [PMC free article] [PubMed] [Google Scholar]
- 61.Rasmussen M, Krolner R, Klepp KI, et al. Determinants of fruit and vegetable consumption among children and adolescents: a review of the literature. Part I: quantitative studies. Int J Behav Nutr Phys Act. 2006;3(22) doi: 10.1186/1479-5868-3-22. [DOI] [PMC free article] [PubMed] [Google Scholar]
- 62.Gillespie AA, Achterberg CC. Comparison of family interaction patterns related to food and nutrition. J Am Diet Assoc. 1989;89:509–512. [PubMed] [Google Scholar]
- 63.Boutelle KN, Birnbaum AS, Lytle LA, Murray DM, Story M. Associations between perceived family meal environment and parent intake of fruit, vegetables, and fat. J Nutr Educ Behav. 2003;35:24–29. doi: 10.1016/s1499-4046(06)60323-0. [DOI] [PubMed] [Google Scholar]
- 64.Videon TM, Manning CK. Influences on adolescent eating patterns: the importance of family meals. J Adolesc Health. 2003;32:365–373. doi: 10.1016/s1054-139x(02)00711-5. [DOI] [PubMed] [Google Scholar]
- 65.Neumark-Sztainer D, Hannan PJ, Story M, Croll J, Perry C. Family meal patterns: associations with sociodemographic characteristics and improved dietary intake among adolescents. J Am Diet Assoc. 2003;103:317–322. doi: 10.1053/jada.2003.50048. [DOI] [PubMed] [Google Scholar]
- 66.Gillman MW, Rifas-Shiman SL, Frazier AL, et al. Family dinner and diet quality among older children and adolescents. Arch Fam Med. 2000;9:235–240. doi: 10.1001/archfami.9.3.235. [DOI] [PubMed] [Google Scholar]
- 67.Larson NI, Neumark-Sztainer D, Hannan PJ, Story M. Family meals during adolescence are associated with higher diet quality and healthful meal patterns during young adulthood. J Am Diet Assoc. 2007;107:1502–1510. doi: 10.1016/j.jada.2007.06.012. [DOI] [PubMed] [Google Scholar]
- 68.Murphy SP. Collection and analysis of intake data from the integrated survey. J Nutr. 2003;133:585–589. doi: 10.1093/jn/133.2.585S. [DOI] [PubMed] [Google Scholar]
- 69.Tooze JA, Midthune D, Dodd K, et al. A new statistical method for estimating the usual intake of episodically consumed foods with application to their distribution. J Am Diet Assoc. 2006;106:1575–1587. doi: 10.1016/j.jada.2006.07.003. [DOI] [PMC free article] [PubMed] [Google Scholar]
- 70.Patterson BH, Block G, Rosenberger WF, Pee D, Kahle LL. Fruit and vegetables in the American diet: data from the NHANES II survey. Am J Public Health. 1990;80:1443–1449. doi: 10.2105/ajph.80.12.1443. [DOI] [PMC free article] [PubMed] [Google Scholar]
- 71.Buzby JC, Wells HF, Vocke G. Possible implications for U.S. agriculture from adoption of select dietary guidelines. 2006 Economic Research Report No. (ERR-31) 35 pp. [Google Scholar]
- 72.Young E, Johnson D, Krissoff B, Lucier G. Relaxing fruit and vegetable planting restrictions. Amber Waves. 2007:5. (1) [Google Scholar]
- 73.Guthrie JF, Frazão E, Andrews M, Smallwood D. Improving food choices – can food stamps do more? Amber Waves. 2007;5(2) [Google Scholar]
- 74.Herman DR, Harrison GG, Jenks E. Choices made by low-income women provided with an economic supplement for fresh fruit and vegetable purchase. J Am Diet Assoc. 2006;106:740–744. doi: 10.1016/j.jada.2006.02.004. [DOI] [PubMed] [Google Scholar]
- 75.Kropf ML, Holben DH, Holcomb JP, Jr, Anderson H. Food security status and produce intake and behaviors of special supplemental nutrition program for women, infants, and children and farmers' market nutrition program participants. J Am Diet Assoc. 2007;107:1903–1908. doi: 10.1016/j.jada.2007.08.014. [DOI] [PubMed] [Google Scholar]
- 76.Herman DR, Harrison GG, Afifi AA, Jenks E. Effect of a targeted subsidy on intake of fruits and vegetables among low-income women in the special supplemental nutrition program for women, infants, and children. Am J Public Health. 2008;98:98–105. doi: 10.2105/AJPH.2005.079418. [DOI] [PMC free article] [PubMed] [Google Scholar]