Abstract
Objectives
To assess changes in electrical impedance myography (EIM) parameters in amyotrophic lateral sclerosis (ALS).
Methods
10 patients with ALS and a cohort of normal subjects underwent EIM testing of tibialis anterior. Montages using voltage and current electrodes placed at a distance (far) and in close proximity (near) were compared. The EIM parameters resistance (R), reactance (X), and phase (Θ) in the ALS patients were compared to normal values.
Results
Θ measured at 50 kHz using the near montage was most sensitive to the presence of ALS, with 9 of 10 ALS patients having smaller Θ values than the calculated lower limit of normal. Θ using the far montage and X using both the near and far montages were also sensitive to disease, while R did not appear to be useful.
Conclusions
EIM is sensitive to muscle abnormalities in ALS, with Θ measured with near montages providing the best results.
Keywords: muscle, impedance, amyotrophic lateral sclerosis, near-electrode montage, neuromuscular
Introduction
In order to expedite development of effective therapies for amyotrophic lateral sclerosis (ALS), there have been efforts to find biomarkers that are more sensitive to early disease and to subtle changes in disease status than those that are currently available. An ideal test would be able to detect disease in its early and possibly presymptomatic stages, mark progression in a quantifiable, sensitive fashion, and be able to be performed rapidly and non-invasively. For the past 10 years, we have been developing electrical impedance myography (EIM) for the evaluation of neuromuscular disease in the hopes of fulfilling at least several of these criteria.1 Although we have applied EIM to a variety of neuromuscular conditions, including myopathy,2 radiculopathy,3 and amyotrophic lateral sclerosis,4 we have not yet performed a study specifically assessing the ability of EIM to distinguish between patients with neuromuscular disease from the population at large. Confirmation that EIM can achieve this aim would help broaden the application of EIM and could also provide the groundwork to study the technique in presymptomatic states, for example, as a biomarker in early disease detection in relatives of patients with familial ALS.5
EIM is a bioimpedance-based technique in which low-intensity, high-frequency alternating current is applied through surface electrodes, allowing for the measurement of underlying muscle impedance. The two components of muscle impedance are the resistance (R) and the reactance (X), both of which should change in ALS.1 ALS should increase R: the cross-sectional area of a conductor (such as muscle) and R are inversely proportional, so the myocyte atrophy which accompanies ALS would be predicted to increase R. The reason that ALS should produce a decrease in X is somewhat more complicated. Reactance is inversely proportional to capacitance. While the capacitance of each individual atrophied muscle fiber membrane decreases in ALS, the total capacitance for a group of atrophied fibers connected in series is inversely related to the capacitance of the individual components of that group. Thus, the capacitance of the entire group increases in ALS, resulting in a decrease in X. From R and X, a third parameter, the phase (Θ) can be calculated from the formula Θ = arctan (X/R). Most of our work has focused on Θ as the outcome parameter of interest, as it is potentially less sensitive to muscle shape and size than are the two other EIM parameters.1, 6-8 Nevertheless, it remains possible that either X or R may actually provide better sensitivity to disease than Θ, and our previous work has not addressed this question.9, 10 Thus, the second purpose of this set of experiments is to analyze R and X individually as disease markers in ALS.
To date, most of our work in the clinical application of EIM has employed electrical current applied via surface electrodes at a distance from the muscles being assessed. For example, the measurement of impedance of tibialis anterior employs voltage-measuring electrodes placed over the muscle and current-injecting electrodes placed on both feet. This approach, while clearly sensitive to disease severity and progression11, also has certain limitations including only modest muscle specificity, a marked dependence on limb position, and artifacts produced by any joint prostheses. We therefore conducted this set of experiments with the additional purpose of assessing a new electrode montage designed to circumvent these limitations.
Materials and Methods
1. EIM Measurement Equipment
Tetrapolar (four-electrode) impedance measurements were made using a wide-band lock-in amplifier (Signal Recovery Model 7280, Advanced Measurement Technology Inc., Oak Ridge, TN).12 Current was drawn from the 1 V reference output channel at a frequency range from 500 Hz to 1 MHz. Surface voltages were acquired using a very-low-capacitance probe (Tektronix model P6243; Beaverton, OR) at the input of the impedance instrument which converted them into digital signals proportional to R and X. Data was extracted at 50 kHz and stored in a standard computer (Hewlett Packard Pavilion a250n, Palo Alto, CA, USA) through which additional data analysis was performed, in particular calculation of Θ from Θ = arctan X/R.
2. Far-electrode montage placement and measurement
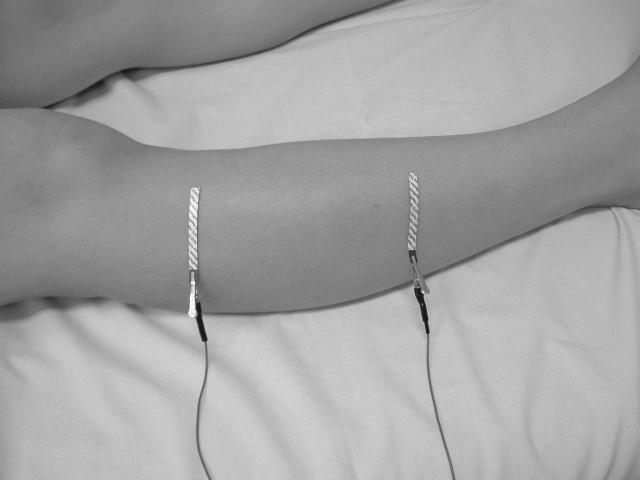
For distant current injection, 20-cm2 disposable ground plate electrodes (part number 019-400500, Viasys; Nicolet Biomedical, Madison, WI) were placed on both feet. Voltage sensing was performed via disposable 5.5-mm wide × 9 cm long Ag/AgCl strip electrodes (Viasys/Nicolet part number 019-766400, cut to a length of 4.5 cm) placed transversely along the long axis of the limb over tibialis anterior, 12.5 cm apart (as shown in figure 1a).
Figure 1.
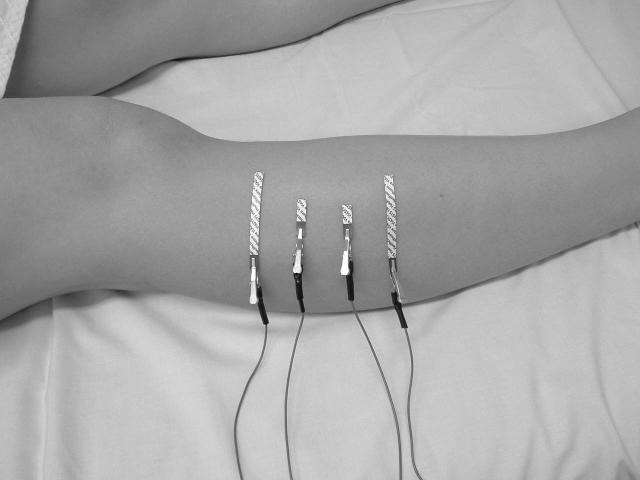
Voltage electrode configurations for EIM using far- (Figure 1a) and near-electrode montages (Figure 1b). The far-electrode configuration for tibialis anterior uses current-injecting electrodes placed on the dorsal surfaces of the feet (not shown), at a distance from the site of voltage measurement. Current electrodes in the near-electrode montage are adjacent to the voltage-measuring electrodes, as shown in Figure 1b.
3. Near-electrode montage placement and measurement
For near current injection, the 5.5 mm wide × 9 cm long adhesive Ag/AgCl strip electrodes were again used, cut to half-length (4.5 cm), and for voltage measurement to one-eighth length (∼1.13 cm). The four electrodes were spaced 2.5 cm apart over the maximal muscle bulk of tibialis anterior (as shown in figure 1b).
4. Subjects
Ten patients ranging in age from 29 to 79 (4 men and 6 women) with ALS as defined by revised El Escorial Criteria13 were recruited. Nine subjects had clinically definite ALS and the tenth had clinically probable ALS. All patients had clinically weak tibialis anterior at the time of testing. Manual muscle testing using the Modified Medical Research Council (MRC) grading system of 0-5 was performed at the time of testing. Normal values for the far-electrode montage were drawn from 87 healthy control subjects ranging in age from 18 to 89 (46 women and 41 men). The control population for the near-electrode montage was 23 subjects ranging in age from 20 to 81 (14 men and 9 women). All subjects signed informed consent forms approved by the Beth Israel Deaconess Committee on Clinical Investigations.
5. Data Analysis
We defined the normal limits for R, X, and Θ in a method similar to those used to define normal limits for other neurophysiological techniques, such as single fiber electromyography14. Because we hypothesize that ALS would be expected to increase R, its upper limit was defined as the cutoff for abnormal. ALS would be predicted to decrease both X and Θ, and their normal limits, therefore, were lower ones. Because the data was substantially skewed, logarithmic transformations were made. The standard deviation of this log-transformed data was calculated, and any data points greater than 4 SDs outside the mean were excluded. The curve was then fitted to a simple quadratic and a parallel curve 1.65 times the standard deviation higher (for R) or lower (for X and Θ) than this quadratic was plotted, representing the 95% limit of normal. The measurements for each ALS patient were compared to these normal limits, with statistical significance determined using the Mann Whitney U.
Results
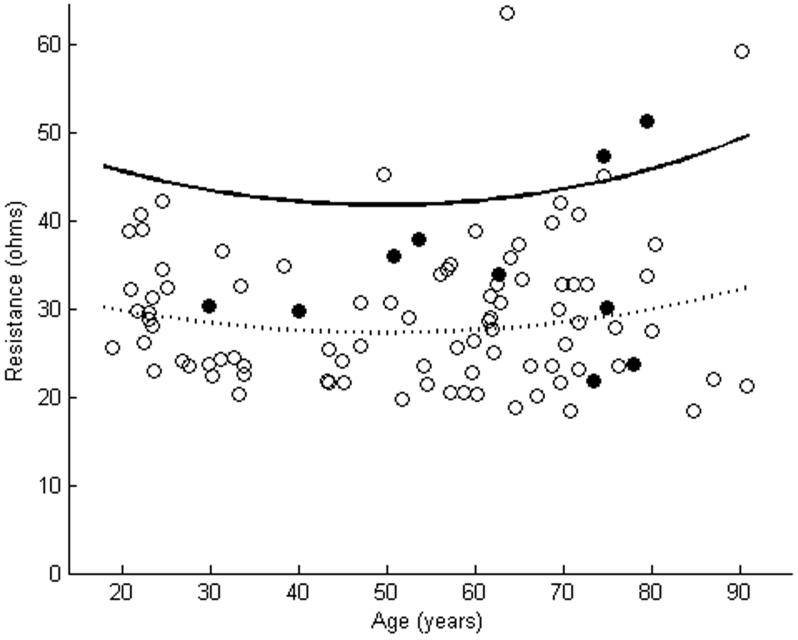
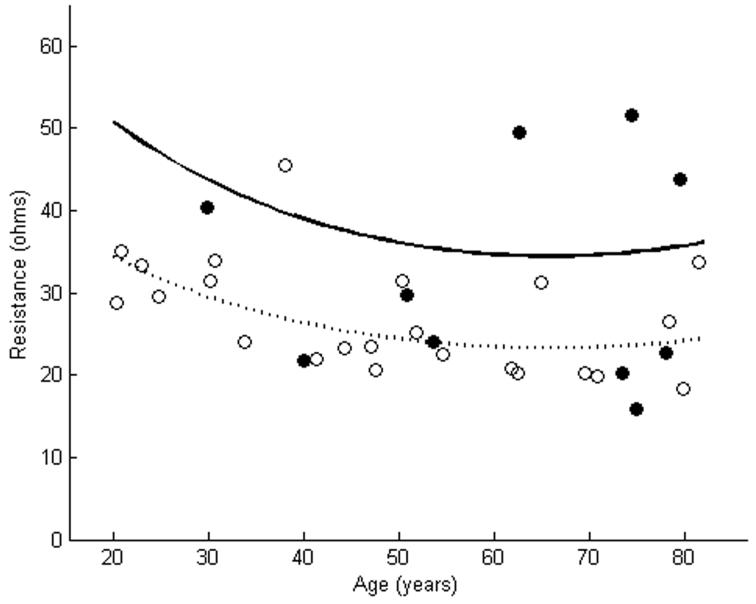
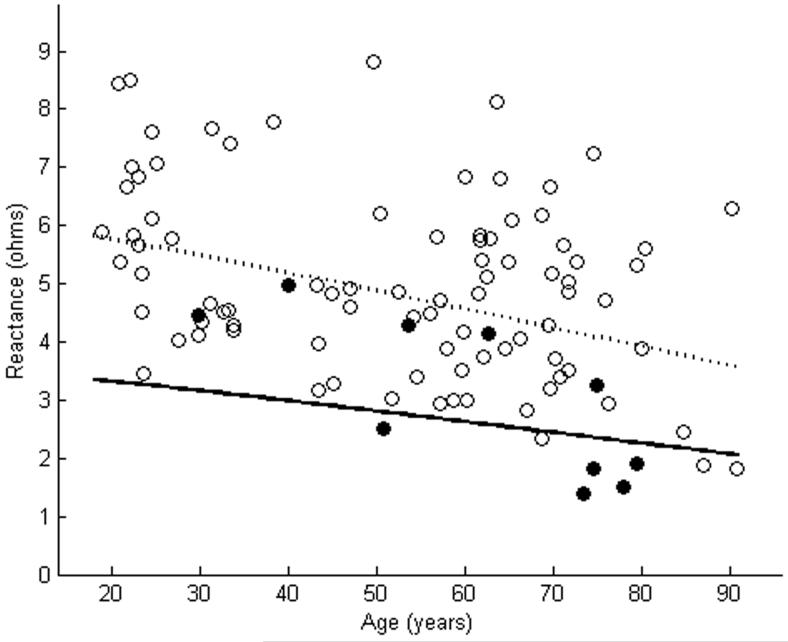
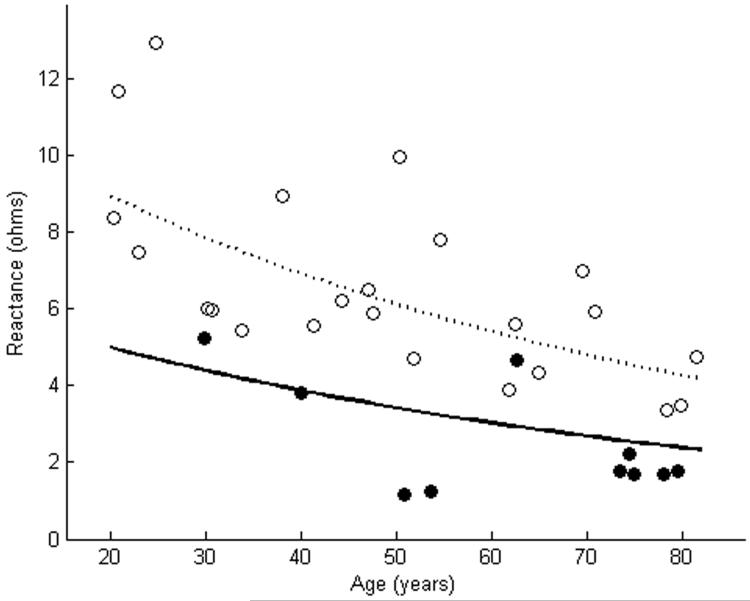
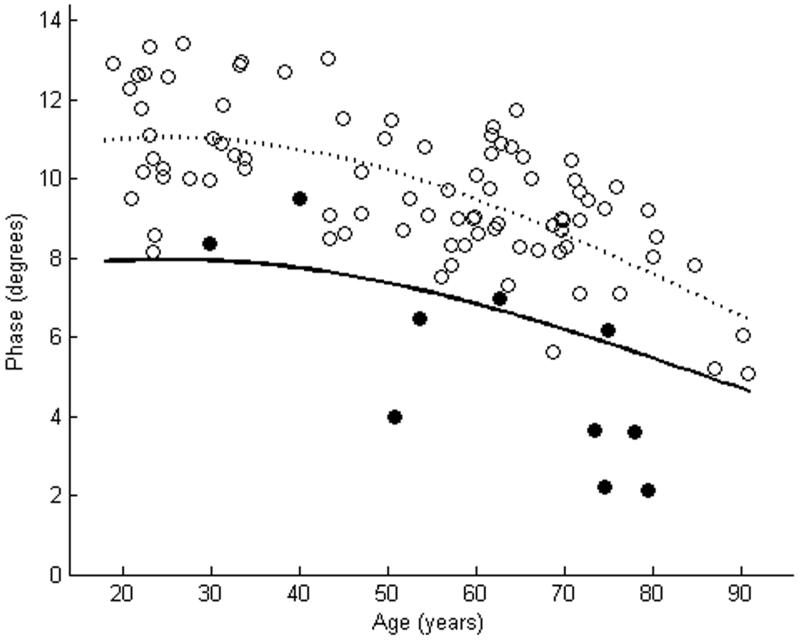
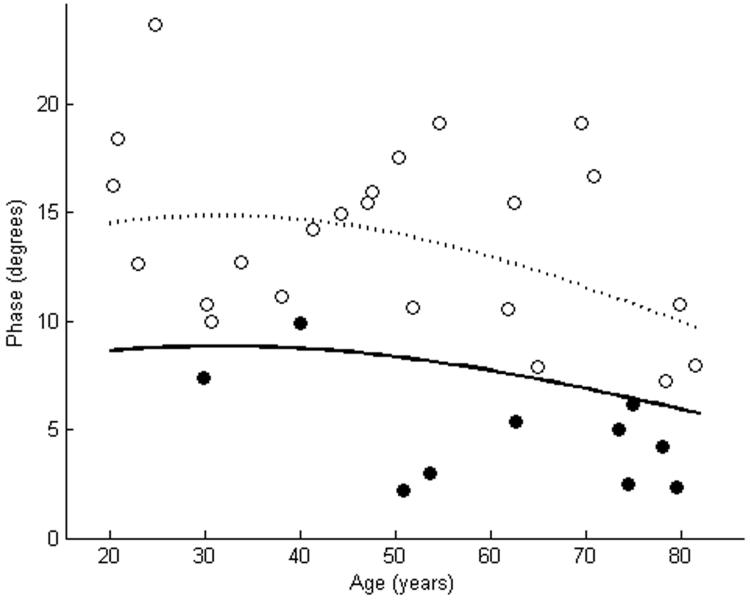
Table 1 shows the clinical characteristics and Θ measurements of the 10 subjects with ALS. A wide variety of disease durations and muscle strengths were noted in the patients. Figures 2-4 show the EIM data in the patients and in the cohort of normal subjects. As the figures suggest, for each of the three parameters, the near-electrode montage was superior to the far-electrode montage in classifying the ALS patient as diseased. Of the six combinations of impedance parameters and montages tested, Θ measured with the near-electrode array was the most sensitive to ALS, with 9 of 10 patients having a Θ value less than the lower limit of normal, a difference which reached statistical significance (p<0.01). Table 2 summarizes the mean values for each of the parameter-montage combinations in both the patients with ALS and in the normal controls, as well as the sensitivities and specificities of the 95% limits. As the table illustrates, Θ using the far-electrode montage and X using both montages were also capable of detecting disease, though none of those combinations was as useful as Θ measured with the near-electrode montage. R did not appear to be useful in discriminating between health and disease.
Table 1.
Clinical characteristics and phase values of ALS patients
| Age, gender | Tibialis Anterior Modified Medical Research Council score (0-5) | Disease Duration (months) | Phase using far electrode montage (degrees) | Phase using near electrode montage (degrees) |
|---|---|---|---|---|
| 78, F | 4+ | 14 | 3.61 | 4.22 |
| 74, F | 0 | 48 | 2.21 | 2.46 |
| 53, F | 0 | 39 | 6.46 | 2.96 |
| 40, M | 4 | 25 | 9.50 | 9.91 |
| 29, F | 2 | 69 | 8.37 | 7.38 |
| 50, M | 4+ | 19 | 4.78 | 2.21 |
| 79, F | 2 | 30 | 2.14 | 2.32 |
| 73, M | 4 | 39 | 3.11 | 5.01 |
| 75, M | 3 | 26 | 6.16 | 6.16 |
| 62, F | 4 | 22 | 7.00 | 5.36 |
Table 2.
EIM parameters with using near- and far-electrode montages in patients with ALS and normal controls
| Normal subjects, mean (standard deviation) | ALS patients, mean (standard deviation) | Sensitivity to ALS of 95% normal limit | Specificity for ALS of 95% normal limit | |
|---|---|---|---|---|
| R, near (ohms) | 26.99 (6.70) | 31.95 (13.16) | 30% | 96% |
| R, far (ohms) | 29.38 (8.31) | 34.18 (9.42) | 20% | 95% |
| X, near (ohms) | 6.60 (2.46) | 2.52 (1.48)* | 80% | 100% |
| X, far (ohms) | 5.00 (1.58) | 3.02 (1.37)* | 50% | 97% |
| Θ, near (degrees) | 13.88 (4.20) | 4.80 (2.52)* | 90% | 100% |
| Θ, far (degrees) | 9.77 (1.82) | 5.31 (2.56)* | 60% | 99% |
p<0.01 using Mann-Whitney U
Discussion
This study demonstrates that 50 kHz Θ measured using a near-electrode montage is able to distinguish patients with ALS from a larger control population with 90% sensitivity. We have previously shown that Θ at 50 kHz, has the potential of being a very sensitive detector of disease progression in ALS,11 but the question of disease detection remained unaddressed in that study. Because EIM was able to identify muscles with even mild weakness, we hypothesize that impedance changes may even be present in clinically unaffected muscles of ALS patients. Though it was not the focus of this study, the ability to identify presymptomatic muscles or susceptible patient populations (as in relatives of patients with familial ALS) would allow earlier disease identification, and foster the study of preventive or neuroprotective therapies.5
Thus far, most of the data gathered with our technique of EIM has evaluated Θ using far-electrode montages, with the value of R and X being relatively underexplored 1-3, 15. Although we did not directly compare the utility of Θ to that of R or X, it does appear here that Θ is the most sensitive of the three paramaters, followed closely by X. Increases in R, in this sample, do not predictably accompany the presence of ALS. In this study, we also found that both near- and far-electrode montages were capable of distinguishing between patients with ALS and controls with a suggestion that the near-electrode montage may be superior. In addition to being possibly more sensitive, this approach to EIM measurement offers improved muscle specificity because both voltage and current electrodes lie in close proximity to the muscle of interest. Moreover, far-electrode EIM configurations are sensitive to nearby joint position, which can produce substantial variation in EIM signature, due to inconsistencies in current distribution. Indeed, in our previous EIM studies,2, 3, 11 it has been our practice to maintain consistent joint position on repeated testing. While it was not the purpose of this set of experiments to assess specifically the effects of joint position variation, this effect is likely to contribute to some of the variability seen with far electrodes; with the near-electrode montage, since current is not passing any joints, the issue is entirely obviated. Finally, using current electrodes placed over the distal limbs additionally limits the technique in individuals with metal in any nearby body segments (e.g. measuring the impedance of the quadriceps in an individual with a prosthetic hip), since current flow is greatly distorted by the very-low resistance path offered by the prosthesis.
There are, however, two potentially significant disadvantages of utilizing the near-electrode configurations as compared to far. First, the near-electrode approach is very sensitive to minor inconsistencies in inter-electrode distances or variations in the orientation of the electrodes themselves. Although the far electrode approach is also sensitive to variation in the placement of the voltage electrodes,3 the presence of nearby current-injecting electrodes increases the possibility of inconsistencies. Second, this montage will be more likely affected by the thickness of the skin-subcutaneous fat layer. A previous study16 has shown that Θ as measured with a far-electrode montage is relatively unaffected by skin-fat thickness, likely because the current is injected at substantial distances to the limb from which measurements are being obtained. However, with the near-electrode montage, current may be more affected by the skin-fat layer before penetrating the muscle itself. Although the electrical current will preferentially flow through muscle as compared to fat7, if the skin-subcutaneous fat layer is excessively thick, it is possible that the current will become considerably dispersed before actually reaching the muscle, producing distorted voltage values. However, the magnitude of this effect is uncertain and even if it is substantial, it may be possible to overcome, by simply applying pressure to the array, and compressing the subcutaneous fat.
Despite these drawbacks, the near-electrode approach to measurement lends itself to several potential enhancements to the EIM technique that are especially appealing in ways that the far-electrode technique does not. First, given that all the measurements are performed in one small area, an integrated EIM unit with pre-formed multi-electrode arrays or electrodes integrated into the unit itself can be utilized in order to help eliminate inconsistencies associated with manual electrode placement. This would have the added advantage of dramatically speeding up the measurement process. Second, another potential advantage of near-electrode montages is the ability to account for muscle anisotropy, the preference of current to conduct parallel to rather than perpendicular to muscle fiber direction.10, 17 The measurement of anisotropy, as studied in the EIM variation known as rotational-EIM, is most promising for distinguishing among neurogenic and myopathic conditions. Nonetheless, it also presents a challenge with both far- and near- montages since accurate repeated electrode placement demands that the electrodes be placed in the identical position relative to the muscle fiber direction each time. By quickly assessing the anisotropy of the muscle with multiple electrodes placed at different orientation to the muscle fibers, the best pairs of electrodes can be chosen and measurements taken, allowing for more consistent results.
Figure 2.
R of tibialis anterior as measured using far-electrode arrays in 10 subjects with ALS is plotted against a cohort of normal subjects (a). In 2 of these cases, R of the ALS patients was greater than the upper limit of normal. R of tibialis anterior as measured using near-electrode arrays showed increases in 3 of 10 ALS patients (b). The dashed line represents the mean, while the solid line represents the upper limit of normal. Closed circles are patients with ALS. Open circles are normal controls.
Figure 3.
X of tibialis anterior as measured using far-electrode arrays in 10 subjects with ALS is plotted against a cohort of normal subjects (a). In 5 of the cases, X of the ALS patients was smaller than the lower limit of normal. X of tibialis anterior as measured using near-electrode arrays showed reductions in 8 of 10 ALS patients (b). The dashed line represents the mean, while the solid line represents the lower limit of normal. Closed circles are patients with ALS. Open circles are normal controls.
Figure 4.
Θ of tibialis anterior as measured using far-electrode arrays in 10 subjects with ALS is plotted against a cohort of normal subjects (a). In 6 of the cases, Θ of the ALS patients was smaller than the lower limit of normal. Θ of tibialis anterior as measured using near-electrode arrays showed reductions in 9 of 10 ALS patients (b). The dashed line represents the mean, while the solid line represents the lower limit of normal. Closed circles are patients with ALS. Open circles are normal controls.
Acknowledgment
This study was funded by the National Institutes of Health Grant RO1-NS42037-01A2, Grant RR01032 to the Beth Israel Deaconess Medical Center General Clinical Research Center.
Footnotes
The authors have no conflicts of interest to disclose.
References
- 1.Rutkove SB, Aaron R, Shiffman CA. Localized bioimpedance analysis in the evaluation of neuromuscular disease. Muscle Nerve. 2002;25(3):390–397. doi: 10.1002/mus.10048. [DOI] [PubMed] [Google Scholar]
- 2.Tarulli A, Esper GJ, Lee KS, Aaron R, Shiffman CA, Rutkove SB. Electrical impedance myography in the bedside assessment of inflammatory myopathy. Neurology. 2005;65:451–452. doi: 10.1212/01.wnl.0000172338.95064.cb. [DOI] [PubMed] [Google Scholar]
- 3.Rutkove SB, Esper GJ, Lee KS, Aaron R, Shiffman CA. Electrical impedance myography in the detection of radiculopathy. Muscle Nerve. 2005;32:335–341. doi: 10.1002/mus.20377. [DOI] [PubMed] [Google Scholar]
- 4.Rutkove SB, Zhang H, Schoenfeld DA, Raynor EM, Shefner JM, Cudkowicz ME, et al. Electrical impedance myography to assess outcome in ALS clinical trials. Clin Neurophysiol. 2007;118:2413–2418. doi: 10.1016/j.clinph.2007.08.004. [DOI] [PMC free article] [PubMed] [Google Scholar]
- 5.Benatar M, Polak M, Kaplan S, Glass J. Preventing familial amyotrophic lateral sclerosis: is a clinical trial feasible? J Neurol Sci. 2006;251:3–9. doi: 10.1016/j.jns.2006.05.069. [DOI] [PubMed] [Google Scholar]
- 6.Nie R, Sunmonu A, Chin AB, Lee KS, Rutkove SB. Electrical impedance myography: transitioning from human to animal studies. Clin Neurophys. 2006;117:1844–1849. doi: 10.1016/j.clinph.2006.03.024. [DOI] [PubMed] [Google Scholar]
- 7.Shiffman CA, Aaron R, Amoss V, Therrien J, Coomler K. Resistivity and phase in localized BIA. Phys Med Biol. 1999;44(10):2409–2429. doi: 10.1088/0031-9155/44/10/304. [DOI] [PubMed] [Google Scholar]
- 8.Shiffman CA, Aaron R, Altman A. Spatial dependence of the phase in localized bioelectrical impedance analysis. Phys Med Biol. 2001;46(4):N97–104. doi: 10.1088/0031-9155/46/4/402. [DOI] [PubMed] [Google Scholar]
- 9.Foster KR, Lukaski HC. Whole-body impedance--what does it measure? Am J Clin Nutr. 1996;64:S388–S396. doi: 10.1093/ajcn/64.3.388S. [DOI] [PubMed] [Google Scholar]
- 10.Aaron R, Huang M, Shiffman CA. Anisotropy of human muscle via non-invasive impedance measurements. Phys Med Biol. 1997;42(7):1245–1262. doi: 10.1088/0031-9155/42/7/002. [DOI] [PubMed] [Google Scholar]
- 11.Rutkove SB, Zhang H, Schoenfeld DA, Raynor EM, Shefner JM, Cudkowicz ME, et al. Electrical impedance myography to assess outcome in amyotrophic lateral sclerosis clinical trials. Clin Neurophysiol. 2007;118:2413–2418. doi: 10.1016/j.clinph.2007.08.004. [DOI] [PMC free article] [PubMed] [Google Scholar]
- 12.Esper GJ, Shiffman CA, Aaron R, Lee KS, Rutkove SB. Assessing neuromuscular disease with multifrequency electrical impedance myography. Muscle Nerve. 2006;34:595–602. doi: 10.1002/mus.20626. [DOI] [PubMed] [Google Scholar]
- 13.Brooks BR, Miller RG, Swash M, Munsat TL. El Escorial revisited: revised criteria for the diagnosis of amyotrophic lateral sclerosis. Amyotroph Lateral Scler Other Motor Neuron Disord. 2000;1:293–299. doi: 10.1080/146608200300079536. [DOI] [PubMed] [Google Scholar]
- 14.Ad Hoc Committee of the AAEEM Special Interest Group on Single Fiber EMG Single fiber EMG reference values: a collaborative effort. Muscle Nerve. 1992;15:151–161. doi: 10.1002/mus.880150205. [DOI] [PubMed] [Google Scholar]
- 15.Aaron R, Esper GJ, Shiffman CA, Bradonjic K, Lee KS, Rutkove SB. Effects of age on muscle as measured by electrical impedance myography. Physiol Meas. 2006;27:953–959. doi: 10.1088/0967-3334/27/10/002. [DOI] [PubMed] [Google Scholar]
- 16.Tarulli AW, Chin AB, Lee KS, Rutkove SB. Impact of skin-subcutaneous fat layer thickness on electrical impedance myography measurements: an initial assessment. Clin Neurophys. 2007;118:2393–2397. doi: 10.1016/j.clinph.2007.07.016. [DOI] [PMC free article] [PubMed] [Google Scholar]
- 17.Tarulli AW, Chin AB, Partida RA, Rutkove SB. Electrical impedance in bovine skeletal muscle as a model for the study of neuromuscular disease. Physiol Meas. 2006;27:1269–1279. doi: 10.1088/0967-3334/27/12/002. [DOI] [PubMed] [Google Scholar]


