

Abstract
Objective
Recent research has shown dissociation between changes in brain and muscle signals during voluntary muscle fatigue, which may suggest weakening of functional corticomuscular coupling. However, this weakening of brain-muscle coupling has never been directly evaluated. The purpose of this study was to address this issue by quantifying EEG-EMG coherence at times when muscles experienced minimal versus significant fatigue.
Methods
Nine healthy subjects sustained an isometric elbow flexion at 30% maximal level until exhaustion while their brain (EEG) and muscle (EMG) activities were recorded. The entire duration of the EEG and EMG recordings was divided into the first half (stage 1 with minimal fatigue) and second half (stage 2 with severer fatigue). The EEG-EMG coherence and power spectrum in each stage was computed.
Results
The power of both EEG and EMG increased significantly while their coherence decreased significantly in stage 2 compared with stage 1 at beta (15-35 Hz) band.
Conclusions
Despite an elevation of the power for both the EEG and EMG activities with muscle fatigue, the fatigue weakens strength of brain-muscle signal coupling at beta frequency.
Significance
Weakening of corticomuscular coupling may be a major neural mechanism contributing to muscle fatigue and associated performance impairment.
Keywords: Muscle fatigue, EEG-EMG coherence, corticomuscular coupling, elbow flexion, power of frequency
Introduction
Voluntary motor performance is a result of the cortical command driving muscle actions. Fatigue caused by prolonged voluntary muscle activities can be attributed to failure of the central or peripheral system. Accumulating evidence suggests contributions from both systems to muscle fatigue (review: Gandevia 2001), yet many studies reported discrepancies between fatigue at muscular and supraspinal levels. For example, the level of electromyogram (EMG) of the finger flexor muscles kept increasing during a sustained handgrip contraction at 30% maximal level, but the activity level of the primary motor cortex (measured by functional MRI) contralateral to the performing hand began to decline long before the subjects felt exhausted and terminated the contraction (Liu et al. 2003). Similar dissociation between signal alterations at muscular and supraspinal levels has been observed during muscle fatigue induced by maximal voluntary contractions (MVC) (Butler et al., 2003; Gandevia et al., 1996; Liu et al., 2005a; Liu et al., 2005b). Furthermore, impairment of neuromuscular junction transmission function, especially with fatigue at low-intensity activity levels (Fuglevand et al., 1995; Fuglevand et al., 1993) and inhibitory feedback from the fatiguing muscle(s) to the output neurons at supraspinal levels (Garland, 1991; Garland and Kaufman, 1995) would likely complicate the input (from the brain) and output (muscle) relation and may further enlarge the corticomuscular dissociation. The unparallel changes of the signals between the muscle and central nervous system suggest decoupling of the two signals. However, this fatigue-related weakening of brain-muscle coupling has never been directly investigated. Understanding this phenomenon would help better elucidate fatigue mechanisms and develop therapies for treating the vast fatigue symptoms in clinical populations.
The strength of corticomuscular signal coupling during voluntary motor actions was first systematically estimated by calculating coherence between magnetoencephalography (MEG) recorded from the scalp and surface EMG of the first dorsal interosseous muscle (Conway et al., 1995). Although the physiological basis of corticomuscular coherence has been far from clear, it is now generally accepted that corticomuscular coherence reflects communications between the brain and muscle, which is considered to be related to controlling force and modulating fatigue (Feige et al., 2000; Kilner et al., 2000; Kilner et al., 1999; Marsden et al., 2000), and the communications are thought to be mediated by the direct corticospinal pathway (Mima and Hallett, 1999). Significant coupling between signals of the brain and muscle mainly at beta (15-35 Hz) frequency band during voluntary motor performance has been reported in healthy subjects, either in electroencephalography (EEG)-EMG (Kristeva et al., 2007) or MEG-EMG coherence studies (Conway et al., 1995; Kilner et al., 2000). Abnormal features of corticomuscular coupling have been reported with the coherence measurements in movement disorders, such as stroke (Mima et al., 2001), tremor (Hellwig et al., 2000; Volkmann et al., 1996) and Parkinson's disease (Salenius et al., 2002), suggesting impairments in corticomuscular communication in the patients. The purpose of this study was to evaluate the effect of muscle fatigue on functional corticomuscular coupling by determining EEG-EMG coherence during two stages of a sustained voluntary muscle contraction, one with minimal fatigue and the other with severer fatigue. It was hypothesized that fatigue would weaken the strength of the coupling based on differential effects of fatigue on the central and muscular systems. Throughout the manuscript, we define functional corticomuscular coupling as brain-muscle signal relationship on frequency domain measured by the EEG-EMG coherence.
Results
On average, the sustained contraction lasted for 461±45 s (range: 416 to 506 s) in the nine subjects. The force and EMG results in the two stages of the sustained elbow flexion contraction were plotted as shown on Fig 1. Force was well maintained at about 30% maximal level (stage 1, 31.1% ± 2.45%; stage 2, 31.3% ± 2.43%). There was no significant difference in the force between stages 1 and 2 (P > 0.05). However, force variation (SD) in stage 2 (1.19 ± 0.27%) was greater than in stage 1 (0.80 ± 0.13%) (P < 0.05), indicating that although the mean force did not change, the force was less steady in stage 2 (Fig. 1A). Surface EMG signals of both the agonist (BB, BR) muscles increased significantly from less than 30% to near 40% maximal level (P < 0.01, Fig. 1B). The increase of the EMG of the elbow flexor muscles in stage 2 indicated that subjects had to increase their effort to maintain the same force, which was an indication of fatigue.
Fig. 1.

Group averages of sustained force amplitude and variation (A), and surface EMG (B) for the two stages. Force and EMG were normalized to the maximal voluntary contraction (MVC) level. Force was maintained at the target level (30% MVC) for both stages, but the force became more variable or less steady in stage 2. The EMG level increased significantly in the fatigue stage (stage 2) for the two elbow-flexion muscles. BB, biceps brachii; BR, brachioradialis. *P ≤ 0.05; **P ≤0.01.
EEG-EMG coherence decreased significantly in stage 2 compared with stage 1 at the beta band. A typical example of EEG (left scalp area)-EMG (BR muscle) coherence spectrum for one subject is shown in Fig 2A. This subject showed substantially reduced EEG-EMG coherence in stage 2 in the left scalp area with all the muscles at the beta band. The subject exhibited significant coherence peaks within the beta band in stage 1. In stage 2, however, the coherence peaks either decreased or disappeared almost entirely. In contrast, the power of both the EEG and EMG signals increased at beta band in stage 2 (Fig. 2B, 2C). Individual and pooled coherence spectra from electrodes with the maximum coherence in stage 1 between the left scalp area and EMG of the BR and TB muscle also confirmed this decrease of the coherence from stage 1 to stage 2 (Fig. 3). In addition, the average peak coherence frequency across electrodes of the five scalp areas is shown in Table I. The peak-coherence frequencies were mostly within the beta band in both stages for the 9 subjects, which did not differ substantially among the subjects or between stages.
Fig. 2.

A single-subject example of average EEG-EMG coherence spectra between EEG of the left area and EMG of the brachioradialis (BR) muscle (A), EEG power spectrum of the left area (B), and EMG power spectrum of the BR muscle (C) in the two stages. On the coherence spectrum (A), a significant coherence peak at 30 Hz is clearly seen in stage 1 (thick line). In stage 2, however, the significant coherence peak disappeared (thin line). The horizontal line in A indicates 95% confidence level. The EEG power increased in stage 2 (thin line), especially in beta band (B). The EMG power elevated on the entire analyzed spectrum (C) in stage 2 (thin line).
Fig. 3.

Coherence spectra of two individual subjects (subject 8, top row; subject 9, middle row) and the pooled spectra (bottom row) from the electrodes with the maximum coherence in stage 1 between the left scalp area EEG and BR EMG (left column), and left area EEG and TB EMG (right column) in the two stages. The coherence peaks at beta band in stage 1 (thick lines) either decreased or disappeared almost entirely in stage 2 (thin lines). The horizontal line in each plot indicates 95% confidence level.
Table I.
Average peak coherence frequency of individual subjects (Sub 1-9) in stages 1 and 2. The average peak coherence frequency (mean ± standard deviation) in each subject was derived based on the peak coherence in each of the five scalp areas. Sub1: subject 1.
| Sub 1 | Sub 2 | Sub 3 | Sub 4 | Sub 5 | Sub 6 | Sub 7 | Sub 8 | Sub 9 | |
|---|---|---|---|---|---|---|---|---|---|
| Stage1 | 24.5±8.5 | 17.4±7.6 | 19.0±6.4 | 23.7±8.3 | 22.1±6.4 | 25.7±7.1 | 24.9±7.8 | 27.9±4.2 | 22.9±6.6 |
| Stage2 | 26.2±10.5 | 18.6±7.5 | 19.4±5.5 | 24.5±9.3 | 13.7±5.2 | 21.4±6.0 | 25.7±9.5 | 22.9±6.2 | 24.2±5.8 |
The first three rows of Figure 4 display coherence maps (average of the 9 subjects) based on electrodes within the five selected scalp areas with EMG of the three muscles for stage 1 (left column) and stage 2 (right column) at the beta band (15-35 Hz). Only significant coherence values were counted for each subject. The color bar indicates color-coded Z-transformed coherence values. The figure shows clearly that the level of coherence declined substantially in the fatigued compared to less-fatigued stage. The strongest coherence was located in the central-left-parietal areas in stage 1, especially for the two elbow flexor muscles (BB and BR). However, the spatial distribution of the coherence on the scalp with all the muscles altered dramatically in stage 2 with a majority of EEG channels showing weaker coherence and shifted scalp areas demonstrating strongest coherence (e.g., strong EEG-BB EMG coherence shifted from central-left [stage 1] to central-right [stage 2]; Fig. 4, top row). Figure 4 (bottom row) also shows spatial distributions of normalized EEG power in stage 1 (left column) to stage 2 (right column) at the beta band. The EEG power increased substantially in stage 2 compared with stage 1, especially in the upper left and upper right scalp areas.
Fig. 4.
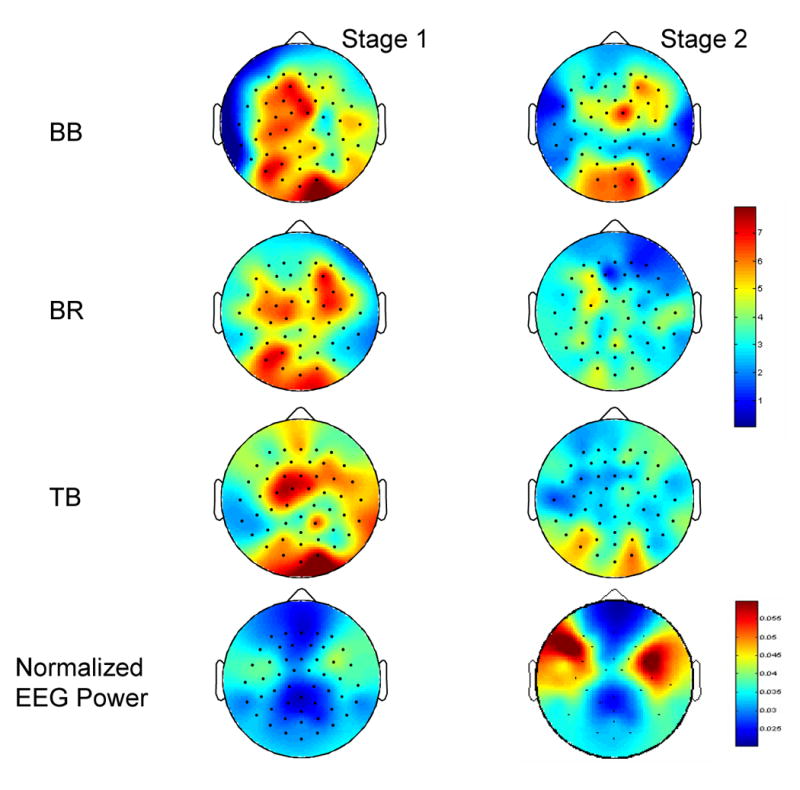
Mapping of EEG-EMG coherence (frist three rows) based on coherence values of electrodes within the five selected scalp areas with EMG of the three muscles at beta (15-35 Hz) band in 9 subjects and mapping of normalized EEG power (bottom row) averaged across 9 subjects. The upper color bar indicates Z-transformed coherence values. The lower color bar indicates normalized EEG power values. The level of coherence declined substantially in stage 2 (fatigue condition, right column) compared with stage 1 (left column). The EEG power increased significantly in the upper left and right scalp areas in stage 2.
It is noticed that the high EEG-EMG coherence occurred in the parietal area (Fig. 4), which somewhat differed from MEG-EMG coherence distributions reported in the literature (Kilner et al. 2000; Tecchio et al. 2006). In these studies, the strongest coherence appeared above the contralateral sensorimotor regions. It is known that the MEG signal is free of influence of volume conductance, which would make its coherence with the EMG more isolated and clear on the scalp compared with the EEG-EMG coherence map. Nevertheless, the EEG-EMG coherence distribution revealed by the current study is qualitatively similar to that reported in the literature; a higher level of the coherence was detected in the contralateral (left) hemisphere in stage 1. Mima et al. (2000) reported a similar finding of EEG-EMG coherence distribution under non-fatigue condition. The strong coherence above the parietal area near the occipital lobe could be influenced by performance-related activities in the visual cortex as the subjects had to match the target force provided by visual feedback.
Statistical analysis of significant coherence values and bin numbers by a general linear model of repeated measures showed significantly lower corticomuscular coherence for stage 2 compared with stage 1 at beta band. No significant area-muscle-stage interaction was observed on the coherence measure, indicating the fatigue-related reduction in the coherence was a uniform phenomenon across scalp areas and muscles. The top row in Fig. 5 shows the number of frequency bins within beta band (15-35 Hz) exhibited significant EEG-EMG coherence for all the scalp areas and muscles. Each displayed bin number for a given area-muscle combination in a given stage (e.g., left [L] area EEG with BB muscle EMG in stage 1) was derived by averaging the numbers across the EEG electrodes in a (e.g., left) scalp area with EMG of a muscle (e.g., BB) in a contraction stage (e.g., stage 1) in each subject first and then across the 9 subjects. The number of significant coherence bins within beta band was significantly smaller in stage 2 compared with stage 1 in all area-muscle combinations. Note that the bin number in Fig. 5 (upper row) was relatively small; this was primarily a result of spatial smoothing. For example, if one electrode was found to have 4 significant coherence bins in beta band in the left area (10 electrodes in each area), then the significant coherence bin number in this area would be only 0.25 (4 bins/10 electrodes). For the Z-transformed coherence amplitude, the value was also significantly lower in stage 2 vs. stage 1 for all the scalp area-muscle combinations (Fig. 5, bottom row). The average significant coherence bin numbers and amplitude values in each scalp area and muscle calculated by an additional criterion of having at least two adjacent coherence values higher than the 95% confidence level are shown in Tables II and III. Tables IV and V show the comparisons of the number of frequency bins and values with significant EEG-EMG coherence (using this additional criterion) in the electrodes with maximum coherence in each of the five scalp areas and three muscles at beta frequency band. These results further confirmed the data reported in Figure 5.
Fig. 5.

Comparisons of the number of frequency bins with significant EEG-EMG coherence (upper row) and Z-transformed EEG-EMG coherence amplitude (lower row) between stages 1 and 2 among the five scalp areas and three muscles at beta frequency band. The data were based on results of nine subjects. Both the number of bins and the coherence amplitude significantly decreased with muscle fatigue (P < 0.01). Because there was no significant stage-area-muscle interaction, no post-hoc pair-wise comparisons were performed. BB, biceps brachii; BR, brachioradialis; TB, triceps brachii; L, left area; R, right area; F, frontal area; C, central area; P, parietal area.
Table II.
Comparisons of numbers of frequency bins with significant EEG-EMG coherence between stages 1 and 2 among the five scalp areas and three muscles at beta frequency band. The data (mean ± standard error) were based on results of nine subjects with an additional criterion of having at least two adjacent coherence values higher than the 95% confidence level (see Results for details). BB, biceps brachii; BR, brachioradialis; TB, triceps brachii.
| Left | Right | Frontal | Central | Parietal | |
|---|---|---|---|---|---|
| BB-Stage1 | 0.71±0.18 | 0.82±0.16 | 0.87±0.18 | 0.99±0.20 | 1.10±0.29 |
| BB-Stage2 | 0.20±0.07 | 0.32±0.10 | 0.59±0.12 | 0.42±0.11 | 0.70±0.18 |
| BR-Stage1 | 0.56±0.12 | 0.61/0.12 | 0.52±0.12 | 0.57±0.11 | 0.81±0.19 |
| BR-Stage2 | 0.43±0.10 | 0.34±0.08 | 0.3±00.08 | 0.30±0.07 | 0.38±0.10 |
| TB-Stage1 | 0.57±0.15 | 0.88±0.17 | 0.58±0.10 | 0.89±0.13 | 0.99±0.26 |
| TB-Stage2 | 0.44±0.10 | 0.32±0.08 | 0.35±0.09 | 0.23±0.07 | 0.64±0.18 |
Table III.
Comparisons of Z-transformed EEG-EMG coherence amplitude above the significance level between stages 1 and 2 among the five scalp areas and three muscles at beta frequency band. The data (mean ± standard error) were based on results of nine subjects with an additional criterion of having at least two adjacent coherence values higher than the 95% confidence level (see Results for details). BB, biceps brachii; BR, brachioradialis; TB, triceps brachii.
| Left | Right | Frontal | Central | Parietal | |
|---|---|---|---|---|---|
| BB-Stage1 | 2.30±0.63 | 2.44±0.49 | 2.59±0.54 | 3.20±0.69 | 3.54±0.97 |
| BB-Stage2 | 0.56±0.18 | 0.93±0.31 | 1.86±0.40 | 1.31±0.34 | 2.36±0.63 |
| BR-Stage1 | 1.65±0.36 | 1.77±0.36 | 1.49±0.33 | 1.69±0.33 | 2.60±0.64 |
| BR-Stage2 | 1.23±0.29 | 0.98±0.23 | 0.92±0.27 | 0.92±0.23 | 1.24±0.32 |
| TB-Stage1 | 1.81±0.46 | 2.58±0.49 | 1.66±0.29 | 2.65±0.38 | 3.09±0.84 |
| TB-Stage2 | 1.25±0.28 | 0.95±0.23 | 1.06±0.28 | 0.68±0.22 | 2.01±0.58 |
Table IV.
Comparisons of numbers of frequency bins with significant EEG-EMG coherence between stages 1 and 2 in the electrodes with maximum coherence among all the scalp area-muscle combinations at beta frequency band. The data (mean ± standard error) were based on results of nine subjects with an additional criterion of having at least two adjacent coherence values higher than the 95% confidence level (see Results for details). BB, biceps brachii; BR, brachioradialis; TB, triceps brachii.
| Left | Right | Frontal | Central | Parietal | |
|---|---|---|---|---|---|
| BB-Stage1 | 2.11±0.87 | 1.44±0.66 | 0.89±0.41 | 1.78±0.81 | 2.56±1.57 |
| BB-Stage2 | 0.00±0.00 | 0.00±0.00 | 0.22±0.23 | 0.44±0.31 | 1.00±0.83 |
| BR-Stage1 | 1.11±0.51 | 1.22±0.61 | 0.44±0.31 | 2.00±0.53 | 1.78±0.90 |
| BR-Stage2 | 0.78±0.61 | 0.00±0.00 | 0.00±0.00 | 0.11±0.12 | 1.00±0.61 |
| TB-Stage1 | 0.89±0.72 | 1.89±0.54 | 1.33±0.50 | 1.00±0.43 | 1.00±0.71 |
| TB-Stage2 | 0.67±0.50 | 0.22±0.24 | 0.22±0.24 | 0.44±0.47 | 0.56±0.59 |
Table V.
Comparisons of the Z-transformed EEG-EMG coherence amplitude above the significance level between stages 1 and 2 in the electrodes with maximum coherence among all the scalp area-muscle combinations at beta frequency band. The data (mean ± standard error) were based on results of nine subjects with an additional criterion of having at least two adjacent coherence values higher than the 95% confidence level (see Results for details). BB, biceps brachii; BR, brachioradialis; TB, triceps brachii.
| Table V | Left | Right | Frontal | Central | Parietal |
|---|---|---|---|---|---|
| BB-Stage1 | 7.41±3.40 | 4.62±2.14 | 3.01±1.45 | 6.27±2.95 | 8.40±5.35 |
| BB-Stage2 | 0.00±0.00 | 0.00±0.00 | 0.79±0.84 | 1.40±0.98 | 3.68±3.08 |
| BR-Stage1 | 3.66±1.71 | 3.76±1.81 | 1.50±1.05 | 6.16±1.61 | 5.83±3.21 |
| BR-Stage2 | 2.22±1.75 | 0.00±0.00 | 0.00±0.00 | 0.38±0.41 | 3.34±2.04 |
| TB-Stage1 | 3.38±2.68 | 5.73±1.54 | 3.93±1.46 | 3.27±1.44 | 3.21±2.30 |
| TB-Stage2 | 1.77±1.33 | 0.67±0.71 | 0.75±0.80 | 1.37±1.45 | 1.82±1.93 |
Figure 6 shows results of the mean normalized EEG (Fig. 6A) and EMG (Fig. 6B) power at beta frequency band in stages 1 and 2. The EEG power increased in every scalp area. Statistical analysis of the EEG power revealed significant differences (P<0.01) between stages 1 and 2 and significant area effect (P<0.01). The normalized EEG power in the left and right areas was greater than that in the central, frontal and parietal areas. The EMG power was also increased in each muscle. Statistical analysis of the EMG power by the general linear model showed a significant difference between stages 1 and 2 (P<0.01). No significant muscle and muscle-stage interaction on the EMG power was detected.
Fig. 6.

Comparisons of the mean normalized EEG power of the five scalp areas and EMG power of the three muscles at beta band (15-35Hz) between stages 1 and 2. Data were based on results of nine subjects. Each normalized EEG power value in each area in each subject was an average of the values from all the electrodes in that area at beta band normalized to the total EEG power (3-50 Hz) in stage 1 of the same area. Similarly, the EMG power at beta band for each muscle was normalized to the total EMG power (10-125 Hz) in stage 1 of the same muscle. Both the EEG and EMG power increased with muscle fatigue (P < 0.01). Because there were no significant stage-area (EEG) and stage-muscle (EMG) interactions, no post-hoc pair-wise comparisons were performed. BB, biceps brachii; BR, brachioradialis; TB, triceps brachii; L, left area; R, right area; F, frontal area; C, central area; P, parietal area.
Discussion
Muscle fatigue involving voluntary motor activities is associated with acute adaptations in both the central nervous and muscular systems (Liu et al. 2003, 2005a and b, 2007; van Duinen et al. 2007). Whether fatigue influences the strength of functional coupling between signals of the two systems is unknown. This study examined muscle fatigue effect on the level of corticomuscular coupling by computing the EEG-EMG coherence during a sustained voluntary submaximal elbow flexion. The major findings were that the EEG-EMG coherence decreased significantly from a stage of minimal fatigue to a stage of more severe fatigue.
Force, EMG and Fatigue
Fatigue-related changes in muscle force and EMG signals during maximal and submaximal muscle contractions have been studied extensively (Bigland-Ritchie, 1981; Enoka and Stuart, 1992). In a submaximal muscle contraction, in which a target force is sustained for a prolonged time, a major index of fatigue is amplitude of the EMG that increases with the level of fatigue (Liu et al., 2003; van Duinen et al., 2007). As a muscle fatigues, its ability to generate force declines (Gandevia, 2001); under this condition, additional motor units need to be recruited and/or the active motor units are driven to higher activation levels (reflected by augmented EMG) to maintain the same submaximal force. In this study, the EMG level of both the BB and BR, two major elbow flexors, increased significantly during stage 2 compared to stage 1 with maintenance of the target force across the two stages, indicating substantial muscle fatigue in stage 2.
Coherence Decreases in Fatigue Stage
The reduced EEG-EMG coherence during muscle fatigue suggests a fatigue-related weakening of functional coupling between cortical and muscular signals. There is a general agreement that beta band coupling between the cortex and muscle is related to motor behavior (Conway et al., 1995; Feige et al., 2000; Kilner et al., 2000; Kilner et al., 1999; Kristeva et al., 2007). The coherence strength at the beta band has been demonstrated by systematic changes with motor parameters (Kilner et al., 2000). It has been further suggested that submaximal, low-level voluntary contractions are associated with corticomuscular signal coherence at the beta (15∼30 Hz) frequency band (Conway et al., 1995), whereas strong voluntary contractions are associated with coherence at higher frequencies (30∼60 Hz) (Brown et al., 1997). This beta band coherence observation indicates perhaps a diminishing communication between the cortical output centers and muscles that received the cortical signals to carry out the intended motor action with increasing muscle fatigue. A number of mechanisms may contribute to the weakened coupling. One likely candidate is inhibitory drive from various sources that act upon the spinal alpha motor neurons. A number of studies applied transcranial magnetic stimulation over human motor cortex during sustained maximal or submaximal contractions demonstrated reduced excitatory input from the motor cortex to fatiguing muscle (Sogaard et al., 2006; Taylor and Gandevia, 2001). This lessening of descending drive has been interpreted as influences by inhibitory interneurons and/or the firing of fatigue-sensitive muscle afferents that act upon the corticospinal neurons and inhibit voluntary descending drive (Belhaj-Saif et al., 1996; Bigland-Ritchie, 1981; Leonard et al., 1994; Taylor et al., 2006). If the spinal and/or cortical output neurons are inhibited with muscle fatigue, their signals may not be as closely coupled with muscle activities as in the situation when muscle is less fatigued.
Impairments of neuromuscular junction (NMJ) transmission by fatigue may also contribute to the weakening of corticomuscular coupling. NMJ transmission function has been found to be reduced after muscle fatigue induced by sustained maximal (Bellemare and Garzaniti, 1988), submaximal (Fuglevand et al., 1995; Fuglevand et al., 1993), and electrical stimulation-evoked (Tanino et al., 2003) muscle contractions. NMJ transmission impairment is most significant following low-intensity sustained contractions (such as 30% maximal level used in this study) that lead to exhaustion (Fuglevand et al., 1993). If the descending command cannot be efficiently transmitted from the brain to muscle across the NMJ under the condition of muscle fatigue, it is expected that the signal coupling between the brain and muscle would be affected.
Another potential contribution to the weakened corticomuscular signal coupling with fatigue is shifting of the cortical output center during prolonged motor activities. A recent study reported that as unilateral muscle fatigue became more severe, the center of brain activation shifted to locations more toward frontal, inferior, and ipsilateral directions (Liu et al., 2007). This observation was interpreted as “rotations” of cortical centers; as neurons in the original center became fatigued and reduced their activity, those in the other center(s) took over the function and maintained the overall level of brain-to-muscle drive (Liu et al., 2007). The coherence maps in Fig. 4 seem to support the “rotation” hypothesis. For example, the center of the peak coherence with BB muscle was in the central-left area in stage 1 but it shifted to the central-right area in stage 2 (Fig. 4, top row). The beta band EEG power in the right scalp area in Fig. 6A and last row in Fig. 4 showed the largest increase compared to other scalp areas, indicating perhaps augmented activation in the ipsilateral sensorimotor regions. Under normal circumstances, voluntary muscle contractions are controlled by the primary motor cortex contralateral to the performing limb through the direct, monosynaptic corticospinal pathway. However, as the major control center is shifted to other locations with more indirect, polysynaptic pathways to the muscles, it is expected that the signals from the new centers would less tightly coupled with the muscle signals. However, this shifting would still lead to maintained or increased output strength to the muscle, resulting in a paradox of weakening in the corticomuscular coupling in frequency domain and strengthened muscle signal (greater EMG) in time domain.
Finally, fatigue-related motor unit firing behavior may also contribute to the weakened EEG-EMG coherence. It is a common observation that a person's hand/arm shakes (tremor at ∼10 Hz) when he/she is severely fatigued (Ebenbichler et al., 2000). The tremor could be a result of motor unit synchronization under fatigue condition. However, the increase in motor unit firing synchrony tends to have an effect in lower frequency bands (Arihara and Sakamoto, 1999) rather than beta band (15-35 Hz), especially after applying the Discrete Fourier transform with hamming window for the calculation of the power spectrum and coherence. The application of hamming window reduces potential leakage or overflow of effects of a given frequency band to the adjacent frequency bins by suppressing the side lobes.
In order to maintain the target force under fatigue condition, the average EMG amplitude increased to about 40% maximal level in stage 2 compared with the amplitude (∼30%) in stage 1. It is necessary to know whether the increase in EMG amplitude contributed to the coherence reduction. On the contrary, a number of studies have reported EEG-EMG coherence increases at beta band (Kilner et al., 2000, Witte et al. 2007) or no change in the coherence (Mima et al., 1999b) with augmentations of force or EMG amplitude. These earlier findings support our interpretation that the reduced EEG-EMG coherence in our study was caused by fatigue-related weakening of corticomuscular coupling.
The change of EEG-EMG coherence could be influenced by increased EMG signals from muscles in or near the head areas under the fatigue condition. The increased EMG in the head area could easily contribute to the EEG signals and eventually affect the EEG-EMG coherence. Although this possibility could not totally be excluded, the chance of its occurrence was very low for the following reasons. First, before the data analysis, all the signals, especially the EEG signals were visually inspected and segments with visually-detected artifacts (e.g., EMG contaminations caused by eye blinks, jaw clenching, or tensing facial/neck/shoulder muscles) were discarded. Second, additional experiments were performed to further examine whether EEG with influence of EMG has an effect on EEG-EMG coherence. Two subjects performed two 2-min sustained elbow flexion contractions at 30% maximal level with the EEG (128 channels) and EMG of the elbow flexor muscles recorded simultaneously. In one contraction, they concentrated on the motor task without activating muscles in facial, neck, shoulder and other areas; in the other, they performed the task while slightly clenched the jaw so that the EEG signals were contaminated by EMG of the jaw closing muscles in the face. The analysis revealed that the power amplitude of the EMG-contaminated EEG had a sharp increase in the gamma band (36-50Hz) compared with the power signal of the clean EEG. This increase of gamma power was not seen in the stage-2 EEG in the nine subjects in this study. More importantly, the EEG-EMG coherence was not different between the two conditions (EEG contaminated by jaw-clenching EMG and clean EEG) or even increased in the two subjects. These findings suggest that even if our stage-2 EEG data were contaminated by EMG of the near-by muscles after fatigue set in, the contamination did not affect the EEG-EMG coherence at the beta band.
EEG and EMG Power Increases in Fatigue Stage
It is worth noting that reduced corticomuscular coherence does not necessarily accompany a decrease in brain or muscle activation level. Tecchio et al. (2006) suggest that cortical recruitment and corticomuscular coupling are distinct mechanisms. During a sustained submaximal muscle contraction, both muscle (Fuglevand et al., 1993; Yue et al., 1997) and brain (Liu et al., 2003; van Duinen et al., 2007) activation levels increase as fatigue sets in. The increased brain and muscle activities are thought to be a reflection of increasing descending command that result in recruitment of additional motor units and/or increasing activity level of the active motor units to compensate for the force loss contributed by those motor units that were recruited early but became fatigued (Liu et al., 2003; van Duinen et al., 2007). The result of the EEG and EMG power change in this study (Figure 6) was in line with the previous study. The mean EEG power at beta band significantly increased in stage 2 vs. stage 1, especially in the left and right scalp areas. These scalp areas overlie the major sensorimotor regions (i.e., contralatral and ipsilateral sensorimotor cortices) that play an important role in controling voluntary muscle actions. The mean EMG power at beta band also significantly increased for all the muscles. The negative relation between the strength of corticomuscular signal coupling and amplitude of the signals during muscle fatigue suggests that the weakened neuromuscular coupling might be a tradeoff of increasing activation level to compensate for muscle fatigue. Weakened coupling could lead to lowering of quality in motor performance, such as increased force variation or reduced force steadiness observed with greater muscle fatigue (stage 2) in this study. The negative relation also underscores the likelihood of shifting the control centers during voluntary muscle fatigue as centers with less direct pathways to the muscle could enhance the level of muscle activation but lessen their functional coupling.
Summary
This study is the first to report significant weakening of functional corticomuscular coupling during muscle fatigue, which was demonstrated by large reductions in the level of EEG-EMG coherence. The weakening could be contributed by fatigue-related increases in inhibitory drive to the output centers, a decrease in neuromuscular junction transmission function, and/or shifting of primary output centers in the brain. The weakened coupling could be a potential cause of poor motor performance under fatigue condition and a potential mechanism behind serious fatigue symptoms in many clinical populations.
Experimental Procedure
Subjects
Nine right-handed healthy subjects (48.2 ± 14.8 years, 3 men) participated in the study. The study was approved by the Institutional Review Board at the Cleveland Clinic. All subjects gave informed consent prior to their participation. All subjects performed a sustained contraction of the right-arm elbow flexion at 30% maximal level until subjective exhaustion. Elbow flexion force, surface EMG and multi-channel EEG were simultaneously recorded during the sustained contraction.
Data Recording
Sustained Contraction
The isometric sustained contraction was performed to fatigue the elbow flexor muscles. A target force of 30% maximal elbow flexion force was displayed on an oscilloscope using a horizontal cursor. (Maximal force was measured at the beginning of the experiment.) Participants matched the target with the exerted force in a sitting position with the elbow joint at ∼100° and maintained the exerted force on the target until they felt exhausted and were no longer able to continue the contraction. Participants were verbally vigorously encouraged to continue the sustained contraction as long as possible. The sustained contraction was terminated if the exerted force dropped 10% or more for more than 3 s. The forces (maximal and sustained contraction) were measured by a force transducer (JR3 Universal Force-Moment Sensor System, Woodland, CA), acquired by a Spike2 data-acquisition system (1401 Plus, Cambridge Electronic Design, Ltd., Cambridge, UK), digitized at 100 samples/s, and stored on hard disk of a personal computer.
EMG Measurement
Bipolar surface EMG was recorded from the belly of the biceps brachii (BB), brachioradialis (BR) and triceps brachii (TB) muscles using Ag-AgCl electrodes (In Vivo Metric, Healdsburg, CA). Recording diameter of each electrode was 8 mm and center-to-center inter-electrode distance was ∼3 cm. A reference electrode was placed on the skin overlying the lateral epicondyle near the elbow joint. The EMG signals were amplified (X1000); band-pass filtered (3 Hz – 1 KHz), digitized (2000 samples/s), acquired by the Spike2 system, and stored on hard disk of the personal computer. For the EEG-EMG coherence analysis, the EMG signals of the three muscles were re-sampled at 250 points/s, same as the EEG sampling rate (see below).
Multi-Channel EEG Measurement
Scalp EEG signals (referenced to the central electrode [Cz]) were recorded continuously during the sustained contraction using a 128-channel EEG data acquisition system (Electrical Geodesics, Inc. Eugene, OR, USA). The 128 electrodes were arranged in a hat-like net and connected to each other by nylon strings. The electrode net was applied to the head after it was soaked in the electrolyte consisted of one liter of distilled water added with 1.5 teaspoons of potassium chloride and a few drops of baby shampoo (EGI System 200 Technical Manual). A small piece of sponge in each electrode absorbed the liquid and served as connecting media between the scalp and electrode. An impedance map, based on impedance values of all the electrodes, was displayed on a computer monitor to inspect the quality of connection. If a particular electrode showed high impedance, adjustment (such as applying pressure or adding more water) was made to improve the connection. The EEG data recording did not begin until the impedance for all electrodes settles below 10,000 ohms. All channels of the signals were amplified (X75,000), band-pass filtered (0.01 -100 Hz), digitized (250 sample/s) and recorded on hard disk of a dedicated personal computer connected to the EEG acquisition hardware and software.
Data Processing and Analysis
During offline processing, the EEG signals were re-referenced to the average value of the 128-channel signals (excluded the outer-most electrodes) and high-pass filtered at 3 Hz. (In general, a reference based on average potential of all the electrodes provides reasonable and consistent qualitative results on coherence estimates on a large spatial scale (Nunez et al. 1997, Nunez et al. 1999).) The EMG signals were then resampled at 250 Hz and high-pass filtered at 10 Hz to minimize low-frequency baseline fluctuation before rectification. All signals, especially the EEG were inspected visually. Recordings with artifacts caused by events such as electrical stimulation (see below), eye blinks, head movements, and/or muscle activation in and near the head areas were excluded and the corresponding EMG signals discarded. The entire duration (148 ± 24 s) of the EEG and EMG recordings was then divided into the first half (stage 1 with minimal fatigue) and second half (stage 2 with severer fatigue). Subsequently, the signals in each stage were segmented into artifact-free epochs (256 samples in each epoch) without overlapping (mean 148.5 epochs, ranging from 56 to 264 among the nine participants). (Note that the subjects maintained the contraction for 461 ± 45 s in the experiment but the duration of the data used for the coherence analysis was much shorter. This was because supramaximal electrical stimulation-evoked twitch force was measured every 30 seconds during the sustained contraction to monitor the voluntary activation level (VAL) of the biceps brachii. The electrical stimulation protocol was for a separate project that compared the VAL between a group of patients with cancer-related fatigue and healthy controls [subjects of this study]. The high-intensity stimuli produced substantial artifacts onto the EMG and EEG data. The artifact contaminated data, about 3s to 5s after each stimulus, were manually removed. After removing the artifact contaminated data, the total amount of “clean” data analyzed, on average, were only 148 ± 24 s, which was too short to be segmented into more than two stages for high-quality coherence measurements.)
In each stage, autospectrum and crossspectrum of the EEG and rectified EMG were calculated with a 256-point fast Fourier transform with hamming window. (It has been shown that rectification of the EMG alters EMG power spectrum but does not change EEG-EMG coherence; further, the rectification makes the coherence peaks more clear [Yao et al. 2007].) The coherence of the two signals was obtained from normalization of the crossspectrum: where Sxx (f) and Syy (f) respectively represented the cross-trial smoothed autospectrum of the EEG and EMG signals, x and y, for a given frequency f; and Sxy (f) was the cross-trial smoothed cross-spectrum. The frequency resolution was 0.98Hz. Significance of the coherence was determined based on the 95% confidence level (Rosenberg et al. 1989). In addition, stricter criteria of assessing significance of coherence was also implemented by requiring that at least two adjacent coherence values higher than the 95% confidence level due to the potential compounding factor of weak and variable coherence(James et al. 2008).
Due to the volume of information, especially the large number of EEG channels, the coherence values of EEG channels overlying sensorimotor function-related brain regions with each of the three muscles (BB, BR or TB) were grouped into five scalp areas for statistical comparisons (10 electrodes in each scalp area): left, right, frontal, central and parietal (Fig. 7). The calculated coherence was Z-transformed by the arc hyperbolic tangent transformation to stabilize the standard deviation (Rosenberg et al., 1989). The transformation was as follows:
Fig. 7.
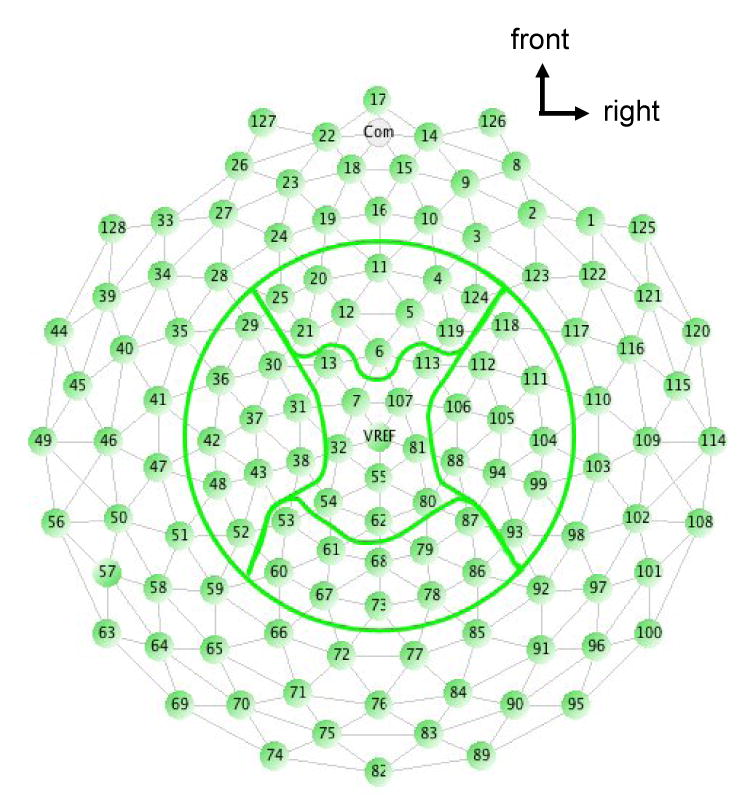
Illustration of the five scalp areas (left, right, frontal, central and parietal) used for the statistical analysis of the EEG-EMG coherence. Each area consisted of 10 electrodes.
Where C is the coherence value and L is the number of epochs. The Z-transformation allowed the coherence values to be greater than 1.
The electrodes with maximum coherence in stage 1 in each scalp area was also focused and compared across the stages. The pooled coherence based on these maximum coherence electrodes was calculated (Amjad et al. 1997):
Where k is the number of EEG-EMG electrode pairs and Li is the number of non-overlapped segments used to calculate coherence in ith EEG-EMG electrode pair. The corresponding upper 95% confidence limit is calculated as (Amjad et al. 1997).
The electrode with the maximum coherence in stage 1 might not be the maximum one in stage 2, so the comparison analysis comprised all the EEG electrodes in each scalp area is necessary. And additional spatial information was also provided in this way. The frequency of where peak coherence located in each electrode of each scalp area was compared. Since most of the peak EEG-EMG coherence values were detected at the beta frequency band in both stages 1 and 2 (see Table I), crossing-stage comparisons of significant coherence in each EEG-EMG electrodes combinations were limited to the beta (15-35Hz) frequency band.
The mean power of the beta band EEG in each scalp area and beta band EMG in each muscle at each stage was also calculated and normalized to the total power of stage 1. The total EEG power was the sum of the power computed from 3 to 50 Hz and the total EMG power frequency range was from 10 to 125 Hz (the EMG resampling rate of 250 points/s allowed 125 Hz as the highest frequency). The rectified EMG was averaged in each stage in each subject to quantify the level of activation in each muscle. A group average was then determined. The force was quantified in a similar manner by computing the mean force in each stage in each subject and then calculating the group mean in each stage. In addition, force variation in each stage was evaluated by determining standard deviation (SD) of the mean relative force.
Statistical Analysis
A repeated-measures general linear model was adopted for coherence comparisons between the stages and among the scalp areas and muscles using SPSS 12.0 (SPSS Inc., Chicago, IL, USA). In addition to analyzing amplitude of the coherence that above the significance level (95% confidence), the number of frequency bins reached the significance level was also quantified and analyzed. Since the frequency resolution was about 1 Hz, each 1-Hz step from 15 to 35 Hz consisted of one bin. The Z-transformed EEG power and normalized EMG power at beta band were also subjected to the analysis of the repeated-measures general linear model. The elbow flexion force, force variation (SD), and EMG of the relevant muscles were compared between stages 1 and 2 using paired t tests.
Acknowledgments
This work was supported in part by an NIH grant (NS37400), Department of Defense grant (DAMD17-01-1-0665), Cleveland Clinic grant (RPC6700), and Risman Research and Development Fund at The Cleveland Clinic.
Footnotes
Publisher's Disclaimer: This is a PDF file of an unedited manuscript that has been accepted for publication. As a service to our customers we are providing this early version of the manuscript. The manuscript will undergo copyediting, typesetting, and review of the resulting proof before it is published in its final citable form. Please note that during the production process errors may be discovered which could affect the content, and all legal disclaimers that apply to the journal pertain.
References
- Amjad AM, Halliday DM, Rosenberg JR, Conway BA. An extended difference of coherence test for comparing and combining several independent coherence estimates: theory and application to the study of motor units and physiological tremor. J Neurosci Methods. 1997;73:69–79. doi: 10.1016/s0165-0270(96)02214-5. [DOI] [PubMed] [Google Scholar]
- Arihara M, Sakamoto K. Contribution of motor unit activity enhanced by acute fatigue to physiological tremor of finger. Electromyogr Clin Neurophysiol. 1999;39:235–47. [PubMed] [Google Scholar]
- Belhaj-Saif A, Fourment A, Maton B. Adaptation of the precentral cortical command to elbow muscle fatigue. Exp Brain Res. 1996;111:405–16. doi: 10.1007/BF00228729. [DOI] [PubMed] [Google Scholar]
- Bellemare F, Garzaniti N. Failure of neuromuscular propagation during human maximal voluntary contraction. J Appl Physiol. 1988;64:1084–93. doi: 10.1152/jappl.1988.64.3.1084. [DOI] [PubMed] [Google Scholar]
- Bigland-Ritchie B. EMG/force relations and fatigue of human voluntary contractions. Exerc Sport Sci Rev. 1981;9:75–117. [PubMed] [Google Scholar]
- Brown P, Corcos DM, Rothwell JC. Does parkinsonian action tremor contribute to muscle weakness in Parkinson's disease? Brain. 1997;120(Pt 3):401–8. doi: 10.1093/brain/120.3.401. [DOI] [PubMed] [Google Scholar]
- Butler JE, Taylor JL, Gandevia SC. Responses of human motoneurons to corticospinal stimulation during maximal voluntary contractions and ischemia. J Neurosci. 2003;23:10224–30. doi: 10.1523/JNEUROSCI.23-32-10224.2003. [DOI] [PMC free article] [PubMed] [Google Scholar]
- Conway BA, Halliday DM, Farmer SF, Shahani U, Maas P, Weir AI, et al. Synchronization between motor cortex and spinal motoneuronal pool during the performance of a maintained motor task in man. J Physiol. 1995;489(Pt 3):917–24. doi: 10.1113/jphysiol.1995.sp021104. [DOI] [PMC free article] [PubMed] [Google Scholar]
- Ebenbichler GR, Kollmitzer J, Erim Z, Loscher WN, Kerschan K, Posch M, et al. Load-dependence of fatigue related changes in tremor around 10 Hz. Clin Neurophysiol. 2000;111:106–11. doi: 10.1016/s1388-2457(99)00206-0. [DOI] [PubMed] [Google Scholar]
- Enoka RM, Stuart DG. Neurobiology of muscle fatigue. J Appl Physiol. 1992;72:1631–48. doi: 10.1152/jappl.1992.72.5.1631. [DOI] [PubMed] [Google Scholar]
- Feige B, Aertsen A, Kristeva-Feige R. Dynamic synchronization between multiple cortical motor areas and muscle activity in phasic voluntary movements. J Neurophysiol. 2000;84:2622–9. doi: 10.1152/jn.2000.84.5.2622. [DOI] [PubMed] [Google Scholar]
- Fuglevand AJ, Bilodeau M, Enoka RM. Short-term immobilization has a minimal effect on the strength and fatigability of a human hand muscle. J Appl Physiol. 1995;78:847–55. doi: 10.1152/jappl.1995.78.3.847. [DOI] [PubMed] [Google Scholar]
- Fuglevand AJ, Zackowski KM, Huey KA, Enoka RM. Impairment of neuromuscular propagation during human fatiguing contractions at submaximal forces. J Physiol. 1993;460:549–72. doi: 10.1113/jphysiol.1993.sp019486. [DOI] [PMC free article] [PubMed] [Google Scholar]
- Gandevia SC. Spinal and supraspinal factors in human muscle fatigue. Physiol Rev. 2001;81:1725–89. doi: 10.1152/physrev.2001.81.4.1725. [DOI] [PubMed] [Google Scholar]
- Gandevia SC, Allen GM, Butler JE, Taylor JL. Supraspinal factors in human muscle fatigue: evidence for suboptimal output from the motor cortex. J Physiol. 1996;490(Pt 2):529–36. doi: 10.1113/jphysiol.1996.sp021164. [DOI] [PMC free article] [PubMed] [Google Scholar]
- Garland SJ. Role of small diameter afferents in reflex inhibition during human muscle fatigue. J Physiol. 1991;435:547–58. doi: 10.1113/jphysiol.1991.sp018524. [DOI] [PMC free article] [PubMed] [Google Scholar]
- Garland SJ, Kaufman MP. Role of muscle afferents in the inhibition of motoneurons during fatigue. Adv Exp Med Biol. 1995;384:271–8. doi: 10.1007/978-1-4899-1016-5_21. [DOI] [PubMed] [Google Scholar]
- Hellwig B, Haussler S, Lauk M, Guschlbauer B, Koster B, Kristeva-Feige R, et al. Tremor-correlated cortical activity detected by electroencephalography. Clin Neurophysiol. 2000;111:806–9. doi: 10.1016/s1388-2457(00)00248-0. [DOI] [PubMed] [Google Scholar]
- James LM, Halliday DM, Stephens JA, Farmer SF. On the development of human corticospinal oscillations: age-related changes in EEG-EMG coherence and cumulant. Eur J Neurosci. 2008;27:3369–79. doi: 10.1111/j.1460-9568.2008.06277.x. [DOI] [PubMed] [Google Scholar]
- Kilner JM, Baker SN, Salenius S, Hari R, Lemon RN. Human cortical muscle coherence is directly related to specific motor parameters. J Neurosci. 2000;20:8838–45. doi: 10.1523/JNEUROSCI.20-23-08838.2000. [DOI] [PMC free article] [PubMed] [Google Scholar]
- Kilner JM, Baker SN, Salenius S, Jousmaki V, Hari R, Lemon RN. Task-dependent modulation of 15-30 Hz coherence between rectified EMGs from human hand and forearm muscles. J Physiol. 1999;516(Pt 2):559–70. doi: 10.1111/j.1469-7793.1999.0559v.x. [DOI] [PMC free article] [PubMed] [Google Scholar]
- Kristeva R, Patino L, Omlor W. Beta-range cortical motor spectral power and corticomuscular coherence as a mechanism for effective corticospinal interaction during steady-state motor output. Neuroimage. 2007 doi: 10.1016/j.neuroimage.2007.03.025. [DOI] [PubMed] [Google Scholar]
- Leonard CT, Kane J, Perdaems J, Frank C, Graetzer DG, Moritani T. Neural modulation of muscle contractile properties during fatigue: afferent feedback dependence. Electroencephalogr Clin Neurophysiol. 1994;93:209–17. doi: 10.1016/0168-5597(94)90042-6. [DOI] [PubMed] [Google Scholar]
- Liu JZ, Lewandowski B, Karakasis C, Yao B, Siemionow V, Sahgal V, et al. Shifting of activation center in the brain during muscle fatigue: an explanation of minimal central fatigue? Neuroimage. 2007;35:299–307. doi: 10.1016/j.neuroimage.2006.09.050. [DOI] [PMC free article] [PubMed] [Google Scholar]
- Liu JZ, Shan ZY, Zhang LD, Sahgal V, Brown RW, Yue GH. Human brain activation during sustained and intermittent submaximal fatigue muscle contractions: an FMRI study. J Neurophysiol. 2003;90:300–12. doi: 10.1152/jn.00821.2002. [DOI] [PubMed] [Google Scholar]
- Liu JZ, Yao B, Siemionow V, Sahgal V, Wang X, Sun J, et al. Fatigue induces greater brain signal reduction during sustained than preparation phase of maximal voluntary contraction. Brain Res. 2005a;1057:113–26. doi: 10.1016/j.brainres.2005.07.064. [DOI] [PubMed] [Google Scholar]
- Liu JZ, Zhang L, Yao B, Sahgal V, Yue GH. Fatigue induced by intermittent maximal voluntary contractions is associated with significant losses in muscle output but limited reductions in functional MRI-measured brain activation level. Brain Res. 2005b;1040:44–54. doi: 10.1016/j.brainres.2005.01.059. [DOI] [PubMed] [Google Scholar]
- Marsden JF, Werhahn KJ, Ashby P, Rothwell J, Noachtar S, Brown P. Organization of cortical activities related to movement in humans. J Neurosci. 2000;20:2307–14. doi: 10.1523/JNEUROSCI.20-06-02307.2000. [DOI] [PMC free article] [PubMed] [Google Scholar]
- Mima T, Hallett M. Corticomuscular coherence: a review. J Clin Neurophysiol. 1999a;16:501–511. doi: 10.1097/00004691-199911000-00002. [DOI] [PubMed] [Google Scholar]
- Mima T, Simpkins N, Oluwatimilehin T, Hallett M. Force level modulates human cortical oscillatory activities. Neurosci Letter. 1999b;275:77–80. doi: 10.1016/s0304-3940(99)00734-x. [DOI] [PubMed] [Google Scholar]
- Mima T, Steger J, Schulman AE, Gerloff C. Hallett M. Electroencephalographic measurement of motor cortex control of muscle activity in humans. Clin Neurophysiol. 2000;111:326–337. doi: 10.1016/s1388-2457(99)00229-1. [DOI] [PubMed] [Google Scholar]
- Mima T, Toma K, Koshy B, Hallett M. Coherence between cortical and muscular activities after subcortical stroke. Stroke. 2001;32:2597–601. doi: 10.1161/hs1101.098764. [DOI] [PubMed] [Google Scholar]
- Nunez PL, Silberstein RB, Shi Z, Carpenter MR, Srinivasan R, Tucker DM, et al. 1999 EEG coherency II: experimental comparisons of multiple measures. Clin Neurophysiol. 1999;110:469–86. doi: 10.1016/s1388-2457(98)00043-1. [DOI] [PubMed] [Google Scholar]
- Nunez PL, Srinivasan R, Westdorp AF, Wijesinghe RS, Tucker DM, Silberstein RB. EEG coherency. I: Statistics, reference electrode, volume conduction, Laplacians, cortical imaging, and interpretation at multiple scales. Electroencephalogr Clin Neurophysiol. 1997;103:499–515. doi: 10.1016/s0013-4694(97)00066-7. [DOI] [PubMed] [Google Scholar]
- Rosenberg JR, Amjad AM, Breeze P, Brillinger DR, Halliday DM. The Fourier approach to the identification of functional coupling between neuronal spike trains. Prog Biophys Mol Biol. 1989;53:1–31. doi: 10.1016/0079-6107(89)90004-7. [DOI] [PubMed] [Google Scholar]
- Salenius S, Avikainen S, Kaakkola S, Hari R, Brown P. Defective cortical drive to muscle in Parkinson's disease and its improvement with levodopa. Brain. 2002;125:491–500. doi: 10.1093/brain/awf042. [DOI] [PubMed] [Google Scholar]
- Sogaard K, Gandevia SC, Todd G, Petersen NT, Taylor JL. The effect of sustained low-intensity contractions on supraspinal fatigue in human elbow flexor muscles. J Physiol. 2006;573:511–23. doi: 10.1113/jphysiol.2005.103598. [DOI] [PMC free article] [PubMed] [Google Scholar]
- Tanino Y, Daikuya S, Nishimori T, Takasaki K, Suzuki T. M wave and H-reflex of soleus muscle before and after electrical muscle stimulation in healthy subjects. Electromyogr Clin Neurophysiol. 2003;43:381–4. [PubMed] [Google Scholar]
- Taylor JL, Gandevia SC. Transcranial magnetic stimulation and human muscle fatigue. Muscle Nerve. 2001;24:18–29. doi: 10.1002/1097-4598(200101)24:1<18::aid-mus2>3.0.co;2-d. [DOI] [PubMed] [Google Scholar]
- Taylor JL, Todd G, Gandevia SC. Evidence for a supraspinal contribution to human muscle fatigue. Clin Exp Pharmacol Physiol. 2006;33:400–5. doi: 10.1111/j.1440-1681.2006.04363.x. [DOI] [PubMed] [Google Scholar]
- van Duinen H, Renken R, Maurits N, Zijdewind I. Effects of motor fatigue on human brain activity, an fMRI study. Neuroimage. 2007;35:1438–49. doi: 10.1016/j.neuroimage.2007.02.008. [DOI] [PubMed] [Google Scholar]
- Volkmann J, Joliot M, Mogilner A, Ioannides AA, Lado F, Fazzini E, et al. Central motor loop oscillations in parkinsonian resting tremor revealed by magnetoencephalography. Neurology. 1996;46:1359–70. doi: 10.1212/wnl.46.5.1359. [DOI] [PubMed] [Google Scholar]
- Witte M, Patino L, Andrykiewicz A, Hepp-Reymond MC, Kristeva R. Modulation of human corticomuscular beta-range coherence with low-level static forces. Eur J Neurosci. 2007;26:3564–3570. doi: 10.1111/j.1460-9568.2007.05942.x. [DOI] [PubMed] [Google Scholar]
- Yue GH, Bilodeau M, Hardy PA, Enoka RM. Task-dependent effect of limb immobilization on the fatigability of the elbow flexor muscles in humans. Exp Physiol. 1997;82:567–92. doi: 10.1113/expphysiol.1997.sp004048. [DOI] [PubMed] [Google Scholar]