Abstract
PDZ domains constitute one of the largest families of interaction domains and function by binding the C termini of their target proteins1,2. Using Bayesian estimation, we constructed a three-dimensional extension of a position-specific scoring matrix that predicts to which peptides a PDZ domain will bind, given the primary sequences of the PDZ domain and the peptides. The model, which was trained using interaction data from 82 PDZ domains and 93 peptides encoded in the mouse genome3, successfully predicts interactions involving other mouse PDZ domains, as well as PDZ domains from Drosophila melanogaster and, to a lesser extent, PDZ domains from Caenorhabditis elegans. The model also predicts the differential effects of point mutations in peptide ligands on their PDZ domain–binding affinities. Overall, we show that our approach captures, in a single model, the binding selectivity of the PDZ domain family.
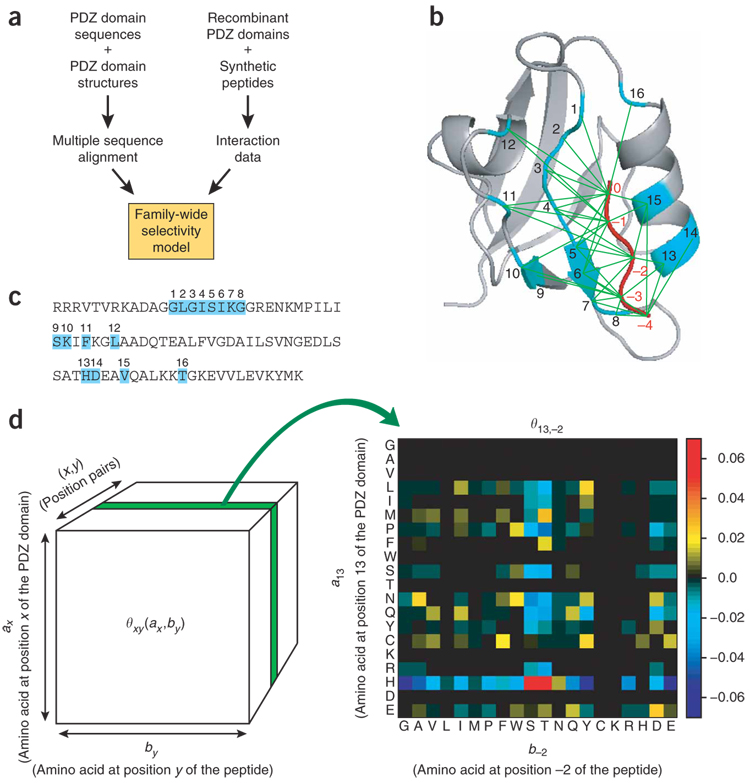
Most efforts to define the binding selectivity of an interaction domain report either a consensus sequence for the domain’s peptide ligands4–6 or a position-specific scoring matrix that captures the domain’s binding preferences7–9. Although these approaches are clearly useful, they are based on experimental data that are specific to the domain being studied and so are silent with respect to other members of the domain family. A truly general model—one that could be used to predict interactions involving PDZ domains for which no data are available—would take into account the sequence not only of the peptide, but also of the PDZ domain. We reasoned that, if the amino acid identity at specific positions in the PDZ domain’s three-dimensional structure determines that domain’s preferences for amino acids at specific positions in the peptide ligand, it might be possible to capture this information for the entire PDZ domain family in a single model by integrating sequence information, structural information and protein interaction data (Fig. 1a).
Figure 1. Constructing a statistical model for PDZ domain-peptide interactions.
(a) Strategy for constructing a family-wide selectivity model for PDZ domains. Primary sequences, structural information and interaction data were all integrated to train the model. (b) Structure of a representative PDZ domain (from a1-syntrophin), complexed with a peptide ligand12. Thirty-eight position pairs (green lines) between the PDZ domain and the peptide ligand were included in the model. Residue positions in the PDZ domain binding pocket (cyan) are numbered from 1 to 16, and residue positions in the peptide ligand (red) are numbered from −4 to 0 (C terminus). A space-filling model that enables better visualization of the proximity between residues in the PDZ domain and residues in the peptide ligand is provided in Supplementary Figure 1. (c) An example of a PDZ domain’s primary sequence (a1-syntrophin), with the binding-pocket residues highlighted (cyan). (d) Parameter values for one slice of the model (20 × 20 scoring matrix), corresponding to position pair (13, −2). Single-letter abbreviations for the amino acids are as follows: A, Ala; C, Cys; D, Asp; E, Glu; F, Phe; G, Gly; H, His; I, Ile; K, Lys; L, Leu; M, Met; N, Asn; P, Pro; Q, Gln; R, Arg; S, Ser; T, Thr; V, Val; W, Trp; and Y, Tyr. Numerical values of the complete model are provided in Supplementary Table 3.
We began by constructing a multiple sequence alignment10,11 of mouse PDZ domains from their primary sequences and from available structures deposited in the Research Collaboratory for Structural Bioinformatics Protein Data Bank (PDB) (http://www.rcsb.org/pdb) (Supplementary Table 1 online). We constrained the model to focus only on position pairs that are in close proximity (<.0 Å), using the structure of a1-syntrophin PDZ (a1synPDZ) complexed with the heptapeptide GVKESLV as a reference structure12. We excluded any residue position in the PDZ domain that was not perfectly aligned (that is, there is a gap in the alignment at that position). A total of 38 position pairs were identified (Fig. 1b and Supplementary Fig. 1 online), involving 16 PDZ domain binding-pocket residues, numbered 1 through 16 (Fig. 1c), and 5 peptide ligand residues, numbered –4 through 0 (C terminus).
Next, we formulated an additive model comprising 38 scoring matrices, one for each position pair. Each 20 × 20 matrix comprises scores for pairs of amino acid residues: one residue on the PDZ domain and the other on the peptide. A PDZ domain is predicted to bind a peptide with KD < 100 µM if
| (1) |
where ψ is a binding score, ax is the amino acid at position x of the domain, by is the amino acid at position y of the peptide ligand, θxyis the scoring matrix for position pair (x, y), Ω is the set of position pairs included in the model and τ is a scoring threshold. We did not consider higher-order interactions between residues (that is, how the interaction between two residues is affected by a third). Calculating higher-order interactions requires a much larger data set owing to an exponential expansion in model complexity. The choice of 100 µM as the threshold for an interaction was based on our earlier observation that the affinities of PDZ domain–peptide interactions have a unimodal distribution that is bounded by ~100 µM (Supplementary Fig. 2a online)3. Very few interactions are that weak, however: ~90% of interactions have a KD < 50 µM and ~60% have a KD < 20 µM.
To fit the model, we relied on a quantitative interaction data set that we recently reported involving PDZ domains and peptides derived from mouse3. The data were obtained by screening protein micro-arrays comprising 157 mouse PDZ domains with 217 fluorescently labeled peptides, and then retesting and quantifying every array positive, as well as many array negatives, using fluorescence polarization. In total, 85 PDZ domains bound one or more peptides. Three domains were removed from the data set because their binding pockets did not align well with those of the other domains. This left 560 interactions and 1,167 noninteractions confirmed by fluorescence polarization, involving 82 mouse PDZ domains and 93 peptides, to train the model (Supplementary Table 2 online). Because the number of model parameters (15,200) greatly exceeds the number of data points (1,727), the model is highly underdetermined. We chose to circumvent this problem by adopting a Bayesian approach13. We assumed the prior distribution for parameter values in equation (1) to be Gaussian with zero means and then fit the model parameters interdependently using a backfitting algorithm. This approach identified the posterior mode of parameter values and is referred to as ‘maximum a posteriori’14.
The model was fit in two ways: using affinities and using binary data. We found empirically that the model trained with binary data performed better when predicting novel interactions, whereas the model trained with affinities performed better when predicting the effect of amino acid substitutions on the free energy of binding. The parameters for both models are provided in Supplementary Table 3 online.
There is substantial goodness-of-fit between the models and the training-set data (Supplementary Fig. 3 online). Additionally, when we examine a slice of the model highlighting the parameters for x = 13 (position αB1 on the PDZ domain) and y = −2 (position −2 on the peptide), the model captures a well-established selectivity rule2. If position αB1 is histidine, PDZ domains prefer serine or threonine at position −2 of the peptide, whereas if αB1 is tyrosine, PDZ domains prefer aspartate at position −2 (Fig. 1d).
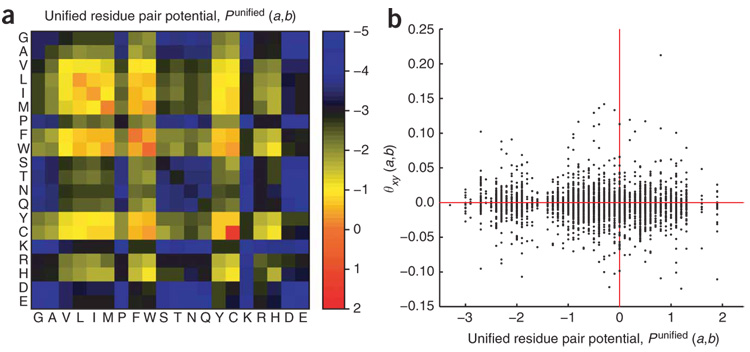
The values for θ vary substantially from one position pair to the next, indicating that there are no general rules for residue-residue interactions. Previously, a set of ‘unified statistical potentials’ was calculated for residue–residue interactions, Punified(a, b), by examining the frequencies of pairs of contact residues in the interfaces of protein homo- and heterodimers in the PDB (Fig. 2a)15. We did not find any correlation between Punified(a, b) and θ at any position pair (Fig. 2b), suggesting that the interface of a PDZ domain–peptide complex is very different in character from that of a static protein complex. For example, whereas interactions between hydrophobic residues dominate flat protein-protein interfaces (Fig. 2a), this trend is not uniformly observed in the PDZ domain–peptide position pairs.
Figure 2. Comparing unified residue pair potentials with our model parameters.
(a) Unified residue pair potentials, Punified(a,b), for protein-protein interactions. These statistical potentials were previously reported based on 340 dimer structures in the PDB15. (b) Lack of correlation between Punified(a,b) and the parameter values of our model, θxy (ax,by).
To assess the predictive power of our model, we used four validation methods: (i) cross-validation tests, (ii) identification of peptide ligands for previously uncharacterized mouse PDZ domains, (iii) prediction of the effect of amino acid substitutions on binding affinity and (iv) extrapolation to PDZ domains derived from other species.
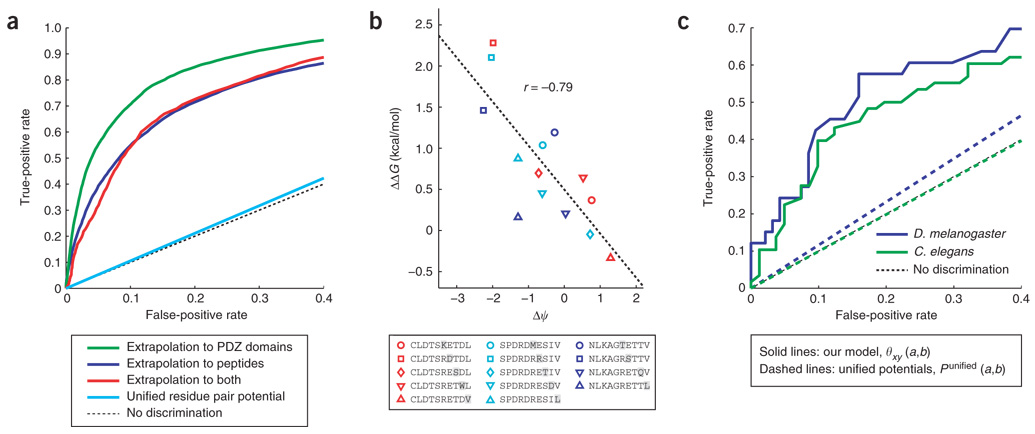
First, we performed a series of cross-validation tests, evaluating the ability of the model to extrapolate to other PDZ domains (randomly assigning 12% of the domains as the test set), other peptides (using 8% of the peptides as the test set) or both. Receiver operating characteristic (ROC), a common, unbiased measure of prediction accuracy16, was used to summarize the results of our tests. In all three cases, the ROC curves indicated significant predictive power (P < 0.025; bootstrap test) (Fig. 3a). Areas under the curves were 0.84 (95% C.I.: 0.76~0.89), 0.91 (0.84~0.96) and 0.87 (0.67~0.98) for extrapolations to novel mouse peptides, novel mouse PDZ domains or both. As a point of reference, if we use the unified statistical potentials15 (by setting θxy (ax, by) to Punified(a, b) for every position pair), our model is unable to predict PDZ domain–peptide interactions (Fig. 3a). This indicates that there is a set of molecular recognition rules for PDZ domains based on residue-residue interactions, but that these rules are context-dependent. It remains to be seen if the same is true of other domain families as well.
Figure 3. Validation of the model.
(a) ROC curves for extrapolating the model to test-set peptides, test-set PDZ domains or both. In contrast, the ROC curve of the model obtained using unified residue pair potentials15 is virtually indistinguishable from the no-discrimination line. (b) The model predicts the effects on binding affinity of introducing amino acid substitutions (highlighted in gray) into three peptide ligands of a1synPDZ. ΔΔGs are the means of three experimental replicates. (c) ROC curves for extrapolating the model to PDZ domains derived from D. melanogaster and C. elegans.
We next asked if the model could be used to facilitate the identification of interactions that had previously eluded experimental discovery. In our previous protein microarray screen, 72 mouse PDZ domains did not show any interactions with the 217 tested peptides3. This represents 15,624 possible interactions that were all negative according to the microarrays. This number of interactions is difficult to study experimentally but is well suited to large-scale prediction, coupled with small-scale experimentation. We used our model to query these 72 ‘orphan’ PDZ domains and predicted 126 interactions involving 21 domains (Supplementary Fig. 4a and Supplementary Table 4 online) and 42 peptides (Supplementary Table 5 online). When we tested these predicted interactions by fluorescence polarization, we found that 52 of them were, in fact, positive (Supplementary Table 6 online). These newly discovered interactions had a KD distribution that was very similar to the distribution in our training set (Supplementary Fig. 2b). Indeed, 81% of the newly identified interactions had a KD < 50 µM and 42% had a KD < 20 µM. None of the ‘de-orphaned’ PDZ domains shares > 33% sequence identity with any of the training-set domains. Thus, even in light of experimental evidence to the contrary, the model successfully highlighted interactions involving domains it had never seen before.
As a third test, we asked if the model could predict changes in binding affinity upon introducing point mutations into three peptide ligands of a1synPDZ, derived from the voltage-gated potassium channel Kv1.5 (CLDTSRETDL), the voltage-gated sodium channel Nav1.5 (SPDRDRESIV) and kinesin family member 1B (KIF1B) (NLKAGRETTV). These ligands were chosen because they represent three of the highest-affinity peptides in our data set. Five peptide variants were synthesized for each ligand, each variant bearing a single amino acid substitution at a different position. The affinities of a1synPDZ for these mutant peptides were measured by fluorescence polarization and compared with the affinities of the wild-type peptides (Supplementary Table 7 online). One variant peptide (NLKA-GREYTV), which was associated with a large negative Δψ(−1.36), showed no measurable binding. For the other 14 peptides, we observed a statistically significant negative correlation (r = −0.79; 95% C.I.: −0.97 ~ −0.45 based on bootstrapping) between ΔΔG and Δψ (Fig. 3b). Although this observation is based on a relatively small number of mutant peptides, it nevertheless suggests that the model captures some aspects of binding affinity.
As the fourth and most stringent test, we asked if our model could provide predictions for PDZ domains derived from other organisms. To do this, we constructed a structurally informed multiple sequence alignment of PDZ domains from Mus musculus, D. melanogaster and C. elegans. We then extracted all the C-terminal sequences from the proteomes of D. melanogaster and C. elegans (data sets ‘BDGP4.3’ and ‘WS180’ in the ‘Ensembl 48’ database; http://www.ensembl.org/) and used the model to predict PDZ domain–peptide interactions in these two species. To test our predictions, we cloned, expressed and purified seven PDZ domains from D. melanogaster (Supplementary Fig. 4b and Supplementary Table 8 online) and seven PDZ domains from C. elegans (Supplementary Fig. 4c and Supplementary Table 9 online). We also synthesized 20 peptides derived from D. melanogaster proteins (Supplementary Table 10 online) and 22 from C. elegans (Supplementary Table 11 online). We then tested all intraspecies interactions by fluorescence polarization (Supplementary Tables 12 and 13 online). Although these fly and worm domains share, on average, < 50% sequence identity with their closest mouse homolog in our training set, the model was able to predict which peptides they would recognize, albeit with reduced accuracy relative to mouse PDZ domains (Fig. 3c). The area under the ROC curve was 0.77 for D. melanogaster domains and 0.68 for C. elegans domains. Thus, it appears that the model is general for the PDZ domain fold, but its performance decreases for domains derived from more distantly related species.
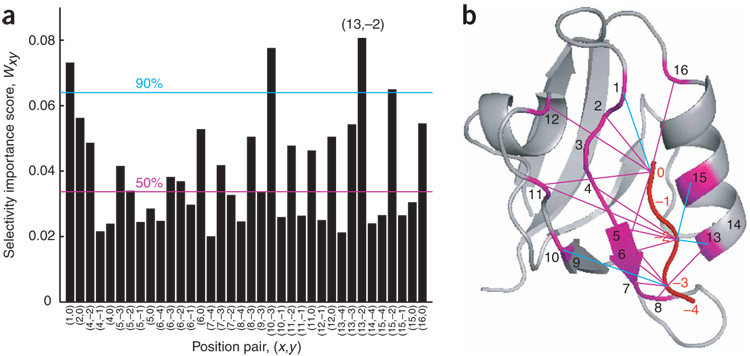
These validation experiments show that our model, which incorporates 38 position pairs chosen solely on the basis of proximity and alignment, contains predictive information. Are all position pairs equally important, or are some more important than others? We reasoned that, if a position pair plays an important role in predicting peptide-binding selectivity, we should observe a large spread of its model parameter values. Conversely, if a position pair does not contribute substantially, the spread should be small. We therefore defined the selectivity importance score, Wxy, of position pair (x, y) as the s.d. of θxy (ax, by) values, taking into account the frequency of each pair of amino acid residues in the training-set data. Because position 3 of the PDZ domain is highly conserved, we excluded this position from our calculations. Interestingly, we found that the top-scoring position pair was (13,−2), which corresponds to the well-noted interaction between position αB1 on the PDZ domain and position −2 on the peptide (Fig. 4a)2. The broader view that emerges from our unbiased study, however, is that several positions on the PDZ domain combine to recognize a single position on the peptide, and a single position on the PDZ domain contributes to the recognition of more than one position on the peptide. Moreover, when we mapped the most predictive position pairs onto the PDZ domain structure (Fig. 4b), we found that they were distributed throughout the binding pocket.
Figure 4. Position pairs that predict the peptide-binding selectivity of PDZ domains.
(a) Selectivity importance scores, Wxy, for the position pairs used in the model. Position pairs (3,0) and (3,−1) were excluded due to high conservation at position 3. The magenta line indicates the median score of the pairs and the cyan line indicates the 90th-percentile score. (b) Position pairs with high selectivity importance scores, mapped onto the structure of a1synPDZ12. Magenta lines: Wxy > median score; cyan lines: Wxy > 90th-percentile score.
In summary, we developed a statistical model that predicts PDZ domain–peptide interactions with reasonable accuracy based on primary sequences. The model can be used to scan whole genomes for interactions with a PDZ domain of interest. Predicted interactions can then be tested experimentally and the inevitable false-positives discarded. We have previously shown that > 80% of biologically relevant, PDZ domain–mediated interactions can be detected by studying PDZ domain–peptide interactions in vitro17. It remains to be determined what fraction of newly discovered in vitro interactions will prove to be biologically relevant. A tutorial providing step-by-step instructions on how to implement the model is provided in the Supplementary Tutorial online and it is our hope that this model will prove useful to the biological community.
METHODS
Cloning, expression and purification of PDZ domains
PDZ domains were cloned by topoisomerase I–mediated directional cloning (Invitrogen) as previously described17. D. melanogaster PDZ domains were subcloned from cDNAs acquired from the Drosophila Genomics Resource Center or cloned directly from cDNA (Stratagene). C. elegans PDZ domains were cloned from cDNA (Invitrogen). Recombinant domains were purified from Escherichia coli as previously described17. Proteins were produced with N-terminal thioredoxin and His6 tags and purified in a single step by immobilized metal affinity chromatography. All proteins used in this study were found to be predominantly monomeric as judged by analytical gel filtration.
Peptide synthesis
Peptides were synthesized on the solid phase using standard Fmoc chemistry as previously described17. All peptides were labeled on their amino terminus with 5(6)-carboxytetramethylrhodamine, purified by reversed-phase high performance liquid chromatography and verified by matrix-assisted laser desorption/ionization time-of-flight mass spectrometry.
Fluorescence polarization
Fluorescent peptides were incubated with PDZ domains for 1 h at 25 °C in assay buffer (20 mM NaH2PO4/Na2HPO4, 100mM KCl, pH 7.4 supplemented with 0.02% bovine serum albumin (wt/vol), 0.04% NaN3, and 1 mM DTT). Peptides were kept at a fixed concentration (20 nM) and the concentration of the PDZ domains was varied from 20 µM down to 10 nM (twofold serial dilution). Fluorescence polarization was measured in 384-well microtiter plates using an Analyst AD fluorescence plate reader (Molecular Devices), with excitation at 525 nm and emission at 590 nm. Equilibrium dissociation constants (KDs) were calculated from these data as previously described17.
Development of the computational model
To fit equation (1), we first compiled a list of fluorescence polarization–confirmed interactions and non-interactions. Because PDZ domains only bind hydrophobic C termini, only peptides that end in hydrophobic amino acids were included in the list. Let M be the number of unique PDZ domains and let M′ be the number of unique peptides. The list comprised the following: (P1,Q1,ω1), (P2,Q2,ω2), …, (PN,QN,ω N), where Pi is the PDZ domain sequence, Qi is the peptide sequence, and ωi indicates whether or not the PDZ domain binds to the peptide. For the binary model, we set ωi = 1 for interactions with KD < 100 µM and ωi = −1 for noninteractions. For the model based on binding affinities, we set ωi to for interactions and to −1 for noninteractions, where max(KD) is the largest dissociation constant measured in our training-set data, and Z is the 5th-percentile value of −log(KDi/max(KD)).
Equation (1) was fit to the binding data using the following back-fitting algorithm:
Calculate .
Initialize the model by setting θxy(a, b) ← 0, ∀x, y, a, b.
For every pair (x, y) ∈ Ω perform the following value updates: For every pair (a, b), calculate the set Ξxyab = {i : Pi(x) = a Λ Qi(y) = b}. Set γi ← γi + θxy(a, b). Then, set . Finally, set γi ← γi − θxy(a, b), ∀i ∈ Ξxyab. (λ > 0 penalizes large θ values that are only supported by few data. The larger the value of λ, the more severe the penalty. We used λ = MM′/100.)
Repeat step (3) until the θ values converge.
A tutorial providing step-by-step instructions on how to implement the model is provided in the Supplementary Tutorial.
Calculation of selectivity importance scores
The selectivity importance score of position pair (x, y) was calculated as
More detailed protocols are provided in Supplementary Methods.
Supplementary Material
Note: Supplementary information is available on the Nature Biotechnology website.
ACKNOWLEDGMENTS
We thank Anna M. Lone for experimental contributions and Eugene I. Shakhnovich for helpful discussions. This work was supported by awards from the Arnold and Mabel Beckman Foundation, the W.M. Keck Foundation and the Camille and Henry Dreyfus Foundation, and by a grant from the US National Institutes of Health (1 RO1 GM072872-01).
Footnotes
Reprints and permissions information is available online at http://npg.nature.com/reprintsandpermissions/
References
- 1.Pawson T, Nash P. Assembly of cell regulatory systems through protein interaction domains. Science. 2003;300:445–452. doi: 10.1126/science.1083653. [DOI] [PubMed] [Google Scholar]
- 2.Sheng M, Sala C. PDZ domains and the organization of supramolecular complexes. Annu. Rev. Neurosci. 2001;24:1–29. doi: 10.1146/annurev.neuro.24.1.1. [DOI] [PubMed] [Google Scholar]
- 3.Stiffler MA, et al. PDZ domain binding selectivity is optimized across the mouse proteome. Science. 2007;317:364–369. doi: 10.1126/science.1144592. [DOI] [PMC free article] [PubMed] [Google Scholar]
- 4.Songyang Z, et al. SH2 domains recognize specific phosphopeptide sequences. Cell. 1993;72:767–778. doi: 10.1016/0092-8674(93)90404-e. [DOI] [PubMed] [Google Scholar]
- 5.Songyang Z, et al. Recognition of unique carboxyl-terminal motifs by distinct PDZ domains. Science. 1997;275:73–77. doi: 10.1126/science.275.5296.73. [DOI] [PubMed] [Google Scholar]
- 6.Fuh G, et al. Analysis of PDZ domain-ligand interactions using carboxyl-terminal phage display. J. Biol. Chem. 2000;275:21486–21491. doi: 10.1074/jbc.275.28.21486. [DOI] [PubMed] [Google Scholar]
- 7.Betel D, et al. Structure-templated predictions of novel protein interactions from sequence information. PLOS Comput. Biol. 2007;3:1783–1789. doi: 10.1371/journal.pcbi.0030182. [DOI] [PMC free article] [PubMed] [Google Scholar]
- 8.Obenauer JC, Cantley LC, Yaffe MB. Scansite 2.0: Proteome-wide prediction of cell signaling interactions using short sequence motifs. Nucleic Acids Res. 2003;31:3635–3641. doi: 10.1093/nar/gkg584. [DOI] [PMC free article] [PubMed] [Google Scholar]
- 9.Yaffe MB, et al. A motif-based profile scanning approach for genome-wide prediction of signaling pathways. Nat. Biotechnol. 2001;19:348–353. doi: 10.1038/86737. [DOI] [PubMed] [Google Scholar]
- 10.O’Sullivan O, Suhre K, Abergel C, Higgins DG, Notredame C. 3DCoffee: combining protein sequences and structures within multiple sequence alignments. J. Mol. Biol. 2004;340:385–395. doi: 10.1016/j.jmb.2004.04.058. [DOI] [PubMed] [Google Scholar]
- 11.Shi J, Blundell TL, Mizuguchi K. FUGUE: sequence-structure homology recognition using environment-specific substitution tables and structure-dependent gap penalties. J. Mol. Biol. 2001;310:243–257. doi: 10.1006/jmbi.2001.4762. [DOI] [PubMed] [Google Scholar]
- 12.Schultz J, et al. Specific interactions between the syntrophin PDZ domain and voltage-gated sodium channels. Nat. Struct. Biol. 1998;5:19–24. doi: 10.1038/nsb0198-19. [DOI] [PubMed] [Google Scholar]
- 13.Hastie T, Tibshirani R, Friedman J. The Elements of Statistical Learning: Data Mining, Inference, and Prediction. New York: Springer; 2001. [Google Scholar]
- 14.Russell SJ, Norvig P. Artificial Intelligence: A Modern Approach. edn. 2. Upper Saddle River, New Jersey: Prentice Hall; 2003. [Google Scholar]
- 15.Lu H, Lu L, Skolnick J. Development of unified statistical potentials describing protein-protein interactions. Biophys. J. 2003;84:1895–1901. doi: 10.1016/S0006-3495(03)74997-2. [DOI] [PMC free article] [PubMed] [Google Scholar]
- 16.Swets JA, et al. Assessment of diagnostic technologies. Science. 1979;205:753–759. doi: 10.1126/science.462188. [DOI] [PubMed] [Google Scholar]
- 17.Stiffler MA, Grantcharova VP, Sevecka M, MacBeath G. Uncovering quantitative protein interaction networks for mouse PDZ domains using protein microarrays. J. Am. Chem. Soc. 2006;128:5913–5922. doi: 10.1021/ja060943h. [DOI] [PMC free article] [PubMed] [Google Scholar]
Associated Data
This section collects any data citations, data availability statements, or supplementary materials included in this article.
Supplementary Materials
Note: Supplementary information is available on the Nature Biotechnology website.


