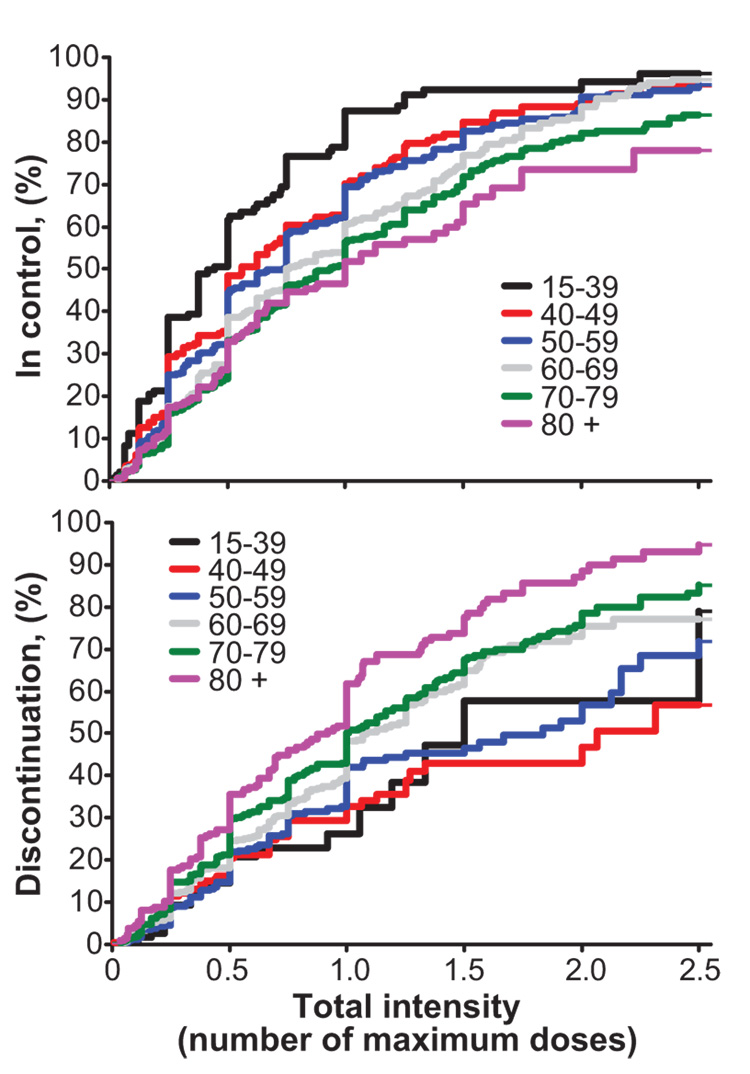
Figure 1.
Efficacy and discontinuation curves separate by age category. Top, The efficacy curves show the probability of attaining blood pressure control at various treatment intensity units and separately across age categories. Bottom, The discontinuation curves show the probability of either the physician or the patient choosing to discontinue further medication increases to attain BP control. Curves in both panels are calculated using the K-M method.

