

Abstract
Plexins are the first known transmembrane receptors that interact directly with small GTPases. On binding to certain Rho family GTPases, the receptor regulates the remodeling of the actin cytoskeleton and alters cell movement in response to semaphorin guidance cues. In a joint solution NMR spectroscopy and x-ray crystallographic study, we characterize a 120-residue cytoplasmic independent folding domain of plexin-B1 that directly binds three Rho family GTPases, Rac1, Rnd1, and RhoD. The NMR data show that, surprisingly, the Cdc42/Rac interactive binding-like motif of plexin-B1 is not involved in this interaction. Instead, all three GTPases interact with the same region, β-strands 3 and 4 and a short α-helical segment of the plexin domain. The 2.0 Å resolution x-ray structure shows that these segments are brought together by the tertiary structure of the ubiquitin-like fold. In the crystal, the protein is dimerized with C2 symmetry through a four-stranded antiparallel β-sheet that is formed outside the fold by a long loop between the monomers. This region is adjacent to the GTPase binding motifs identified by NMR. Destabilization of the dimer in solution by binding of any one of the three GTPases suggests a model for receptor regulation that involves bidirectional signaling. The model implies a multifunctional role for the GTPase-plexin interaction that includes conformational change and a localization of active receptors in the signaling mechanism.
Members of the plexin family of transmembrane receptors have important functions in guiding axon growth in the developing nervous system (1-3). Plexins also function in several developmental processes such as cardiovascular development and angiogenesis (4-8), in the invasive growth of epithelial cells (9), and in the immune system (10). The extracellular part of plexin shares significant homology with that of the hepato-cyte growth factor receptor as well as with semaphorins, the principal family of ligands for plexins. The cytoplasmic region of plexins is also well conserved (11). Two segments with homology to Ras GTPase-activating proteins (GAPs)5 are linked by a region that has been identified as the location for the binding of several Rho family GTPases.
Plexins are unique in that they are the first documented example of a transmembrane receptor that interacts directly with small GTPases. Most A- and B-family plexins bind activated Rac1 and Rnd1 (12-15), Rho family GTPases that are known regulators of cytoskeletal dynamics and cell adhesion (16). Plexin-A1 has also been shown to bind active RhoD (17), another Rho family GTPase involved in actin remodeling and endosomal dynamics and possibly in receptor down-regulation (18). The role of these plexin-Rho GTPase interactions has remained unclear, however, as have the characteristics of the binding region. Does the Rho GTPase binding segment provide a GTPase regulatory property, functioning akin to a guanine nucleotide dissociation inhibitor by sequestering certain Rho family GTPases, or does it act as an effector protein in response to GTPase binding (19-23)? Similarly, it is not certain whether Rac1, Rnd1, and RhoD bind to the same or to different regions of plexin and whether such binding is competitive or simultaneous. Furthermore, binding of one GTPase could cause a conformational change in plexin, allowing the binding of the other Rho GTPase family members (24). Rac1 and Rnd1 binding are known to disrupt the association of N- and C-terminal fragments of the cytoplasmic plexin region (20, 21, 25), but whether structural changes in the Rho GTPase binding region are involved in this transition has not been addressed. These issues suggest that a structural characterization of the Rho GTPase binding segment would be a key step in our understanding of the signaling mechanisms of plexin.
The Rho GTPase binding region of plexins has been broadly localized to ~200 amino acids that separate the two GAP-homologous regions (12-14, 17, 20), yet the exact residues involved in binding have not been unambiguously defined. We recently reported the assignments of NMR spectra for the central linker region of plexin-B1 (26) as well as for active Rac1 (27). Here, we applied chemical shift mapping of the GTPase-plexin interaction by high field solution NMR spectroscopy, an ideal tool for the localization of the binding surfaces and characterization of possible conformational changes that accompany the interaction. We also report the x-ray structure of the plexin-B1 domain, allowing us to map this information onto the ubiquitin-like fold of the protein. It is apparent that the Rho GTPase binding surface is adjacent to the dimerization interface. RBD dimerization is destabilized by all three Rho GTPases in solution. We discuss the multifunctional role of the Rho GTPaseplexin interaction and general implications for Rho GTPase signaling in receptor-mediated guidance processes.
EXPERIMENTAL PROCEDURES
Plasmids and Mutagenesis
Twelve constructs of the cytoplasmic region of human plexin-B1 (see Supplemental Material) were PCR-subcloned into bacterial expression vectors pET-11a and into a modified version of pGEX-2T. Construct E (residues 1743–1862) was used for the majority of studies and is referred to as Rho GTPase binding domain (RBD). Two lysine residues were added N-terminally to enhance overexpression in Escherichia coli. Construct E was also cloned into His-tagged expression vector pET28-mhl (GI:134105571) for crystallography. QuikChange (Stratagene) was used to make point mutations.
Protein Expression and Purification
All proteins were overexpressed in either Escherichia coli BL21(DE3) or E. coli BL21(DE3) CodonPlus-RIL cells grown in Terrific Broth. The bacteria were induced with 1 mm isopropyl 1-thio-β-d-galacto-pyranoside at an A600 nm of 0.8–1.0 and grown overnight at 25 °C. Samples for NMR studies were expressed in minimal M9 medium with [15N]ammonium chloride and/or [13C]glucose as the sole nitrogen/carbon source. Partial or full deuteration was achieved by growth in 50% D2O and 50% H2O, or in 100% D2O M9 medium with deuterated glucose. Harvested cells were resuspended in a glutathione S-transferase binding/phosphate buffer (50 mm phosphate buffer, pH 6.8, 50 mm NaCl, 4 mm MgCl2, 4 mm dithiothreitol) and stored at −80 °C. Plexin purification and pulldown assays were carried out at 4 °C as described before (28). Protein used for crystallization trial was purified in Tris buffer (50 mm Tris, pH 7.5, 150 mm NaCl, 5 mm MgCl2, dithiothreitol) using nickel-nitrilotriacetic acid resin (GE Healthcare). A 48-amino acid peptide corresponding to human plexin-B1 residues 1843–1890 was commercially synthesized at a purity of 95% (EZBiolab Inc., Westfield, IN).
Untagged Rac1 proteins were purified using CM-Sepharose ion exchange column followed by a Superdex-75 column. Rnd1 and RhoD were obtained from purified His-tagged protein followed by cleavage of eluted protein by His-tagged tobacco etch virus protease (United States Biological, Swampscott, MA) for 2 h at 30 °C. Wild type GTPases were loaded with the nonhydrolyzable GTP analog GMPPNP in the presence of agarose cross-linked calf intestinal alkaline phosphatase and then purified using Superdex-75 size exclusion chromatography (GE Healthcare). Our results show that the constitutively active forms of the GTPases give closely similar results to GMPPNP-loaded proteins, yet the former could be obtained at higher yield. Hence Rac1 Q61L, RhoD Q75L, and wild type Rnd1 were used in many of the experiments.
Crystallization and Crystal Structure Determination
Crystallization experiments were performed using the hanging-drop vapor diffusion method at room temperature. A mixture of 1 μl of protein stock solution (20–30 mg/ml) and 1 μl of reservoir buffer was equilibrated against a reservoir solution containing 2.6 m NaCl, 0.1 m Tris, pH 8.0, 18% ethylene glycol. Crystals usually reach a size of 50 μm within 2–3 days. For selenomethionine labeling of plexin-B1, prepackaged M9 selenomethionine growth media kit (Medicilon, Chicago) was used following the manufacturer’s instructions. Measured molecular weights of native and selenomethionine-labeled protein are 15,417.85 and 15,511.67, respectively. Single crystals were picked from the crystallization drop with a nylon loop (Hampton Research, Aliso Viejo, CA) and flash-frozen in liquid nitrogen. X-ray diffraction data were collected on beam lines at the Advanced Photon Source in Chicago. Using data collected at beam line 19ID, the structure was solved in space group P212121 by the single wavelength anomalous diffraction (29) method with the program SHELX (30), and an initial model was built by the program RESOLVE (31). Model refinement was performed against data collected at beam line 23ID-B with the programs REFMAC (32), MOLPROBITY (33), and COOT (34). Additional information on diffraction data processing and model refinement is listed in Table 1. The crystallographic model of the plexin-RBD was deposited in the Protein Data Bank with code 2r2o.
TABLE 1.
Statistics for x-ray structure determination
| Beam line | 19ID | 23ID-B |
|---|---|---|
| Wavelength | 0.9794 Å | 0.9792 Å |
| Detector | ADSC Q315 | MAR300 |
| Cell a, b, c | 42.91, 121.52, 66.28 Å | 50.98, 56.57, 99.37 Å |
| Resolution (outer shell) | 40.00-2.30 (2.38-2.30) Å | 50.00-2.00 (2.07-2.00) Å |
| Rsym | 8.2 (48.9)% | 6.7 (43.5)% |
| I/σ (I) | 30.3 (2.6)% | 36.6 (1.4)% |
| Completeness | 99.6 (96.8)% | 94.8 (62.5)% |
| Redundancy | 6.7 (5.1) | 6.4 (2.7) |
| Refinement resolution | 2.00 Å | |
| No. of HKLs | 18229 | |
| Rwork (Rfree) | 22.2 (26.9)% | |
| No. of atoms | 1561 | |
| (Polypeptide) | 1513 | |
| (Water) | 48 | |
| B-factors | 41.2 Å2 | |
| (Polypeptide) | 41.2 | |
| (Water) | 43.0 | |
| Root mean square deviation from ideal | ||
| Bond lengths [Å] | 0.017 | |
| Bond angles [°] | 1.4 | |
| Φ-Ψ plot within | 99.5% | |
| preferred regionsa | ||
Contour boundaries defined by 98% of reference conformers (50). There were no outliers.
NMR Spectroscopy
NMR experiments were carried out on samples in glutathione S-transferase buffer/phosphate (above) at 25 °C on Bruker Avance 600-, 800-, or 900-MHz spectrometers equipped with TXI cryoprobes. For titrations between Rac1 Q61L, Rnd1, RhoD Q75L with plexin-B1, 15N, 13C, 50 or 100% 2H-labeled wild type RBD or the monomerization mutant W1830F was used. A stock solution containing a 1.05 mm GTPase and 0.25 mm RBD mixture was added in aliquots to a 0.25 mm RBD solution to avoid dilution. To test for interactions between Rac1 GMPPNP and the other plexin constructs, 15N-1H TROSY spectra were acquired before and after addition of unlabeled protein or peptide. Backbone chemical shift assignment of Rac1-complexed plexin-B1 RBD W1830F was carried out on a 0.5 mm sample of unlabeled Rac1 Q61L and labeled plexin complex (molarity ratio 1.2:1), employing TROSY versions of three-dimensional HNCACB, HNCOCACB, HNCA, and HNCOCA NMR experiments. Most of the amide groups of the Rnd1- and RhoD-bound plexin-B1 RBD W1830F could be assigned by comparing HSQC spectra with those of the unbound protein and of the protein bound with Rac1 Q61L. Several of the residues in the C-terminal region of plexin construct F (residues 1743–1891) could be assigned by 15N-edited three-dimensional TOCSY-HSQC and NOESY-HSQC. The pulse sequence of Shimada and co-workers (35) was used to measure saturation transfer between unlabeled Rac1 Q61L and fully deuterated 15N-labeled plexin RBD in both 10% D2O and in 85% D2O. A saturation of 2.6 s was used. The differences seen in the results under the two solvent conditions are similar to those observed in other studies (36). Samples for MTSL spin labeling were prepared as described (37). Two samples were used for the NMR TROSY-HSQC experiments, a 15N-labeled C1774S/C1852S double mutant (removing both native cysteines) mixed at 1:2 ratio with either one of the 14N single Cys mutants proteins labeled on Cys-1774 or Cys-1852 by MTSL. To reference the effects of the paramagnetic relaxation due to this nitroxide label, the latter was reduced by incubation of the proteins with 2–3-fold excess of ascorbic acid. All spectra were processed with nmrPipe and analyzed with NMRView. Signal intensity was quantified by height of the peak maximum.
Alignment and Motif Search
See Supplemental Materials for the alignment and motif search.
Calorimetric Measurements
Interaction studies of plexin-B1 and Rac1/Rnd1/RhoD were carried out using an isothermal titration calorimeter (VP-ITC, Microcal, Northhampton, MA). All the proteins were extensively exchanged into the same buffer prior to the experiment. The primary ligand (Rac1/Rnd1/RhoD) was placed under temperature control into the heat-sensitive cell (volume 1.43 ml), and the secondary ligand (plexin-B1) was placed into a syringe immersed into the cell (capacity 0.295 ml). The concentration of Rac1/Rnd1/RhoD was 40 μm, and the concentration of plexin-B1 was set 15–20 times higher than the GTPases. Dimer formation was monitored similarly, but with blank starting buffer in the cell instead of the GTPases. The data were analyzed using Origin software, which gives the binary equilibrium association constant (Ka = 1/Kd, where Kd is equal to [GTPase] × [plexin]/[GTPase-Plexin], in the case of the GTPase-plexin interaction). The experiments were repeated three times. The experimental error calculated for Kd was typically less than 10%.
Gel Filtration
A Superdex-75 size exclusion column was calibrated for analytical molecular weight determination with the standard kit of proteins from GE Healthcare. Kav is calculated as (Ve – Vo)/(Vt – Vo), where Ve is the elution volume; Vo is the column void volume; and Vt is the total column bed volume. Molecular weights (Mr) were determined relative to this calibration curve (linear relationship between Kav and log(Mr) of standards). Uncertainty in the measurement is typically ±15%.
RESULTS
Defining the Minimal Rho GTPase Binding Domain
We examined 12 protein constructs of human plexin-B1 (supplemental Fig. S1). These encompass major parts of the ~200 amino segment that is located between two regions with high homology to RasGAP and that is known to bind active Rac1 and Rnd1 (12, 13, 19). RhoD binds to an equivalent region of plexin-A1 (17). The HSQC spectrum of construct B (Fig. 1a), residues 1725–1891, appears as a combination of signals that arise from well structured regions and from unstructured segments of the polypeptide chain. The majority of the latter signals are eliminated by truncation of the protein to residues 1743–1862 (construct E, Fig. 1b), suggesting that this region mainly includes a folded domain and that the additional 17 N-and 49 C-terminal residues in construct B are unstructured. Construct E of plexin-B1, referred to as the Rho GTPase binding domain (RBD) hereafter, is the minimal independent folding unit. Further substantial truncation at the N terminus (construct H shown in Fig. 1c) or at the C terminus renders the protein partially folded or unfolded. The folded plexin-B1 RBD binds Rac1 in a GTP-dependent manner, i.e. only the active GTP homolog GMPPNP-bound Rac1 or constitutively active mutant Q61L GTPase, but not the inactive GDP-bound state of Rac1, can bind plexin-B1 as judged by glutathione S-transferase pulldown assay (supplemental Fig. S2). In fact, using NMR, we find that the spectrum of free plexin-B1 RBD (at 250 μm) is completely unaffected even by addition of 1.0 mm Rac1-GDP, showing that the plexin RBD is highly selective for the activated form. Similar results are obtained with inactive and active (Q75L) RhoD.
FIGURE 1. 1H-15N HSQC spectra of plexin segments as follows: a, 1725–1891, construct B; b, 1743–1862, construct E; and c, 1770–1891, construct H.
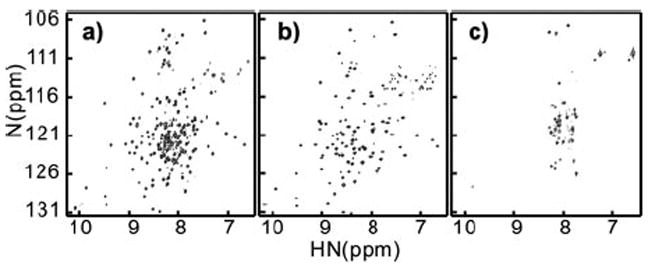
Samples were ~0.5mm recorded at 600-MHz 1H frequency at 25 °C in phosphate buffer (see “Experimental Procedures”).
X-ray Structure of the RBD of Plexin-B1
We crystallized and determined the crystallographic protein structure of the plexin-B1 RBD. Table 1 gives the statistics of the data acquisition and refinement. The structure is consistent with the previous identification of the plexin-B1 RBD as a ubiquitin fold (26). The core structure has a main chain root mean square deviation of 1.7 Å for 70 of 76 residues from human ubiquitin and a Z score of 8.6 (highly significant structural similarity) calculated by the Dali server (38). In contrast to the compact overall structure of this protein, several long loops are inserted in the RBD ubiquitin fold, and a second helix shows α-helical rather than 310 helical hydrogen bonding. Remarkable is the observation of a short four-stranded antiparallel β-sheet (Fig. 2a), which is formed outside of the ubiquitin-like fold by the central portion of loop residues 1818–1833. The dimer has C2 symmetry, and Trp-1830, the residue that is critical for dimerization (28), is a prominent feature. The structure is stabilized by intermolecular hydrogen bonding and the interaction of the Arg-1831 side chain cation with Trp-1830 ring π electrons. Although a clear organization and spacing of the dimerization loop is evident in the crystal structure, any resonances associated with this loop region were either absent or severely exchange broadened in NMR spectra (28). Changes in temperature, pH, or salt concentration, as well as addition of co-solvents fail to stabilize the dimerization region in a single structure in solution, raising the possibility that the well defined organization of the dimer is confined to the crystal lattice. To investigate the relative orientation of the two monomeric units in solution, the paramagnetic probe MTSL was used to label either Cys-1774 or Cys-1852 in single cysteine RBD mutants. The distance-dependent paramagnetic relaxation effect was monitored in the dimer of 15N-labeled no-Cys RBD and MTSL-reacted single Cys 14N protein. The two proteins were mixed in a 1:2 ratio. The minimal signal that is predicted in this 15N/14N mixture is close to that observed for residues 1802 and 1852 (supplemental Fig. S3). Following the approach of Battiste and Wagner (37), we estimate that these segments are within ~14 Å of Cys-1852 in the opposite molecule of the dimer. This result is consistent with the C2 symmetry found in the crystal, as a significant population of an “up”/“down” arrangement, for example, would considerably diminish the relaxation effect.
FIGURE 2. Ribbon display of secondary structure in x-ray crystal structure of the plexin-B1 RBD dimer (Protein Data Bank code 2r2o).

Side chains are indicated as lines. a, the dimerization loop showing Trp-1830; b, entire dimer. Locations of Cys-1774 and Cys-1852 used for spin labeling are marked.
Mapping the Rac1/Rnd1/RhoD Binding Interface of the Plexin RBD
To characterize the regions of the plexin-B1 RBD that bind the three GTPases, chemical shifts in 15N-1H TROSY NMR spectra of plexin-B1 RBD in the GTPase-bound states were compared with those in spectra of the unbound state. For active Rac1 and Rnd1, free and bound proteins are in slow exchange on the NMR time scale, consistent with a dissociation constant in the low or sub-micromolar scale. For active RhoD Q75L the binding affinity is weaker, giving rise to intensity changes rather than chemical shifts. Weighted chemical shift and intensity changes (Fig. 3, a and c) indicate that the same region of about 40 residues is involved in the interaction. This region encompasses parts of strands β3, β4, and β5 as well as a long loop and a second short α-helix, and it is involved in the binding of all three GTPases (Figs. 3 and 4). In addition, considerable chemical shift changes are seen for residues Ile-1777 and Ser-1778, a region that is close to the β3-β5 segment of the protein and therefore may also be involved in binding. Of the four segments indicated as binding sites by the chemical shifts (Fig. 3a), the N terminus of the first α-helix and the long loop region (residues 1818–1833) show lesser perturbations.
FIGURE 3.
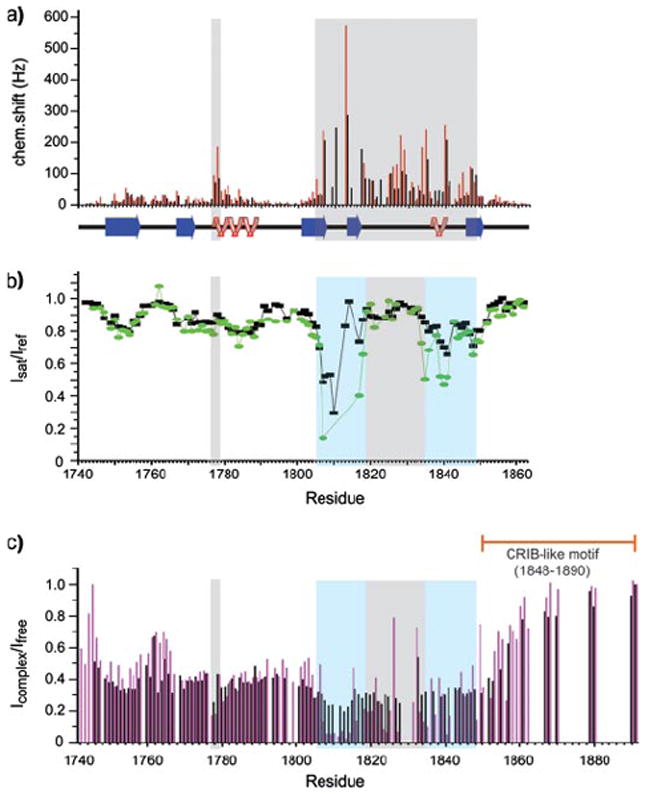
a, weighted chemical shift changes from the free monomeric protein for Rac1 Q61L bound (black) and for Rnd1 bound (red) plexin-B1 construct E as a function of sequence. b, saturation transfer experiment (black for the RBD-Rac1 complex in 10% D2O, 90% H2O, and green for the complex in 85% D2O, 15% H2O. c, intensity ratio between signals from Rac1- (black) and RhoD-bound (magenta) plexin with those of the free plexin domain (construct F, residues 1743–1891). Regions responsible for Rho GTPases binding are shaded light blue in b and c, and region primarily involved in dimerization (28) is shaded gray.
FIGURE 4.
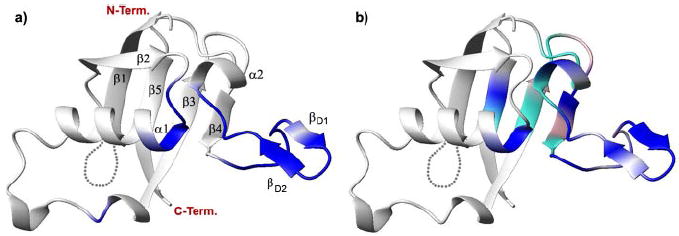
a, significant resonance intensity changes (scaled Ihigh/Ilow < 0.2, blue) upon RBD dimerization (28) mapped onto the structure of the RBD x-ray structure (Protein Data Bank code 2r2o). b, location of residues that experience significant saturation transfer (Isat/Iref < 0.7, blue) or only chemical shift perturbations (weighted Δδ > 0.15 ppm, cyan) as a result of GTPase-plexin RBD interactions mapped onto the structure of the Rho GTPase binding domain of plexin-B1. Locations with missing data are colored in pink. The secondary structure of the protein is shown in ribbon presentation. Loop residues 1757–1763 are missing in the crystal structure and are indicated by dots.
To further distinguish between regions that are in direct contact with the GTPases and those that are affected indirectly by conformational changes of nearby residues, a saturation transfer NMR experiment pioneered by Shimada (36) has been found useful. NMR signals are only attenuated if the atoms are in close contact with the other bound protein. Fig. 3b shows the results for the monomeric (W1830F) 15N, 2H plexin RBD-bound by unlabeled Rac1 Q61L. Remarkably, no contacts are indicated for either the region of residues 1777–1778 (two residues at the N terminus of the α-helix) or for a large portion of the long dimerization loop (residues 1818–1833). It was noticed before that several mutations in the latter regions, such as W1830F, do not lead to a significant loss of binding affinity (28). Thus, these two regions are not directly involved in the interaction, but they may experience conformational changes because of their proximity to the binding region.
Plexin Binds Rho Family GTPases through a Novel and Specific Motif
In addition to the NMR data, site-directed mutagenesis at residues 1814 and 18156 and at 1834 and 1837–1839 (28) results in a loss of binding affinity for Rac1, confirming the importance of the other two segments. We call the two segments (residues 1806–1818 and residues 1834–1841) PRAMs (Plexin Rho GTPase association motifs). A sequence alignment (Fig. 5) and motif search show that the two segments are conserved in most plexin-A and -B family proteins but are not found in other major protein families. In particular, they are not found in any other small GTPase-binding proteins. This suggests that these two segments aEWXXGXX[GA]+aaa and N[TS]aXHYXa are unique and specific to plexin family members (see the legend of Fig. 5 for annotation). Based on the sequence comparison, we predict that most plexins from higher organisms will bind Rac1, Rnd1, and RhoD, whereas plexin-B2, -C1, and -D1 have several amino acid substitutions in the first motif and are expected to bind the Rho GTPases with diminished affinity.
FIGURE 5. Alignment of the RBD domain of different members of the plexin family for two broad regions of interest (residues 1770–1785 and residues 1805–1852).

Regions with NMR signals that are affected by Rac1 binding are boxed and shaded in the secondary structure strip (top), and the locations of the two PRAM segmentsare indicated. X denotes any amino acid, [ABC] denotes either A, B, or C; a indicates aliphatic residues [AILMV], and + positively charged residues [HKR]. Residues that are invariant across all the plexins aligned here have a yellow background, highly conserved residues have a blue background, and chemically similar residues a green background.
The tertiary structure of the protein (Fig. 4) shows that the two motifs are brought together in a single binding region. Significantly, we find the same region is involved in the binding of all three GTPases, implying that the GTPases cannot bind to plexin-B1 simultaneously. Indeed, spectra recorded of a Rac1/Rnd1 mixture with the RBD, for example, are a superposition of Rnd1-RBD and Rac1-RBD spectra. Gel filtration data also show that ternary complexes are not formed but that the GTPases compete for the same binding site.
GTPase Binding Destabilizes RBD Dimerization
Interestingly, two regions, residues 1806–1818 and 1834–1848, involved in Rho GTPase binding are directly adjacent in space to the region shown to be involved RBD dimerization (Figs. 2 and 4). Using ITC, a dissociation constant, Kd, in the low micromolar range is measured for the plexin-B1 RBD-Rho GTPase complexes (Fig. 6a). The values are 6.1, 5.5, and 17.0 μm for constitutively active Rac1, Rnd1, and RhoD, respectively. In contrast, a Kd value for dimerization of the RBD was measured as 30 μm by ITC (Fig. 6b) and was estimated to be near 25 μm by gel filtration at 4 °C (28). The GTPase-binding site and the RBD dimerization site are adjacent to one another, suggesting that GTPase binding could either increase or decrease the tendency of the RBD to dimerize. In the case that the two interactions are neutral to one another or in fact cooperate, we would expect to observe higher order oligomers (1–2 GTPases per 1 RBD dimer). Gel filtration (supplemental Fig. S4; Table 2), however, shows that only 1:1 RBD-GTPase complexes are formed. This is the case even at high RBD-GTPase concentrations (1:4 ratio at 0.25 mm RBD concentration). NMR spectra of the dimer are characteristic in that they either lack or have greatly diminished intensity for amide resonances of residues 1825–1835 as well as for 1775–1778 (28). Titration of active Rac1 into a sample of RBD dimer results in a significant recovery of these resonances, indicating that the structure of the dimerization loop is influenced by the GTPase and that the loop becomes more flexile in the Rac1-bound state. This is consistent with gel filtration data showing that the interaction with the GTPases destabilizes the RBD dimer.
FIGURE 6.
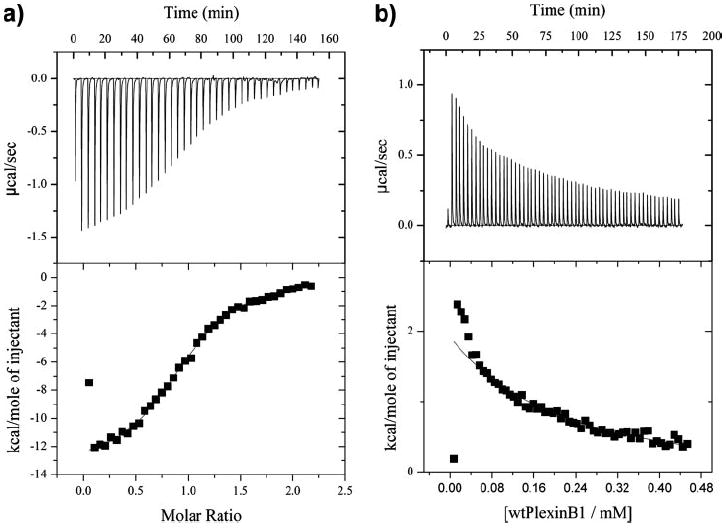
a, representative binding isotherm, here for Rac1-plexin-B1 binding, obtained from isothermal calorimetric titration experiments in phosphate buffer, pH 7.0, with 4 mm MgCl2 and 1 mm tris(2-carboxyethyl) phosphine (TCEP) at 25 °C. Top, raw data; bottom, peak integrated and concentration-normalized enthalpy change. b, isotherm for plexin-B1 monomer-dimer conversion under the same conditions as above. Top, raw data; bottom, peak integrated enthalpy change.
TABLE 2. Molecular weights determined by gel filtration on a Superdex-75 column.
Only a single peak was observed in gel filtration elution profiles for plexin RBD complexes with Rac1, Rnd1, or RhoD GTPases and for mixtures (not shown). Rnd1 and Rnd1-RBD run at a larger Mr possibly due to protein shape (long unstructured termini).
| Proteins | ExpectedMr | ExperimentalMr |
|---|---|---|
| RBD W1830F | 13.4 | 13.0 |
| RBD dimer | 26.8 | 25.9 |
| Rac1 | 22.1 | 23.5 |
| Rac1 + plexin | 35.5 | 34.0 |
| Rnd1 | 24.6 | 32.6 |
| Rnd1 + plexin | 38.1 | 45.0 |
| RhoD | 21.4 | 18.3 |
| RhoD + plexin | 35.0 | 33.5 |
DISCUSSION
The direct binding of small GTPases to cytoplasmic domains of the plexin trans-membrane receptor remains an oddity in the universe of protein-protein interactions employed in cell signaling. In other systems characterized to date, communication between receptor proteins and small GTPases occurs via intermediary molecules or is transient. By contrast, the interaction between small Rho family GTPases and the plexin-receptor is a direct one, and a number of roles have been proposed for this binding event in the signaling mechanism. The determination of the domain structure and characterization of its GTPase binding interface allows us to comment on several of these suggested roles. Furthermore, the structural model we put forward for receptor activation has important implications for cell signaling that involves Rho GTPases and guidance processes in general.
Plexin-B1 Does Not Bind the Rho Family GTPases through the Putative CRIB Motif
We used NMR spectroscopy with reference to the crystal structure of the RBD to map the interaction sites with active Rac1, RhoD, and Rnd1 (Figs. 2 and 4). Surprisingly, all three GTPases bind to the same region. This common binding interface does not involve the putative CRIB motif (12) (residues 1848–1890 of plexin-B1) that was thought to be responsible for Rho GTPase binding. The CRIB motif is widely distributed and well characterized in several effector proteins (39). It binds to Rac1 and Cdc42 through a segment of around 16 amino acid residues (consensus motif ISXPXXXXFXHXXHVG). The assumption that a CRIB-like motif is responsible for GTPase binding to plexin-B1 has rested on site-directed mutagenesis data. Specifically, a mutation of residues 1849–1851, a Leu-Val-Pro sequence at the beginning of the motif to Gly-Gly-Ala, is known to abolish all binding (12, 20, 25). With reference to the structure of the domain, this three-residue mutation is located in the middle of β-strand 5 and would dramatically increase chain flexibility in the center of the protein (Fig. 4). This is likely to disrupt the hydrogen bond network of strand β5 to strands β1 and β3, and this eliminates important hydrophobic side chain contacts. The mutation is thus expected to dramatically destabilize the protein fold, a change that should indeed alter the binding affinity toward the GTPases.
Interestingly, however, binding of GTPases to CRIB motifs does not depend on a folded structure, because the motif is sequence-continuous. In fact, it has been shown in other effector proteins that at least part of the CRIB motif usually resides in a region of the polypeptide chain that is unstructured, whereas another part overlaps an adjacent structured segment. This is also the case in the RBD structure where the putative motif begins at the center of β-strand 5 and continues to the unstructured C terminus. GTPase binding to CRIB motifs in other proteins is accompanied by a destabilization of their structured region (40). Because of the thermodynamic cost of such a conformational switch, unstructured protein fragments containing the CRIB motif typically bind to small Rho GTPases with high affinity (Kd in nanomolar range).
We examined whether several unfolded or partially folded segments of plexin containing the putative CRIB motif bind to Rac1-GMPPNP (supplemental Fig. S1). Monitored by the NMR chemical shifts of 15N-labeled GTPase, it is found that none of the CRIB-like plexin fragments, even weakly interacts with the GTPase, despite a lack of competing structures. This result suggests that the homology of the putative CRIB motif in plexin-B1 is too low to allow GTPase binding by itself (12). In fact, only two of the eight core residues of the CRIB consensus sequence are found in plexin-B1 and only one in plexin-A1 (see Fig. 3 in Ref. 12). Again, the results emphasize the requirement that the structure of the protein is folded for GTPase binding and confirm that the putative CRIB motif is not involved in binding to the three GTPases. The region that is involved in the interaction with the Rho GTPases is shown in Figs. 4b and 5. We find that the two sequence motifs involved in binding are brought together by the ubiquitin-like tertiary fold of the plexin domain. They are well conserved across plexins and also not found in other proteins, presenting a novel motif for Rho GTPase-effector protein interactions.
GTPase Sequestration and Plexin-mediated Cell Signaling
A number of reports have suggested that the plexin receptor has an active, GTPase regulatory role by sequestration of certain Rho GTPases to the RBD. The association then withdraws these GTPases from the pool of active molecules that regulate the actin cytoskeleton. Specifically, Rac1 is involved in the formation of lamellipodial actin structures in cell motility, for example via p21-activated kinase (14). Sequestration of the active GTPase would stop this forward movement, consistent with the function of plexin in growth cone collapse (19). Our results show that the plexin-B1 RBD binds to the three different Rho family GTPases with broadly similar affinities through a common interface. Thus it is possible that a sequestration role may also extend to Rnd1 and RhoD. This is plausible in terms of their function; Rnd1 binding is required for p190 RhoGAP activation for the down-regulation of RhoA, a mechanism that opposes the formation of stress fibers involved in collapse (41). Similarly, active RhoD has been shown to stimulate the disassembly of actin stress fibers (42), and thus its sequestration would have the same effect on cell motility. Furthermore, it has been suggested that active RhoD affects endosomal dynamics (43), specifically by slowing the endocytic/recycling circuit that appears to be required for growth cone collapse (44). Although it has been reported that overexpressed Rnd1 and active RhoD oppose each other (17), it is not clear whether these effects occur through plexin or downstream of it.7
Our finding that the three GTPases bind to the same region of the cytoplasmic domain furthermore implies that they could function competitively. Although their binding affinity toward the RBD is broadly similar, RBD-GAP domain or GTPase-GAP domain interactions appear to modify the affinity. We and others find that active Rac1 binds more weakly to protein constructs encompassing the entire cytoplasmic region of plexin-B1 in comparison with Rnd1 (12, 20). The binding affinity, even of the RBD itself, which we measured in the range of 6–17 μm Kd, may not be strong enough to sequester GTPases effectively. In addition it is unclear whether a sufficient number of receptors can be localized to sequester the great majority of GTPases in particular cellular regions. Although experimental data are still lacking on the relative local concentration of receptors versus GTPases, such considerations make GTPase sequestration unlikely as a principal signaling mechanism.
Conformational Changes in the Plexin Rho GTPase Binding Domain upon GTPase Association
Signal transduction is often facilitated by dramatic conformational changes in the molecules involved, whereas in other cases conformational changes are rather subtle. Surprisingly, the perturbations that are seen upon binding of activated Rac1, Rnd1, or RhoD in NMR spectra of the RBD protein main chain are limited to about 40 residues. Mapping of these perturbations onto the structure shows that the affected residues are localized on one side of the plexin domain (Fig. 6). Structural perturbations to the remaining residues are very small, demonstrating that the domain does not undergo significant conformational changes in regions that are remote from the Rho GTPase binding interface. This finding suggests that an allosteric mechanism is not likely to be involved in the signaling, if it involves residues only within the RBD region.
Negishi and co-workers (20, 21) suggested that conformational changes are necessary in the plexin-B1 cytoplasmic domains to activate the GAP function of plexin-B1 toward R-Ras. In particular, two studies present data on intramolecular interactions between the cytoplasmic N- and C-terminal domains of plexin-A1 and -B1, also showing that active Rac1 and Rnd1, respectively, disrupt contacts between N- and C-terminal fragments (20, 21, 25). Interestingly, although the RBD is not part of the GAP domains, fragments that contain an intact RBD are required for the GAP domains to interact. Unless the structure of the RBD is significantly different in the full-length receptor from that of the isolated domain characterized here (Figs. 2 and 4), our results would put a limit on the conformational changes that are possible in the RBD on Rho GTPase binding. Instead of a conformational change within the ubiquitin fold of the RBD, our data support a much more straightforward structural mechanism for receptor activation. This mechanism involves the dimerization behavior of the cytoplasmic domain itself.
A Model for the Role of Rho GTPases in Receptor Activation; GTPase Binding Facilitates Receptor Signaling by Destabilization of the Dimerization of Wild Type Plexin-B1 RBD
Mutations in Rac1 have suggested previously that plexins are an effector of small Rho GTPases (12, 13). The NMR data presented in this study show that the same surface of the plexin-B1 RBD binds three Rho family GTPases, Rac1, Rnd1, and RhoD. An effector role of the RBD segment is consistent with the biological function of Rac1 and Rnd1 in receptor activation (21, 25). It is not known yet whether RhoD binding also leads to receptor activation (see above). The simplest interpretation of our binding data is that the response of plexin to the binding of Rac1, RhoD, and Rnd1 is associated with a common component in the signaling mechanism, irrespective of the nature of the GTPase. Although GTPase binding perturbs the structure of the Rho GTPase binding domain only locally, significant conformational changes are likely to occur between the RBD and the surrounding cytoplasmic domains. As we had previously inferred from site-directed mutagenesis data (28), we confirm here that the Rho GTPase binding and RBD dimerization sites are adjacent to one another and could overlap partially (Fig. 4). Furthermore, it is shown in the present study that binding of all three Rho GTPases disrupts RBD dimers in solution. Although the exact mechanism of dimer destabilization will need to be established in further structural studies, our findings lead us to propose a model for the involvement of Rho GTPases in plexin-mediated cell signaling.
The model shown in Fig. 7 proposes a dimeric form as the inactive resting state of the receptor. Importantly, Semaphorin3A and Semaphorin4D (ligands of plexin-A1 and -B1, respectively) were each crystallized as dimers (45, 46). Based on the homology of the plexin extracellular domain to semaphorins, it is highly likely that the extracellular side of the inactive receptor is also a dimer. Interestingly, removal of these extracellular domains yields constitutively active plexin-A1 and -B1 receptors (21, 47), also suggesting that the inactive state is dimeric. Ligand binding then leads to conformational changes that disrupt dimerization or reorganize the dimerized form of the receptor on the extracellular side, as proposed by Nikolov and co-workers (46). The results presented here on GTPase binding near the RBD dimerization region and on the destabilization of RBD dimers significantly advance this model. The model is based on the premise that the interaction of Rho GTPases with plexin will alter, if not disrupt, the dimeric structure of the receptor on the cytoplasmic side. It is not clear whether Rac1, Rnd1, or RhoD binding alone is sufficient to alter the dimeric structure of the full receptor protein as shown, but their binding will at least destabilize the inactive, unbound dimeric state. Future studies will be needed to characterize the transitions between the different dimeric or oligomeric forms of the receptor. However, the change in the receptor conformation from the cytoplasmic side appears to enhance semaphorin binding, as has been reported for plexin-B1 (19) in support of this model.
FIGURE 7. Model for receptor activation via the bi-directional mechanism.
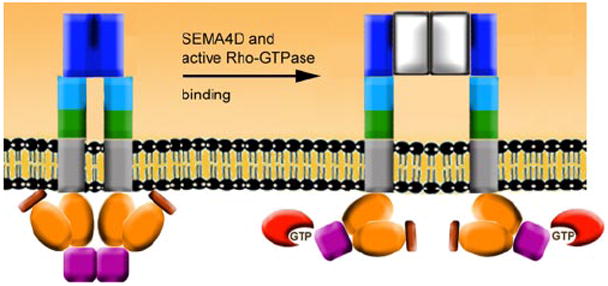
Shown are the semaphorin homologous extracellular region of plexin-B1 (dark blue), R-Ras GAP homologous regions (orange), Rac1/Rnd1 binding domains (violet), Rac1/Rnd1/RhoD GTPase (red). A dimeric extracellular region is altered by binding of the dimeric ligand Semaphorin4D (gray), and the interaction of the RBD with active Rho GTPases facilitates conformational change on the cytoplasmic side. Inside and outside signals cooperate in a destabilization of the inactive, dimeric form of the receptor.
Multifunctional Role of the GTPase-Plexin Interaction in the Process of Guidance
Plexins are the first group of transmembrane receptors known to interact directly with small GTPases. The three Rho GTPases, Rac1, Rnd1, and RhoD, belong to different subfamilies and much remains to be understood about their complex signaling behavior in cells (48). However, we believe it is no accident these three GTPases, and not many others (17), bind to plexin-A1 and -B1, and possibly most of the A- and B-family members. Remarkably, the nature of the interaction adds support for a bi-directional signaling mechanism and provides a straightforward structural model for it (Fig. 7). In the “outside-in” signaling component, semaphorin binding destabilizes the inactive receptor dimer, transmitting this conformational preference also to the cytoplasmic side. The destabilization of the dimeric form cooperates with the binding of active Rac1, Rnd1, and RhoD, possibly leading to a synergistic enhancement of both GTPase and ligand affinities. However, even in the absence of extracellular ligand, GTPase binding may prime the receptor for activity, via an “inside-out” component in the signaling mechanism. Thus, the presentation of the extracellular domains is likely to depend on the intracellular status of that region of the cell. In fact, at least one of the GTPases, Rac1, is thought to be involved in receptor localization (19).
Plexin-B1 is expressed ubiquitously in the neuronal cell (49) and is likely to encounter Semaphorin4D ligand at multiple locations of the cell surface. Nevertheless, the repulsive response of plexins to semaphorins is typically localized to the growth cone. Because this region contains a high concentration of Rho GTPases (47, 48) our model may go further. It implies that the receptor function could be highly sensitive to the status of its cellular locale, related to the presence and activity of Rho GTPases. A cell front that has come to rest or has formed intercellular contacts would have a much reduced population of active GTPases. This makes sense, because it would not be appropriate for the plexin receptors in such a region to bind and to deplete semaphorin guidance cues in competition with other targets. The bidirectional signaling ensures that only cells that are engaged in motility, which itself is associated with the presence of certain active Rho family GTPases, can alter, if not reverse, their direction of movement. Imaging studies on collapsing growth cones are needed to confirm these predictions at the cellular level. If they are true, several cellular features of this system can be rationalized by the multifunctional role of the direct plexin-Rho GTPase interaction, as outlined above, revealing a remarkable molecular economy in the cell signaling mechanism.
Concluding Summary
Several possible functional roles of the RBD of human plexin-B1 have been addressed by a joint structural characterization employing x-ray crystallography and solution NMR spectroscopy. The x-ray structure confirmed that the RBD has a ubiquitin fold and is dimerized through a long loop. NMR surface mapping allowed us to localize the binding site that plexin-B1 uses to interact with three Rho family GTPases, Rac1, Rnd1, as well as with RhoD. Surprisingly, all three GTPases bind to the same surface of the RBD fold. This novel GTPase binding interface includes two conserved sequence motifs (PRAMs) that appear to be specific to plexins. We also find that the GTPase-binding site is adjacent to the RBD dimerization region and that association of the GTPases destabilizes the RBD homodimer in solution. The observations suggest a model in which receptor-Rho GTPase interactions promote changes in plexin dimerization. This conformational change sets up a mechanism for bi-directional signaling that is likely to play a central, multifunctional role in the mechanism of receptor activation.
Supplementary Material
Supplemental Material can be found at: http://www.jbc.org/cgi/content/full/M703800200/DC1
Acknowledgments
We thank Drs. Manabu Negishi of Kyoto University and Luca Tamagnone of Torino University for plasmids and for critical comments on the manuscript. We thank Dr. Declan Doyle and the members of the Structural Genomics Consortium, (Oxford, UK), for the RhoD clone. We thank Drs. Lynn Landmesser and Witold Surewicz (Case Medical School), Dr. Andreas Püschel (University of Münster), and members of the Buck laboratory for insightful discussion. We also thank Sabine Bouguet-Bonnet, David Hughes, Lisa Placanica, and Xi’an Mao for technical help. Crystallographic data shown in this report were derived from work performed at Argonne National Laboratory, Structural Biology Center, beam line 19ID, at the Advanced Photon Source. Data collection at GM/CA CAT, beam line 23ID-B, has been funded by NCI Grant Y1-CO-1020 and NIGM Grant Y1-GM-1104 from the National Institutes of Health. Use of the Advanced Photon Source was supported by the United States Department of Energy, Office of Science, Office of Basic Energy Sciences, under Contract DE-AC02–06CH11357.
Footnotes
This work was supported in part by the Structural Genomics Consortium, a registered charity (number 1097737) that receives funds from the Canadian Institutes for Health Research, the Canadian Foundation for Innovation, Genome Canada through the Ontario Genomics Institute, Glaxo-SmithKline, Karolinska Institutet, The Knut and Alice Wallenberg Foundation, the Ontario Innovation Trust, the Ontario Ministry for Research and Innovation, Merck, the Novartis Research Foundation, the Swedish Agency for Innovation Systems, the Swedish Foundation for Strategic Research, and the Wellcome Trust.
The on-line version of this article (available at http://www.jbc.org) contains supplemental Figs. S1–S4.
The atomic coordinates and structure factors (code 2r2o) have been deposited in the Protein Data Bank, Research Collaboratory for Structural Bioinformatics, Rutgers University, New Brunswick, NJ (http://www.rcsb.org/).
The abbreviations used are: GAP, GTPase-activating protein; RBD, Rho GTPase binding domain; CRIB, Cdc42/Rac interactive binding; HSQC, heteronuclear single quantum coherence; ITC, isothermal titration calorimetry; TROSY, transverse relaxation optimized spectroscopy; GMPPNP, guanosine-5′-[(β,γ)-imido]triphosphate; MTSL, (1-oxyl-2,2,5,5-tetramethyl-3-pyrroline-3-methyl)methanesulfonate.
References
- 1.Negishi M, Oinuma I, Katoh H. Cell Mol Life Sci. 2005;62:1363–1371. doi: 10.1007/s00018-005-5018-2. [DOI] [PMC free article] [PubMed] [Google Scholar]
- 2.Patel BN, Van Vactor DL. Curr Opin Cell Biol. 2002;14:221–229. doi: 10.1016/s0955-0674(02)00308-3. [DOI] [PubMed] [Google Scholar]
- 3.Artigiani S, Comoglio PM, Tamagnone L. IUBMB Life. 1999;48:477–482. doi: 10.1080/713803563. [DOI] [PubMed] [Google Scholar]
- 4.Toyofuku T, Zhang H, Kumanogoh A, Takegahara N, Suto F, Kamei J, Aoki K, Yabuki M, Hori M, Fujisawa H, Kikutani H. Genes Dev. 2004;18:435–447. doi: 10.1101/gad.1167304. [DOI] [PMC free article] [PubMed] [Google Scholar]
- 5.Gitler AD, Lu MM, Epstein JA. Dev Cell. 2004;7:107–116. doi: 10.1016/j.devcel.2004.06.002. [DOI] [PubMed] [Google Scholar]
- 6.Serini G, Valdembri D, Zanivan S, Morterra G, Burkhardt C, Caccavari F, Zammataro L, Primo L, Tamagnone L, Logan M, Tessier-Lavigne M, Taniguchi M, Puschel AW, Bussolino F. Nature. 2003;424:391–397. doi: 10.1038/nature01784. [DOI] [PubMed] [Google Scholar]
- 7.Basile JR, Barac A, Zhu T, Guan KL, Gutkind JS. Cancer Res. 2004;64:5212–5224. doi: 10.1158/0008-5472.CAN-04-0126. [DOI] [PubMed] [Google Scholar]
- 8.Torres-Vazquez J, Gitler AD, Fraser SD, Berk JD, Van NP, Fishman MC, Childs S, Epstein JA, Weinstein BM. Dev Cell. 2004;7:117–123. doi: 10.1016/j.devcel.2004.06.008. [DOI] [PubMed] [Google Scholar]
- 9.Giordano S, Corso S, Conrotto P, Artigiani S, Gilestro G, Barberis D, Tamagnone L, Comoglio PM. Nat Cell Biol. 2002;4:720–724. doi: 10.1038/ncb843. [DOI] [PubMed] [Google Scholar]
- 10.Wong AW, Brickey WJ, Taxman DJ, van Deventer HW, Reed W, Gao JX, Zheng P, Liu Y, Li P, Blum JS, McKinnon KP, Ting JP. Nat Immunol. 2003;4:891–898. doi: 10.1038/ni960. [DOI] [PubMed] [Google Scholar]
- 11.Tamagnone L, Artigiani S, Chen H, He Z, Ming GI, Song H, Chedotal A, Winberg ML, Goodman CS, Poo M, Tessier-Lavigne M, Comoglio PM. Cell. 1999;99:71–80. doi: 10.1016/s0092-8674(00)80063-x. [DOI] [PubMed] [Google Scholar]
- 12.Vikis HG, Li W, He Z, Guan KL. Proc Natl Acad Sci U S A. 2000;97:12457–12462. doi: 10.1073/pnas.220421797. [DOI] [PMC free article] [PubMed] [Google Scholar]
- 13.Driessens MH, Hu H, Nobes CD, Self A, Jordens I, Goodman CS, Hall A. Curr Biol. 2001;11:339–344. doi: 10.1016/s0960-9822(01)00092-6. [DOI] [PubMed] [Google Scholar]
- 14.Hu H, Marton TF, Goodman CS. Neuron. 2001;32:39–51. doi: 10.1016/s0896-6273(01)00453-6. [DOI] [PubMed] [Google Scholar]
- 15.Rohm B, Rahim B, Kleiber B, Hovatta I, Puschel AW. FEBS Lett. 2000;486:68–72. doi: 10.1016/s0014-5793(00)02240-7. [DOI] [PubMed] [Google Scholar]
- 16.Nobes CD, Hall A. J Cell Biol. 1999;144:1235–1244. doi: 10.1083/jcb.144.6.1235. [DOI] [PMC free article] [PubMed] [Google Scholar]
- 17.Zanata SM, Hovatta I, Rohm B, Puschel AW. J Neurosci. 2002;22:471–477. doi: 10.1523/JNEUROSCI.22-02-00471.2002. [DOI] [PMC free article] [PubMed] [Google Scholar]
- 18.Ridley AJ. Trends Cell Biol. 2006;16:522–529. doi: 10.1016/j.tcb.2006.08.006. [DOI] [PubMed] [Google Scholar]
- 19.Vikis HG, Li W, Guan KL. Genes Dev. 2002;16:836–845. doi: 10.1101/gad.966402. [DOI] [PMC free article] [PubMed] [Google Scholar]
- 20.Oinuma I, Ishikawa Y, Katoh H, Negishi M. Science. 2004;305:862–865. doi: 10.1126/science.1097545. [DOI] [PubMed] [Google Scholar]
- 21.Oinuma I, Katoh H, Negishi M. J Neurosci. 2004;24:11473–11480. doi: 10.1523/JNEUROSCI.3257-04.2004. [DOI] [PMC free article] [PubMed] [Google Scholar]
- 22.Swiercz JM, Kuner R, Offermanns S. J Cell Biol. 2004;165:869–880. doi: 10.1083/jcb.200312094. [DOI] [PMC free article] [PubMed] [Google Scholar]
- 23.Oinuma I, Katoh H, Harada A, Negishi M. J Biol Chem. 2003;278:25671–25677. doi: 10.1074/jbc.M303047200. [DOI] [PubMed] [Google Scholar]
- 24.Kruger RP, Aurandt J, Guan KL. Nat Rev Mol Cell Biol. 2005;6:789–800. doi: 10.1038/nrm1740. [DOI] [PubMed] [Google Scholar]
- 25.Turner LJ, Nicholls S, Hall A. J Biol Chem. 2004;279:33199–33205. doi: 10.1074/jbc.M402943200. [DOI] [PubMed] [Google Scholar]
- 26.Tong Y, Buck M. J Biomol NMR. 2005;31:369–370. doi: 10.1007/s10858-005-0943-9. [DOI] [PMC free article] [PubMed] [Google Scholar]
- 27.Bouguet-Bonnet S, Buck M. J Biomol NMR. 2006;36:51. doi: 10.1007/s10858-006-9029-6. [DOI] [PMC free article] [PubMed] [Google Scholar]
- 28.Tong YF, Hughes D, Placanica L, Buck M. Structure (Camb) 2005;13:7–15. doi: 10.1016/j.str.2004.10.018. [DOI] [PMC free article] [PubMed] [Google Scholar]
- 29.Wang BC. Methods Enzymol. 1985;115:90–112. doi: 10.1016/0076-6879(85)15009-3. [DOI] [PubMed] [Google Scholar]
- 30.Schneider TR. Acta Crystallogr Sect D Biol Crystallogr. 2002;58:195–208. doi: 10.1107/s0907444901019291. [DOI] [PubMed] [Google Scholar]
- 31.Terwilliger TC. Methods Enzymol. 2003;374:22–37. doi: 10.1016/S0076-6879(03)74002-6. [DOI] [PubMed] [Google Scholar]
- 32.Murshudov GN, Vagin AA, Dodson EJ. Acta Crystallogr Sect D Biol Crystallogr. 1997;53:240–255. doi: 10.1107/S0907444996012255. [DOI] [PubMed] [Google Scholar]
- 33.Davis IW, Murray LW, Richardson JS, Richardson DC. Nucleic Acids Res. 2004;32:W615–W619. doi: 10.1093/nar/gkh398. [DOI] [PMC free article] [PubMed] [Google Scholar]
- 34.Emsley P, Cowtan K. Acta Crystallogr Sect D Biol Crystallogr. 2004;60:2126–2132. doi: 10.1107/S0907444904019158. [DOI] [PubMed] [Google Scholar]
- 35.Takahashi H, Nakanishi T, Kami K, Arata Y, Shimada I. Nat Struct Biol. 2000;7:220–223. doi: 10.1038/73331. [DOI] [PubMed] [Google Scholar]
- 36.Shimada I. Methods Enzymol. 2005;394:483–506. doi: 10.1016/S0076-6879(05)94020-2. [DOI] [PubMed] [Google Scholar]
- 37.Battiste JL, Wagner G. Biochemistry. 2000;39:5355–5365. doi: 10.1021/bi000060h. [DOI] [PubMed] [Google Scholar]
- 38.Holm L, Park J. Bioinformatics (Oxf) 2000;16:566–567. doi: 10.1093/bioinformatics/16.6.566. [DOI] [PubMed] [Google Scholar]
- 39.Burbelo PD, Drechsel D, Hall A. J Biol Chem. 1995;270:29071–29074. doi: 10.1074/jbc.270.49.29071. [DOI] [PubMed] [Google Scholar]
- 40.Buck M, Xu W, Rosen MK. J Mol Biol. 2004;338:271–285. doi: 10.1016/j.jmb.2004.02.036. [DOI] [PubMed] [Google Scholar]
- 41.Wennerberg K, Forget MA, Ellerbroek SM, Arthur WT, Burridge K, Settleman J, Der CJ, Hansen SH. Curr Biol. 2003;13:1106–1115. doi: 10.1016/s0960-9822(03)00418-4. [DOI] [PMC free article] [PubMed] [Google Scholar]
- 42.Tsubakimoto K, Matsumoto K, Abe H, Ishii J, Amano M, Kaibuchi K, Endo T. Oncogene. 1999;18:2431–2440. doi: 10.1038/sj.onc.1202604. [DOI] [PubMed] [Google Scholar]
- 43.Murphy C, Saffrich R, Olivo-Marin JC, Giner A, Ansorge W, Fotsis T, Zerial M. Eur J Cell Biol. 2001;80:391–398. doi: 10.1078/0171-9335-00173. [DOI] [PubMed] [Google Scholar]
- 44.Fournier AE, Nakamura F, Kawamoto S, Goshima Y, Kalb RG, Strittmatter SM. J Cell Biol. 2000;149:411–422. doi: 10.1083/jcb.149.2.411. [DOI] [PMC free article] [PubMed] [Google Scholar]
- 45.Love CA, Harlos K, Mavaddat N, Davis SJ, Stuart DI, Jones EY, Esnouf RM. Nat Struct Biol. 2003;10:843–848. doi: 10.1038/nsb977. [DOI] [PubMed] [Google Scholar]
- 46.Antipenko A, Himanen JP, van Leyen K, Nardi-Dei V, Lesniak J, Barton WA, Rajashankar KR, Lu M, Hoemme C, Puschel AW, Nikolov DB. Neuron. 2003;39:589–598. doi: 10.1016/s0896-6273(03)00502-6. [DOI] [PubMed] [Google Scholar]
- 47.Takahashi T, Strittmatter SM. Neuron. 2001;29:429–439. doi: 10.1016/s0896-6273(01)00216-1. [DOI] [PubMed] [Google Scholar]
- 48.Aspenstrom P, Fransson A, Saras J. Biochem J. 2004;377:327–337. doi: 10.1042/BJ20031041. [DOI] [PMC free article] [PubMed] [Google Scholar]
- 49.Swiercz JM, Kuner R, Behrens J, Offermanns S. Neuron. 2002;35:51–63. doi: 10.1016/s0896-6273(02)00750-x. [DOI] [PubMed] [Google Scholar]
- 50.Lovell SC, Davis IW, Arendall WB, III, de Bakker PI, Word JM, Prisant MG, Richardson JS, Richardson DC. Proteins. 2003;50:437–450. doi: 10.1002/prot.10286. [DOI] [PubMed] [Google Scholar]
Associated Data
This section collects any data citations, data availability statements, or supplementary materials included in this article.
Supplementary Materials
Supplemental Material can be found at: http://www.jbc.org/cgi/content/full/M703800200/DC1