Abstract
The first full single-photon emission computed tomography (SPECT) imager to exploit eight compact high-intrinsic-resolution cadmium zinc telluride (CZT) detectors, called SemiSPECT, has been completed. Each detector consists of a CZT crystal and a customized application-specific integrated circuit (ASIC). The CZT crystal is a 2.7 cm × 2.7 cm × ~ 0.2 cm slab with a continuous top electrode and a bottom electrode patterned into a 64 × 64 pixel array by photolithography. The ASIC is attached to the bottom of the CZT crystal by indium-bump bonding. A bias voltage of −180 V is applied to the continuous electrode. The eight detectors are arranged in an octagonal lead-shielded ring. Each pinhole in the eight-pinhole aperture placed at the center of the ring is matched to each individual detector array. An object is imaged onto each detector through a pinhole, and each detector is operated independently with list-mode acquisition. The imaging subject can be rotated about a vertical axis to obtain additional angular projections. The performance of SemiSPECT was characterized using 99mTc. When a 0.5 mm diameter pinhole is used, the spatial resolution on each axis is about 1.4 mm as estimated by the Fourier crosstalk matrix, which provides an algorithm-independent average resolution over the field of view. The energy resolution achieved by summing neighboring pixel signals in a 3 × 3 window is about 10% full-width-at-half-maximum of the photopeak. The overall system sensitivity is about 0.5 × 10⁻⁴ with the energy window of ±10% from the photopeak. Line-phantom images are presented to visualize the spatial resolution provided by SemiSPECT, and images of bone, myocardium, and human tumor xenografts in mice demonstrate the feasibility of preclinical small-animal studies with SemiSPECT.
Keywords: single-photon emission computed tomography (SPECT), cadmium zinc telluride (CZT), small-animal imaging
I. INTRODUCTION
Noninvasive imaging techniques play an important role in animal research and permit in vivo longitudinal studies of biochemical, genetic, and pharmacological processes. Higher spatial resolution is necessary for small-animal imaging than for human imaging to achieve a level of anatomic detail that is comparable to the human studies, and dedicated small-animal imaging systems are being developed in several modalities. SPECT and PET imaging are of particular interest because of their unique ability to image trace amounts of important biomarkers. Experimental small-animal systems have been developed for both SPECT and PET,1–19 and several of these have been commercialized.6,10,12,15,17,19
In spite of the requirement for higher spatial resolution, most small-animal SPECT systems have been based on the same detector technologies used for clinical systems, with comparable intrinsic resolution. This limitation can be over-come by using pinhole imaging with high magnification, and excellent images are being obtained with systems based on one to three clinical scintillation cameras.10,15,16 Nevertheless, more compact systems with superior performance should result if large numbers of detectors with higher intrinsic resolution can be used.18
One promising technology for improving intrinsic resolution in SPECT is detector arrays based on wide-bandgap semiconductors such as cadmium telluride and cadmium zinc telluride (CZT). Numerous groups have experimented with CZT arrays with pixel sizes of 2 to 3 mm,19,20 but our group at the Center for Gamma-ray Imaging has been using arrays with pixels an order of magnitude smaller. Experimental CZT detectors with pixels as small as 125 µm have been fabricated and tested,21 but most of our emphasis has been on 64 × 64 arrays with 380 µm square pixels.22
A single such detector was first used several years ago in a prototype SPECT system,23 later converted to a dual modality CT/SPECT system.14 However, such a single-head SPECT system suffers from low sensitivity and requires a large number of object rotations for tomographic reconstruction.
As a step towards realizing the full potential of high-resolution CZT detectors, this paper reports initial results on a tabletop SPECT system using eight of our 64 × 64 arrays. The instrumentation is described in Sec. II, the methods used for system characterization and imaging studies are described in Sec. III, and results are presented in Sec. IV. In Sec. V, we summarize the current status of this development and discuss potential future directions.
II. SYSTEM DESCRIPTION
A. CZT gamma-ray detector
The gamma-ray detector used in SemiSPECT is a combination of a 2.7 cm × 2.7 cm × ~0.2 cm slab of CZT crystal and a custom-designed read-out application-specific integrated circuit (ASIC).24 The photoelectric stopping efficiency of the 2 mm thick CZT detector is about 40% for 140 keV gamma-rays. A thicker detector would increase photon-stopping efficiency but lead to more hole trapping and lower photopeak efficiency. In addition, since the photons passing through the pinhole strike the periphery of the detector at an angle of about 26° from the normal, there would be a loss of spatial resolution with a thicker detector unless the depth of interaction was estimated and accounted for in the reconstruction algorithm. Although we have successfully demonstrated depth-of-interaction estimation in 2 mm thick CZT detectors,25 we decided to forego this approach for initial studies.
The CZT crystal has a continuous electrode on the entrance side, and on the readout side the electrode is partitioned into a 64 × 64 pixel array by photolithography. When a gamma ray is absorbed in the CZT crystal, many electron-hole pairs are produced, and the electrons and holes separate and move in opposite directions in response to an externally applied bias voltage (−180 V) on the continuous electrode. The movement of the charge carriers induces currents in nearby pixel electrodes. The ASIC includes an array of read-out unit cells, each cold-welded onto an individual pixel electrode by indium-bump bonding. The current induced on the pixel electrode is integrated in the readout unit cell and then transferred as a voltage to external electronics in a raster scan pattern by multiplexer circuitry operating at a frequency of ~4 MHz. The entire array is read out at a ~1 kHz frame rate. The detector/ASIC assembly, which we call a hybrid, is mounted on the top surface of a daughter board that provides an electrical interface between the ASIC and external electronics. A cooling system permits operation of the CZT detectors at a low and constant temperature, usually in the range from 10° to −10 °C, in order to reduce leakage current and to remove heat generated by the ASIC. In this study, operating temperature on each detector was maintained at 5±0.05 °C.
B. List-mode data acquisition
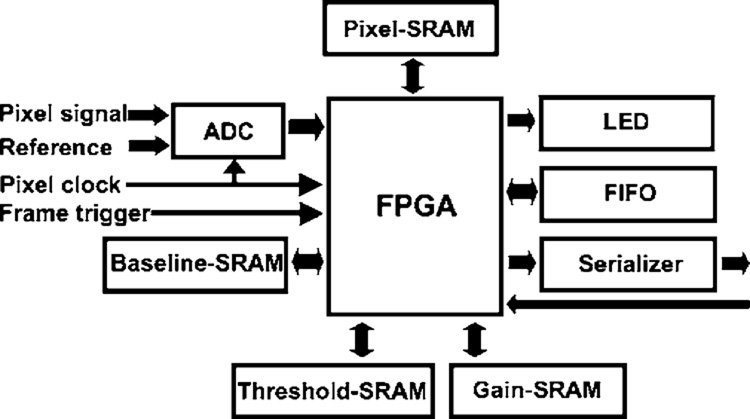
List-mode data acquisition is necessary with these detectors for accurate photon-energy estimation. SemiSPECT includes eight front-end boards that accomplish list-mode data acquisition from each of the eight detectors. The block diagram of the front-end board is shown in Fig. 1. Each front-end board, controlled by a field-programmable gate array (FPGA), employs four static-random-access-memory (SRAM) buffers to hold baseline values, gain values, thresh-old values, and several raster lines worth of raw pixel values. The event-detection algorithm is implemented in a pipelined architecture in the FPGA and works on 3 by 3 pixel neigh-borhoods at a time. Nine net signals, raw pixel values with their respective baseline values subtracted, are summed and compared against a threshold determined from sample frames of event-free data. If the sum exceeds the threshold, and the central pixel contains the largest signal, an event packet is assembled and transmitted to a back-end list-mode buffer. Gain values of zero are used to suppress malfunctioning pixels. Recording event packets with net signals of the eight nearest neighboring pixels together with the hit pixel allows virtually all of the signals that might be distributed across pixels to be recovered.
FIG. 1.
Block diagram of a list-mode data acquisition board.
C. Mechanical structure
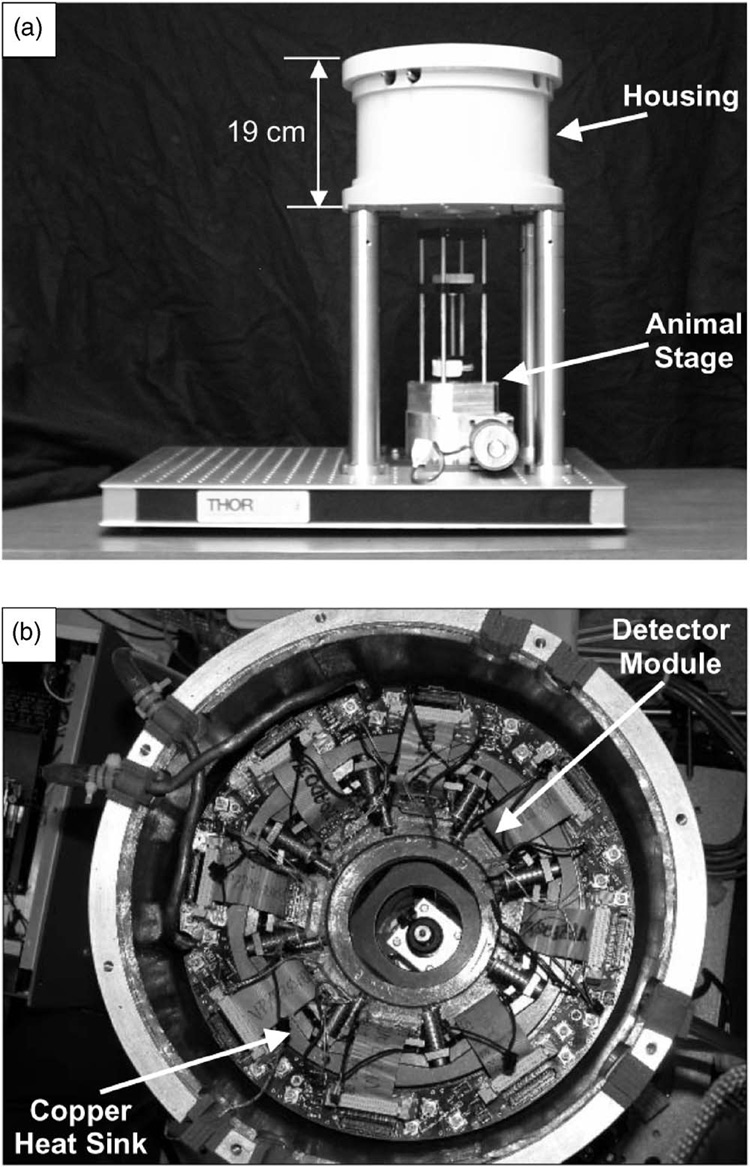
The system gantry of SemiSPECT is shown in Fig. 2. SemiSPECT is composed of four main sub-systems: The cooling system, an eight-pinhole aperture cylinder, a shielded housing, and an automated animal stage. The eight detector modules are arranged on an octagonal heat sink made of copper. A thermoelectric cooler (TEC) is attached to the bottom of each detector module and transfers heat from the detector to the heat sink; the heat deposited in the heat sink is removed by coolant circulating through an external chiller. The eight-pinhole aperture cylinder with 64.7 mm diameter (pinhole-isocenter distance) was formed by casting Cerrobend alloy, composed of lead (26.7%), bismuth (50%), cadmium (10%), and tin (13.3%), into an aluminum form, providing a cylindrical field of view of 32.0 mm diameter × 32.0 mm height with 0.8 magnification at the center of the field of view. The thickness of the Cerrobend alloy is 6.4 mm, and its stopping efficiency for 140 keV photons is 99.9995%. Because pinhole apertures cannot be precisely machined in the Cerrobend, eight small gold disks with 0.5 mm pinholes were created and inserted into milled recesses. The aperture and inserts are both exchangeable to vary system characteristics.
FIG. 2.
Photographs of outside (a) and inside (b) views of SemiSPECT.
The system housing is shielded with a laminated lead layer. The housing provides protection for the detector modules and a controlled dry-nitrogen atmosphere to prevent condensation on them. In order to prevent asphyxiation of an animal from the nitrogen gas, all pinholes were sealed with transparent tape. The animal is imaged in an upright (vertical) position. The automated animal stage includes an acrylic tube placed atop two motion-positioning systems: A vertical translation system and a rotation system. The travel distance of vertical translation is 12.7 cm with a resolution of 0.0016 cm, and the rotary stage has an angular resolution of 0.025°.
III. METHODS
A. System-matrix measurement
The system matrix of a SPECT imager provides information on system sensitivity and spatial resolution, and it is also used in tomographic reconstruction. The system matrix can be simulated from the geometry of the system or measured by moving a point source to all locations of a three-dimensional (3D) grid in object space. We measured the system matrix of SemiSPECT in order to incorporate the non-uniform responses of the CZT detectors and imperfections of the system. Chromatographic beads 300 µm in diameter (Bio-Rad Laboratories, Hercules, CA) were soaked in an aqueous solution of 99mTc and dried, and then they were massed at the tip of a capillary tube using epoxy to make about a 370 MBq point source with about 1 mm diameter. Three translation stages were employed to move the source to each grid point and hold it for image acquisition. The system matrix contained 23 680 grid points with 1 mm stepping increment in each direction. The acquisition time for the first step was 100 ms, and it was prolonged according to the decay of the object radioactivity. The total acquisition time for the system matrix measurement was approximately 13 h. This measured system matrix was used to generate the sensitivity map.
The stepping increment could be shortened to reduce the voxel size of reconstructed images, but the acquisition time per step would have to be reduced too in order to maintain the total acquisition time within an appropriate temporal range. Instead the system matrix was linearly interpolated. We assumed that each point-source measurement has a Gaussian spatial distribution, and its position, maximum signal, and standard deviation were extracted. Then those three parameters for two successive measurements were averaged, creating a point-source response between them. The interpolated system matrix included 180 698 grid points with 0.5 mm stepping increment, and it was used for image reconstruction. Since all SPECT images were reconstructed with 64 projection views, this system matrix was interpolated to those angular views as well. For the spatial-resolution estimation, the 1 mm grid system matrix interpolated to the 64 angular views was used.
B. Spatial resolution
Spatial resolution of an imaging system is intended as a summary measure of the shape and width of the point spread function (PSF), but any such measure runs into difficulties unless the system is linear and shift invariant. Tomographic systems are never truly shift-invariant for several reasons, and they may not even be linear when the reconstruction algorithm is considered.
Like any other digital imaging system, a tomographic system is a continuous-to-discrete (CD) mapping,26 which means that it maps an object, defined as a function of continuous position coordinates, to a digital reconstruction, de-fined on a discrete voxel grid. If the system is linear, a PSF can be defined, but it is a function of one continuous variable and one discrete index, and width measures based on the continuous variable do not necessarily agree with those based on the voxel index. Moreover, the width in voxel units of a point image is almost arbitrarily sensitive to the size of the voxel chosen, the reconstruction algorithm and the noise in the data. With linear algorithms and accurate knowledge of the geometric properties of the system, very compact point images can be obtained just by using small voxels and an inverse filter; resolution specified this way is more a function of the noise level in the point image than the deterministic properties supposedly described by a PSF.
The situation is even worse with nonlinear reconstruction algorithms such as maximum likelihood-expectation maximization (ML-EM), which is well known for its ability to drive point images to point reconstructions even with relatively poor signal-to-noise ratio (SNR) in the data. Virtually any measure of resolution is meaningless with nonlinear re-construction algorithms, but the use of such algorithms is essential to obtaining good results with complicated multi-pinhole imagers like SemiSPECT. Even if we consider only linear algorithms and systems and ignore the discretization issues, the PSF is a function of position in the field of view, it is anisotropic (different widths in different directions), and the resolution reported can be strongly influenced by the criterion used to define width (e.g., full width at half maximum versus one-tenth maximum).
The best way around these difficulties is to use clinically relevant, task-based measures of image quality26–28 rather than summary measures like resolution and SNR, but nevertheless a shorthand way of comparing the deterministic properties of different systems is useful. The approach presented here is based on a concept called the Fourier crosstalk matrix,28 which is an exact description of any linear CD system and makes no attempt to force the system into a shift-invariant mold. The crosstalk matrix fully describes all deterministic properties of a CD system, including sampling and aliasing issues, and it provides a summary measure of resolution of the hardware alone, averaged over the field of view of the system. The basic mathematics of the Fourier crosstalk matrix and its relation to objective measures of image quality have been presented previously28–30 and are reviewed in the Appendix.
In the Appendix, we present and justify a definition of equivalent modulation transfer function (MTF), based on diagonal elements of the Fourier crosstalk matrix. As seen in Eq. (A11), this quantity is based on the detector sensitivity function hm(r), which is the basic characterization of a CD system. This function is not known exactly, but if the point-like source used to map the system matrix is small enough, then the matrix element Hmn is approximately hm(r) sampled at the location of the nth voxel, and the equivalent MTF (MTFeq) can be computed by approximating the continuous Fourier integral in (A11) with a 3D discrete Fourier transform of the system matrix.31
Given the MTF of an imaging system, it is useful to convert it to a single-number characterization of system resolution. If the system is at least approximately shift-invariant, the conversion can be done by Fourier-transforming the MTF back to the space domain and computing, say, the full width at half-maximum (FWHM) of the resulting point-spread function. For weak shift-variance, it might be valid to consider local MTFs and local Fourier transforms to obtain resolution as a function of position within the field of view. A better approach, however, would be to directly measure the space-variant PSF and invent some measure of width in the image.26
Neither local Fourier transforms nor local PSFs are applicable with the Fourier crosstalk approach, which inherently is a measure of response of the system to a Fourier component that fills the field of view. The width of the , defined by its FWHM, is a direct measure of the response of the system hardware to such Fourier components, at least after incorporation of a ramp filter as needed in all tomographic systems.
The resulting width is, of course, in spatial-frequency units, and most workers in the field will be more familiar with resolution expressed in spatial units. Therefore, we convert the MTFeq back to the space domain by using formulas that are really valid only for shift-invariant systems (though they are used much more widely). Specifically, as we shall see below, we note that the MTFeq turns out to have an approximately Gaussian form, so its Fourier transform is also approximately Gaussian, and we take the FWHM of the resulting space-domain function as a measure of resolution. This number cannot be interpreted as the width of a PSF, but it can be used to compare tomographic systems.
To be explicit, if we assume that the MTFeq is Gaussian, we can define the 3D spatial resolution of the system as the full-width-at-half-maximum of the Fourier transform of MTFeq along the three axes. A Gaussian-distributed MTFeq along the j axis can be written as
| (1) |
and its Fourier transform as
| (2) |
The full-width-at-half-maximum of MTFeq(j) in Eq. (1) is , and that of F{MTFeq(j)} in Eq. (2) is . Therefore, the spatial resolution of the system along the j axis is given by
| (3) |
where FWHM[t(x)] gives the full-width-at-half-maximum of a function t(x).
C. Energy resolution
Good energy resolution is necessary to remove events where the photons have undergone Compton scattering and to enable multiple-isotope imaging. The easiest way to estimate the energy of a gamma ray interacting in the detector is to check the signal from a single pixel. But the energy can be spread to the neighboring pixels due to charge diffusion and emission of K x rays, so we need to include the spread of the charges for better energy estimation.21 Since the energy spread of 140 keV gamma rays is usually confined to a 3 × 3 pixel region in our detectors,25 the nine signals of each 3 × 3 list-mode data array were scanned and any signal above a threshold was added to the sum. The threshold of each pixel was set to twice the standard deviation of the baseline value of the pixel.
A 99mTc cylindrical source with 40 mm diameter × 35 mm height was located at the center of the field of view, and about 10 000 events per pixel were acquired; the number of events per pixel was limited due to the restriction of memory space in the computer. In order to achieve better statistics, the energy spectra of multiple pixels were summed. Since gains can vary from one pixel to another, a gain map was calculated from the cylindrical-source image and used to adjust each spectrum prior to summing. However, the cylindrical source and system geometry resulted in too few counts in the periphery of the detectors to adequately calibrate gains for pixels in this region. So the pixels only in an 11 × 11 window located at the center region of a detector were used for the estimation of the energy resolution. Except for statistics, essentially the same spectrum was obtained if a smaller region was used, and other experiments with a true flood source and no pinhole aperture showed that similar spectra could be obtained over the entire detector area if small dysfunctional regions were excluded.32
D. Sensitivity
System sensitivity is a measure of how effective the system is in gathering the available photons. The sensitivity of SemiSPECT for a point source was measured, based on
| (4) |
In internal conversion, an alternative process to gamma-ray emission, an excited nucleus transfers its excitation energy to an orbital electron that is thereby ejected from the atom. The internal conversion rate for 99mTc is 0.1. A ~ 1 mm diameter point source of 99mTc (31 MBq) was placed at the center of the field of view of the system, and photon counts were collected for 300 s.
However, the sensitivity for a point source is variable according to its location. Therefore, it is necessary to estimate the system sensitivity by averaging the measured sensitivities in all 3D grids within the field of view. Since the sensitivity map formulated by
| (5) |
where Hnm indicates an element of the system matrix and M is the total number of detector elements, assesses the 3D uniformity of the system sensitivity, it was scaled to the measured value at the center and then averaged. The system sensitivities for three different energy windows (±10%, ±15%, and open windows) were obtained and compared.
E. Line-phantom and mouse imaging
All SPECT images were obtained using 64 projection views acquired with the energy window of ±10% from the photopeak (140 keV) and reconstructed using the ML-EM algorithm with 20 iterations. Acquisition time was prolonged according to the radioactivity decay. Volume rendering from tomographic reconstruction data was generated by AMIDE, a medical imaging analysis program (VA Software Corporation, Fremont, CA). For in vivo mouse myocardium and human-tumor xenograft imaging, anesthesia was induced and maintained with isoflurane gas, and animals were monitored continuously to allow the lowest anesthetic dose (typically 1–1.5%) to prevent movement. The acquisition time for the first set of eight projections in line phantom imaging was 1 min, whereas that in mouse imaging was 2 min.
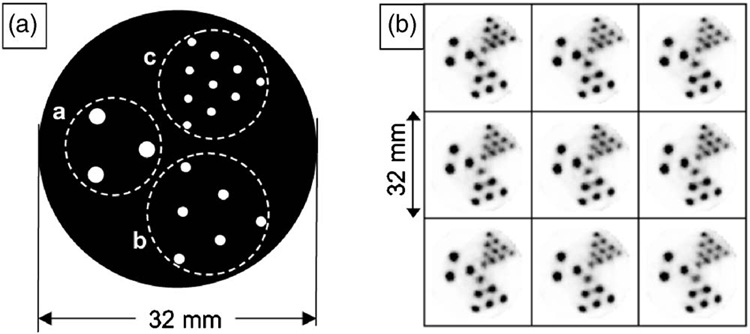
A line phantom was used to demonstrate spatial resolution in reconstructed images from SemiSPECT. The line phantom was made out of a plastic rod and contained three groups of holes arranged in equilateral-triangle patterns; group 1 included three holes with 2 mm diameter and 6 mm center-to-center distance, group 2 included 5 holes with 1.5 mm diameter and 4.5 mm center-to-center distance, and group 3 included 10 holes with 1 mm diameter and 3 mm center-to-center distance. An aqueous solution of 56 MBq of 99mTc-pertechnetate was used to fill the holes.
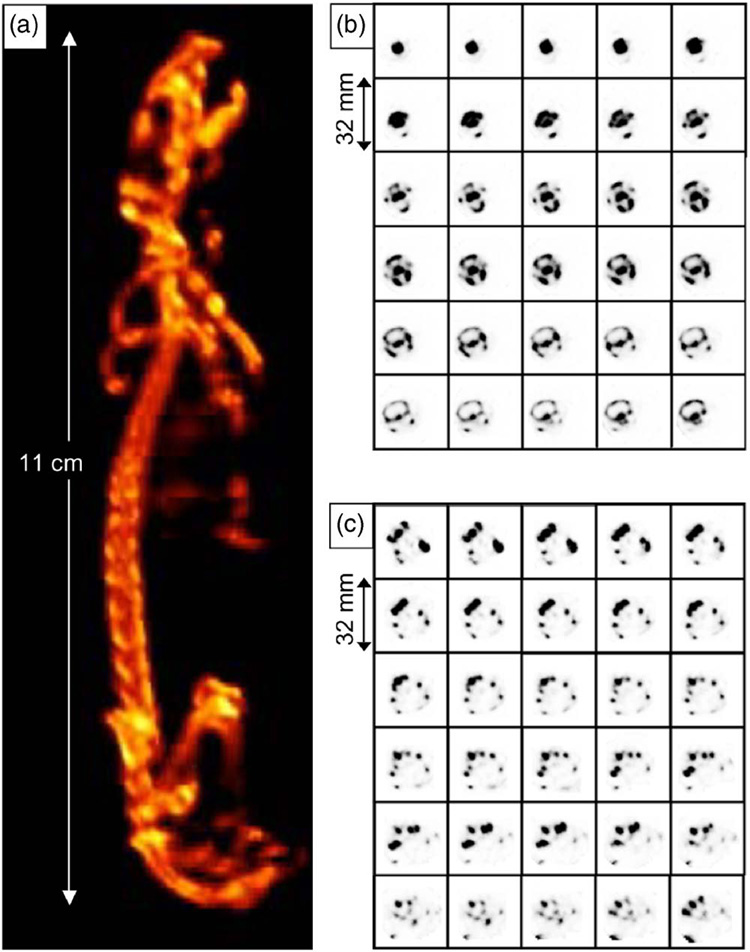
Bone scans show increased uptake of 99mTc-methylene diphosphonate (MDP) at sites of bone injury or disease. To perform bone imaging with SemiSPECT, a mouse was injected intravenously with 252 MBq of 99mTc-MDP in about 0.2 ml of solution and imaged approximately 2 h later. The mouse was euthanized by intraperitoneal injection of a lethal dose of barbiturate prior to imaging. Since the length of the mouse was 11 cm, the mouse was imaged in four adjacent longitudinal positions.
Cardiac imaging using 99mTc-methoxyisobutylisonitrile (MIBI) is used clinically to assess myocardial perfusion. 99mTc-MIBI was employed to obtain images of normal mouse myocardium. The mouse was injected intravenously with 163 MBq of 99mTc-MIBI in about 0.2 ml, and imaged approximately 3.5 h later.
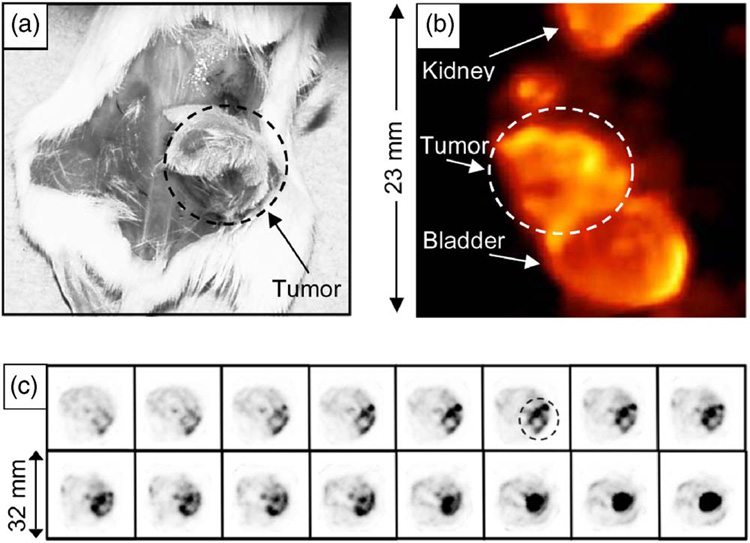
Mice bearing human tumor xenografts are widely used in studies of cancer biology and treatment. We demonstrated the feasibility of imaging such mouse tumor models with SemiSPECT. Human breast-cancer cells were implanted subcutaneously in the flank of a severe combined immunodeficient (SCID) mouse, and permitted to grow to form a 300 mm3 tumor. Then the mouse was injected intravenously with 233 MBq of 99mTc-glucarate (GLA) in about 0.15 ml and imaged approximately 6 h later.
IV. RESULTS
A. System-performance characterization
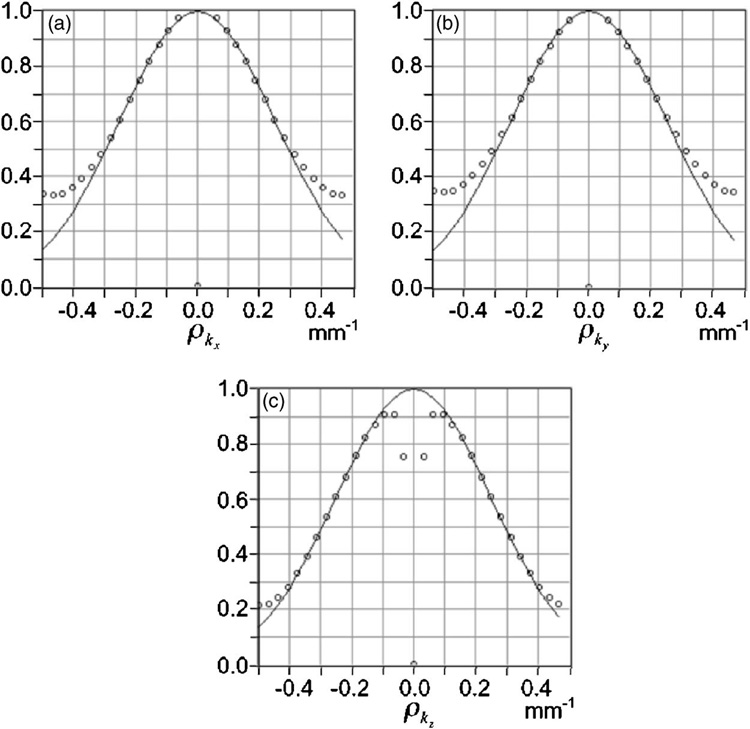
The spatial resolution of the acquisition hardware was computed with the Fourier crosstalk method as described above. For full details and plots of the crosstalk matrix, see Ref. 32; the resulting equivalent MTF is shown in Fig. 3. It is found that the linear spatial resolution along each axis is about 1.45 mm. As noted above, this number represents an average resolution over the field of view without considering the reconstruction algorithm. For comparison, the two-dimensional or planar resolution for a point at the center of the field of view was calculated from standard pinhole equations.33 An effective pinhole diameter of 0.77 mm was used to account for penetration,34,35 and the resulting planar resolution was 1.80 mm.
FIG. 3.
Normalized MTFeq of SemiSPECT along x (graph a), y (graph b), and z (graph c) axes, where the z axis is perpendicular to the circular slices of the cylindrical object space. On each graph, the dots represent the values of the MTFeq, and the line represents a Gaussian function closest to the MTFeq. The deviation from the Gaussian at high spatial frequencies is caused by using the discrete Fourier transform rather than the Fourier integral required in the definition.
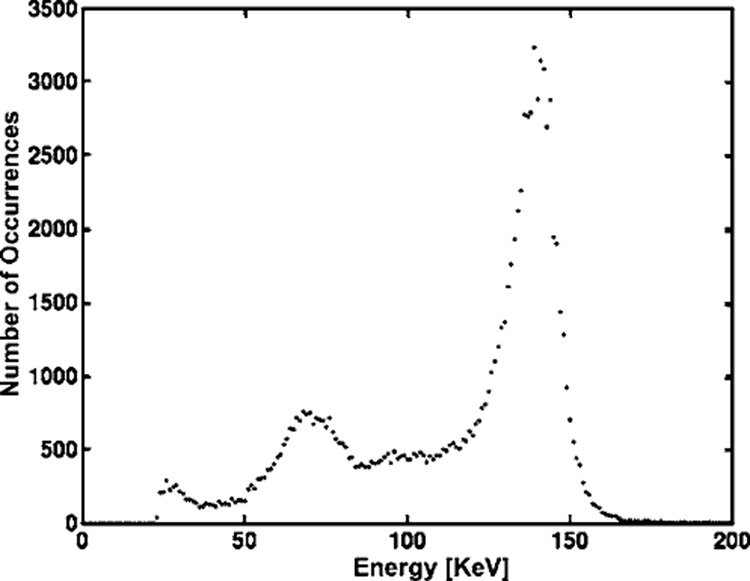
The energy spectrum is shown in Fig. 4. The bump near 70 keV is caused by K x rays created from the gold insert on the cylinder aperture or lead and bismuth contained in the Cerrobend of the cylinder aperture when gamma rays inter-acted in them.32 The full-width-at-half-maximum of the photopeak shows about 10% energy resolution. The partial charge collection, known as hole tailing, was greatly reduced by the small-pixel effect.36
FIG. 4.
99mTc energy spectrum for interactions in an 11 × 11 group of pixels at the center region of a detector; except for statistics, essentially the same spectrum is obtained if a larger or smaller region is used. The bump near 70 keV is caused by K x rays created from the gold insert on the cylinder aperture or lead and bismuth contained in the Cerrobend of the cylinder aperture when gamma rays interacted in them. The energy resolution is about 10% as measured by full-width-at-half-maximum of the photopeak (140 keV).
The measured sensitivity for a point source placed at the center of the field of view was 1.53 × 10⁻⁴ with open energy window (30–200 keV), but it was reduced to 0.87 × 10⁻⁴ and 0.77 × 10⁻⁴, respectively, when energy windows of ±15% and ±10% from the photopeak (140 keV) were applied. For comparison, the geometric collection efficiency, computed with the 0.77 mm effective pinhole diameter, is 2.83 × 10⁻⁴, indicating an average detector absorption efficiency of about 54% with about 57% of the absorbed photons falling within the ±15% window. The overall photopeak efficiency is thus about 31% for that window.
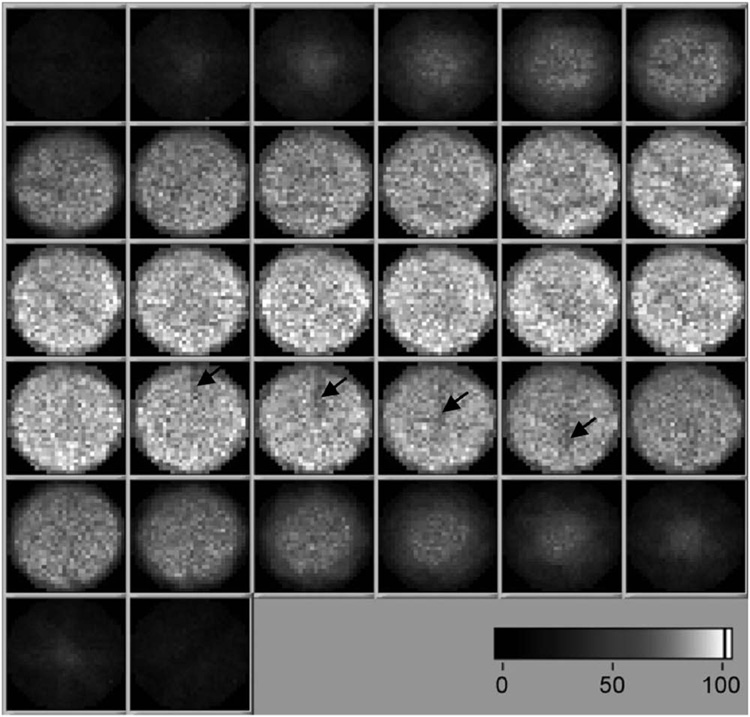
The sensitivity map of SemiSPECT, shown in Fig. 5, depicts the relative variation of sensitivity over the field of view. The straight dark lines indicated by black arrows were caused by detector regions having less sensitivity. When the sensitivity map was scaled to the measured value at the center, the averaged sensitivities were 0.54 × 10⁻⁴, 0.61 × 10⁻⁴, and 1.07 × 10⁻⁴, respectively, with ±10%, ±15%, and open energy windows.
FIG. 5.
Sensitivity map (32 × 32 × 32) of SemiSPECT. The straight dark lines indicated by black arrows were caused by detector regions having less sensitivity.
B. Line-phantom and mouse images
The geometry of the line phantom is shown in Fig. 6(a), and the reconstructed images of it are presented in Fig. 6(b). The separation between neighboring slices is 0.5 mm. All of the holes are well resolved, consistent with the resolution estimated in the previous subsection.
FIG. 6.
Diagram (a) shows the geometry of a line phantom; group (a) includes three holes with 2 mm diameter and 6 mm center-to-center distance, group (b) includes 5 holes with 1.5 mm diameter and 4.5 mm center-to-center distance, and group (c) includes 10 holes with 1 mm diameter and 3 mm center-to-center distance. The SPECT images of the line phantom are presented in (b) with 0.5 mm separation between neighboring slices.
Figure 7 shows volume-rendered images of a mouse skeleton. Anatomic details such as the optic canal, zygomatic bone, and mandible are evident in Fig. 7(b), and individual bones of the pelvis are evident in Fig. 7(c). Figure 8 presents volume-rendered images of mouse myocardium using 99mTc-MIBI. Figure 9 shows images of a mouse bearing a human breast-cancer xenograft using 99mTc-GLA.
FIG. 7.
Volume rendering (a) from the SPECT images of a whole mouse skeleton and consecutive transaxial SPECT images of (bB) the mouse cranium from incisive bone to occipital squama, and (c) the mouse pelvic bone from ilium to ischiac bone with 0.5 mm separation between slices. 99mTc-MDP was used as the bone imaging agent.
FIG. 8.
(a) Volume rendering from the SPECT images of a mouse myocardium, and (b) consecutive transaxial SPECT slices of it with 0.5 mm separation between slices. 99mTc-MIBI was used as the imaging agent.
FIG. 9.
(a) Photograph of a mouse bearing a 300 mm3 human-breast-tumor xenograft, (b) volume rendering from the SPECT images of it, and (c) consecutive transaxial SPECT images of the tumor indicated by a black dotted circle with 0.5 mm separation between slices. 99mTc-glucarate was used as the tumor imaging agent.
V. DISCUSSION AND SUMMARY
We have successfully integrated eight high-resolution CZT arrays into a tabletop small-animal SPECT system called SemiSPECT. Initial animal and phantom studies show no significant artifacts and are consistent with the expected system resolution and sensitivity. More detailed animal studies are already underway.
As with any pinhole imaging system, there is considerable freedom in trading off sensitivity, spatial resolution and field of view in SemiSPECT. Two interchangeable aperture cylinders have been built, and each allows interchange of the pinhole inserts themselves, so the numbers presented in Sec. IV A represent only the configuration chosen for initial evaluation.
Perhaps the most significant result from this paper is that it demonstrates the technological feasibility of operating multiple CZT detector arrays together in a practical SPECT imager. Reaching this point required solving problems in the electronics, the mechanical assembly and the temperature stabilization. The list-mode acquisition architecture was especially valuable since it allowed recording the signals from contiguous 3 × 3 arrays of pixels associated with a single gamma-ray event; without this feature useful energy resolution cannot be obtained with the small pixels we use.
Numerous upgrade paths exist for enhancing the performance of the system further. The mechanical housing was designed for easy addition of a second ring of eight detectors, which would give the SemiSPECT the same detector geometry as our FastSPECT II system.13 At this stage it could be used for dynamic imaging with no motion of the imaging system or animal. Moreover, because of the small size of the detector modules, other detector geometries could be used, such as a large number of modules in close proximity to the object to obtain very high sensitivity.18 Although not compatible with the mechanical assembly of Semi-SPECT, such systems would take full advantage of Semi-SPECT’s data-acquisition hardware and software.
ACKNOWLEDGMENTS
The authors thank Sean Taylor, Benjamin Gershman, Antonio Arce, Eric Goodwin, Dak Knight, Steve Balzer, Dan Marks, Joshua Eskin, Kevin Matherson, Lance Fesler, and Heather Durko, who contributed towards the technology used in SemiSPECT, and Dr. Gail Stevenson, who helped us to accomplish the initial animal studies using SemiSPECT. This work was funded by National Institutes of Health Grant Nos. R37 EB000803 and P41 EB002035: The Center for Gamma Ray Imaging. The research of Todd E. Peterson, Ph.D. was supported in part by a Career Award at the Scientific Interface from the Burroughs Wellcome Fund.
APPENDIX: FOURIER CROSSTALK MATRIX
When a continuous-to-discrete operator ℋ acts on a three-dimensional object f, the output of the system can be written as
| (A1) |
where the vector n models noise in measurement. The mth detector measurement is given by
| (A2) |
where S represents the region defined by a support function S(r), whose value is 1 for points r ∈ S and 0 otherwise. Since the support function defines a finite object space, the object f can be represented by a Fourier series
| (A3) |
where
| (A4) |
is the kth Fourier basis function. The vector index k spans an infinite set of integers (kx, ky, kz), and the wavevector ρk takes the values
| (A5) |
where L is a width of the smallest cubic region enclosing the object space. Combining Eq. (A3) and Eq. (A4) yields
| (A6) |
where
| (A7) |
In Eq. (A7), hm(r) is called the detector sensitivity function since it describes the measurement sensitivity of the mth detector element to a point source at r. An element of the Fourier crosstalk matrix is defined by
| (A8) |
where M is the total number of detector elements.
The Fourier crosstalk matrix is an exact description of the (noise-free) imaging characteristics of the system. Its interpretation is facilitated by rewriting (A8) as
| (A9) |
where (·,·) denotes a scalar product in data space. An off-diagonal element, βkk′ for k ≠ k′ describes the degree of aliasing of two different Fourier-series basis functions Φk(r) and Φk′(r). If the corresponding βkk′ was zero, these two basis functions would make orthogonal contributions to the data and their coefficients in (A3) could be estimated independently. A normalized version of βkk′ can be used to define a degree of aliasing.26
It follows from (A9) that the diagonal element βkk is the squared norm of the data when the object is a single Fourier-series component. It thus quantifies how strongly a particular 3D spatial frequency contributes to the recorded data, and in this sense it can be interpreted as the square of the MTF of the system, though it makes no assumption about shift-invariance and it does not require that the functions Φk(r) be eigenfunctions of the system.
The interpretation of βkk as the squared MTF is also motivated by considering the limit of a large field of view, where the spacing between spatial frequencies in the Fourier-series basis set is small and k becomes a continuous variable. In that case, if the continuous-to-continuous operator ℋ†ℋ is shift-invariant, βkk is exactly the square of the transfer function, and when normalized by β00, it is the squared MTF. More generally, βkk provides a mathematically rigorous way of discussing MTF in shift-variant digital imaging systems. Note, however, that it characterizes the imaging hardware, through the projection-backprojection operator ℋ†ℋ, and says nothing about image reconstruction.
When this approach is applied to tomographic systems, it is found that βkk falls off approximately as the reciprocal of the spatial frequency, reflecting the well-known fact that projection and backprojection without filtering leads to a strong low-pass filtering action that has to be corrected by some form of ramp filtering. For reasons described in Sec. III B, we do not want to include an actual reconstruction algorithm in a system characterization that is supposed to be indicative of the hardware, but for purposes of getting a summary measure of resolution for the hardware we include a factor of |ρk| and define an equivalent MTF2 as
| (A10) |
To be explicit, we can write
| (A11) |
If this factor of |ρk| is applied consistently to the diagonal elements of crosstalk matrices for different imaging systems, it provides a rigorous way of comparing them without regard to the nature of the reconstruction algorithm used. We have previously applied this method to other tomographic systems developed at the Center for Gamma-ray Imaging.13,31
Contributor Information
Hyunki Kim, College of Optical Sciences, University of Arizona, Tucson, Arizona 85724.
Lars R. Furenlid, College of Optical Sciences and Department of Radiology, University of Arizona, Tucson, Arizona 85724
Michael J. Crawford, College of Optical Sciences, University of Arizona, Tucson, Arizona 85724
Donald W. Wilson, Department of Radiology, University of Arizona, Tucson, Arizona 85724
H. Bradford Barber, College of Optical Sciences and Department of Radiology, University of Arizona, Tucson, Arizona 85724.
Todd E. Peterson, Department of Radiology and Radiological Sciences, Vanderbilt University, Nashville, Tennessee 37232
William C. J. Hunter, Department of Physics, University of Arizona, Tucson, Arizona 85724
Zhonglin Liu, Department of Radiology, University of Arizona, Tucson, Arizona 85724.
James M. Woolfenden, Department of Radiology, University of Arizona, Tucson, Arizona 85724
Harrison H. Barrett, College of Optical Sciences and Department of Radiology, University of Arizona, Tucson, Arizona 85724
References
- 1.Walrand S, Jamar F, de Jong M, Pauwels S. Evaluation of novel whole-body high-resolution rodent SPECT (Linoview) based on direct acquisition of linogram projections. J. Nucl. Med. 2005;46:1872–1880. [PubMed] [Google Scholar]
- 2.Jaszczak RJ, Li J, Wang H, Zalutsky MR, Coleman RE. Pinhole collimation for ultra-high-resolution small-field-of-view SPECT. Phys. Med. Biol. 1994;39:425–437. doi: 10.1088/0031-9155/39/3/010. [DOI] [PubMed] [Google Scholar]
- 3.Ishizu K, Mukai T, Yonekura Y, Pagani M, Fujita T, Magata Y, Nishizawa S, Tamaki N, Shibasaki H, Konishi J. Ultra-high resolution SPECT system using four pinhole collimators for small animal studies. J. Nucl. Med. 1995;36:2282–2287. [PubMed] [Google Scholar]
- 4.Klein WP, Barrett HH, Pang IW, Patton DD, Rogulski MM, Sain JD, Smith WE. FASTSPECT: Electrical and mechanical design of a high-resolution dynamic SPECT imager; Proc. Conf. Rec. IEEE NSS/MIC; 1995. pp. 931–933. [Google Scholar]
- 5.Correia JA, Burnham CA, Kaufman D, Fischman AJ. Development of a small animal PET imaging device with resolution approaching 1 mm. IEEE Trans. Nucl. Sci. 1999;46:631–635. [Google Scholar]
- 6.Chatziioannou AF, Cherry SR, Shao Y, Silverman RW, Meadors K, Farquhar TH, Pedarsani M, Phelps ME. Performance evaluation of microPET: A high-resolution lutetium oxyorthosilicate PET scanner for animal imaging. J. Nucl. Med. 1999;40:1164–1175. [PMC free article] [PubMed] [Google Scholar]
- 7.Meikle SR, Fulton RR, Eberl S, Dahlbom M, Wong KP, Fulham MJ. An investigation of coded aperture imaging for small animal SPECT. IEEE Trans. Nucl. Sci. 2001;48:816–821. [Google Scholar]
- 8.Metzler SD, Greer KL, Jaszczak RJ. Helical pinhole SPECT for small-animal imaging: A method for addressing sampling completeness. IEEE Trans. Nucl. Sci. 2003;50:1575–1583. [Google Scholar]
- 9.Weisenberger AG, Wojcik R, Bradley EL, Brewer P, Majewski S, Qian J, Ranck A, Saha MS, Smith K, Smith MF, Welsh RE. SPECT-CT System for small animal imaging. IEEE Trans. Nucl. Sci. 2003;50:74–79. [Google Scholar]
- 10.Schramm NU, Ebel G, Engeland U, Schurrat T, Béhé M, Behr TM. High-resolution SPECT using multipinhole collimation. IEEE Trans. Nucl. Sci. 2003;50:315–320. [Google Scholar]
- 11.Surti S, Karp JS, Perkins AE, Freifelder R, Muehllehner G. Design evaluation of A-PET: A high sensitivity animal PET camera. IEEE Trans. Nucl. Sci. 2003;50:1357–1363. [Google Scholar]
- 12.Tai Y-C, Chatziioannou AF, Yang Y, Silverman RW, Meadors K, Siegel S, Newport DF, Stickel JR, Cherry SR. MicroPET II: Design, development and initial performance of an improved microPET scanner for small-animal imaging. Phys. Med. Biol. 2003;48:1519–1537. doi: 10.1088/0031-9155/48/11/303. [DOI] [PubMed] [Google Scholar]
- 13.Furenlid LR, Wilson DW, Chen Y, Kim H, Pietraski PJ, Crawford MJ, Barrett HH. FastSPECT II: A second-generation high-resolution dynamic SPECT imager. IEEE Trans. Nucl. Sci. 2004;51:631–635. doi: 10.1109/TNS.2004.830975. [DOI] [PMC free article] [PubMed] [Google Scholar]
- 14.Kastis GA, Furenlid LR, Wilson DW, Peterson TE, Barber HB, Barrett HH. Compact CT/SPECT small-animal imaging system. IEEE Trans. Nucl. Sci. 2004;51:63–67. doi: 10.1109/TNS.2004.823337. [DOI] [PMC free article] [PubMed] [Google Scholar]
- 15.Lackas C, Schramm NU, Hoppin JW, Engeland U, Wirrwar A, Halling H. T-SPECT: A novel imaging technique for small animal research. IEEE Trans. Nucl. Sci. 2005;52:181–187. [Google Scholar]
- 16.Beekman FJ, van der Have F, Vastenhouw B, van der Linden AJA, van Rijk PP, Burbach JPH, Smidt MP. U-SPECT-I: A novel system for submillimeter-resolution tomography with radiolabeled molecules in mice. J. Nucl. Med. 2005;46:1194–1200. [PubMed] [Google Scholar]
- 17.McElroy DP, MacDonald LR, Beekman FJ, Wang Y, Patt BE, Iwanczyk JS, Tsui BMW, Hoffman EJ. Performance evaluation of A-SPECT: A high resolution desktop pinhole SPECT system for imaging small animals. IEEE Trans. Nucl. Sci. 2002;49:2139–2147. [Google Scholar]
- 18.Rogulski MM, Barber HB, Barrett HH, Shoemaker RL, Woolfenden JM. Ultra-high-resolution brain SPECT imaging: Simulation results. IEEE Trans. Nucl. Sci. 1993;40:1123–1129. [Google Scholar]
- 19.Butler JF, Lingren CL, Friesenhahn SJ, Doty FP, Ashburn WL, Conwell RL, Augustine FL, Apotovsky B, Pi B, Collins T, Zhao S, Isaacson C. CZT solid-state gamma camera. IEEE Trans. Nucl.Sci. 1998;45:359–363. [Google Scholar]
- 20.Singh M, Mumcuoglu E. Design of a CZT based BreastSPECT system. IEEE Trans. Nucl. Sci. 1998;45:1158–1165. [Google Scholar]
- 21.Marks DG, Barber HB, Apotovsky BA, Augustine FL, Barrett HH, Dereniak EL, Doty FP, Eskin JD, Hamilton WJ, Matherson KJ, Venzon JE, Woolfenden JM, Young ET. A 48 × 48 CZT array with multiplexer readout. IEEE Trans. Nucl. Sci. 1996;43:1253–1259. [Google Scholar]
- 22.Barber HB, Barrett HH, Augustine FL, Hamilton WJ, Apotovsky BA, Dereniak EL, Doty FP, Eskin JD, Garcia JP, Marks DG, Matherson KJ, Woolfenden JM, Young ET. Development of a 64 × 64 CZT array and associated readout integrated circuit for use in nuclear medicine. J. Electron. Mater. 1997;26:765–772. [Google Scholar]
- 23.Kastis GA, Wu MC, Balzer SJ, Wilson DW, Furenlid LR, Stevenson G, Barrett HH, Barber HB, Woolfenden JM, Kelly P, Appleby M. Tomographic small-animal imaging using a high-resolution semiconductor detector. IEEE Trans. Nucl. Sci. 2002;49:172–175. doi: 10.1109/TNS.2002.998747. [DOI] [PMC free article] [PubMed] [Google Scholar]
- 24.Augustine FL. Multiplexed readout electronics for imaging spectros-copy of high energy x-ray and gamma photons. Nucl. Instrum. Methods. 1994;353:201–204. [Google Scholar]
- 25.Marks DG. Ph.D. Dissertation. University of Arizona; 2000. Estimation methods for semiconductor gamma-ray detectors. [Google Scholar]
- 26.Barrett HH, Myers KJ. Foundations of Image Science. New York: Wiley; 2004. [Google Scholar]
- 27.Frey EC, Gilland KL, Tsui BMW. Application of task-based measures of image quality to optimization and evaluation of three-dimensional reconstruction-based compensation methods in myocardial perfusion SPECT. IEEE Trans. Med. Imaging. 2002;21:1040–1050. doi: 10.1109/TMI.2002.804437. [DOI] [PubMed] [Google Scholar]
- 28.Barrett HH, Denny JL, Wagner RF, Myers KJ. Objective assessment of image quality. II. Fisher information, Fourier crosstalk, and figures of merit for task performance. J. Opt. Soc. Am. A. 1995;12:834–852. doi: 10.1364/josaa.12.000834. [DOI] [PubMed] [Google Scholar]
- 29.Barrett HH, Gifford H. Cone-beam tomography with discrete data sets. Phys. Med. Biol. 1994;39:451–476. doi: 10.1088/0031-9155/39/3/012. [DOI] [PubMed] [Google Scholar]
- 30.Stodilka RZ, Soares EJ, Glick SJ. Characterization of tomographic sampling in hybrid PET using the Fourier crosstalk matrix. IEEE Trans. Med. Imaging. 2002;21:1468–1478. doi: 10.1109/TMI.2002.806595. [DOI] [PubMed] [Google Scholar]
- 31.Kastis GK. Ph.D. dissertation. University of Arizona; 2002. Multi-modality imaging of small animals. [Google Scholar]
- 32.Kim H. Ph.D. dissertation. University of Arizona; 2004. SemiSPECT: A small-animal SPECT imager based on eight CdZnTe detector arrays. [Google Scholar]
- 33.Barrett HH, Swindell W. Radiological imaging: The theory of imaging formation, detection, and processing. New York: Academic; 1981. [Google Scholar]
- 34.Anger HO. Radioisotope cameras. Instrum. Nucl. Med. 1967;1:485–552. [Google Scholar]
- 35.Paix D. Pinhole imaging of gamma rays. Phys. Med. Biol. 1967;12:489–500. doi: 10.1088/0031-9155/12/4/004. [DOI] [PubMed] [Google Scholar]
- 36.Barrett HH, Eskin JD, Barber HB. Charge transport in arrays of semiconductor gamma-ray detectors. Phys. Rev. Lett. 1995;5:156–159. doi: 10.1103/PhysRevLett.75.156. [DOI] [PubMed] [Google Scholar]


