

Abstract
Many aspects of the complex interaction between HIV-1 and the human immune system remain elusive. Our objective is to study these interactions, focusing on the specific roles of dendritic cells (DCs). DCs enhance HIV-1 infection processes as well as promote an anti-viral immune response. We explore the implications of these dual roles. We present and analyse a mathematical model describing the dynamics of HIV-1, CD4+ and CD8+ T-cells, and DCs interacting in a human lymph node. We validate the behaviour of our model against non-human primate SIV experimental data and published human HIV-1 data. Our model qualitatively and quantitatively recapitulates clinical HIV-1 infection dynamics. We perform sensitivity analyses on the model to determine which mechanisms strongly affect infection dynamics. Sensitivity analysis identifies system interactions that contribute to infection progression, including DC-related mechanisms. We compare DC-dependent and DC-independent routes of CD4+ T-cell infection. The model predicts that simultaneous priming and infection of T cells by DCs drives early infection dynamics when activated T-helper cell numbers are low. Further, our model predicts that, while direct failure of DC function and an indirect failure due to loss of CD4+ T-cell help are both significant contributors to infection dynamics, our results support the hypothesis that the former has a more significant impact on HIV-1 immunopathogenesis.
Introduction
Despite advances in our understanding of HIV-1 and the human immune response in the last 25 years, much of this complex interaction remains elusive. CD4+ T-cells are targets of HIV-1, and are also important for the establishment and maintenance of an adaptive immune response (Poli et al., 1993). CD8+ T-cells are the primary effector cells in HIV-1 infection, as they kill infected cells and produce non-lytic antiviral factors. In lymph nodes (LNs), myeloid dendritic cells* (DCs) serve as antigen presenting cells, activating CD4+ and CD8+ T-cells (Steinman, 1991). DCs are also of particular importance because HIV-1 exploits DCs to enhance infection (Lekkerkerker et al., 2006). Thus, DCs are a critical link between virus, CD4+ T-cells, and CD8+ T-cells (Figure 1). Elucidating the mechanisms of DC-virus interactions is crucial in uncovering more details about host-virus dynamics during HIV-1 infection. Toward this goal, we develop a mathematical model of HIV-1 dynamics within a human LN, as it is the major site of viral replication and generation of the antiviral immune response.
Figure 1.

Summary of interactions captured in the model. Resting CD4+ T-cells (T4) become active helper T-cells (Th) via DC antigen presentation. T4 and Th cells become infected (I) and produce virus (V). Viral antigen, and T-cell help from Th promotes DC function (bottom green arrow). Immature dendritic cells (iDC) become matured (MDC) by viral antigen, and licensed (LDC) by T-cell help. LDC promote immunity (top left green arrow) by priming CD8+ T-cells to become cytotoxic T-lymphocytes (CTL). CTL promote viral control (top right green arrow) by killing infected cells (I), and via non-lytic antiviral factors. This immunogenic cycle (green arrows) is disrupted by the dual role of dendritic cells promoting infection (bottom red arrow).
Role of DCs in Adaptive Immunity
The prototypical “Langerhans cell paradigm” behaviour of DCs is that, after encountering antigen in the periphery, DCs mature and travel to the LN (Wilson & Villadangos, 2004). DCs maturation includes increasing antigen presentation on MHC molecules, and up-regulating co-stimulatory molecules (Steinman, 1991). Mature DCs prime CD4+ T-cells to become effector helper T cells. Additionally, DCs cross-present exogenous antigens on MHC Class I to prime CD8+ T-cells. Primed CD8+ T-cells differentiate into cytotoxic T-lymphocytes (CTLs). This cell-based immunity is essential for fighting intracellular pathogens like HIV-1 (Janeway, 2005, Mellman & Steinman, 2001).
There is currently debate whether CD4+ T-cell help is necessary for primary CTL response (Serre et al., 2006, Smith et al., 2004, Wang & Livingstone, 2003), or is only required for a subsequent memory response (Janssen et al., 2003, Shedlock & Shen, 2003). One possible mechanism to deliver T-cell help relies on DCs becoming “licensed” through interactions with helper T-cells, such as signalling by CD40 ligation (Ridge et al., 1998, Schoenberger et al., 1998). Once licensed, DCs up-regulate expression of MHC Class I and co-stimulatory molecules (Bukczynski et al., 2005), making them capable of priming a strong and sustained CTL response. Here we define licensed DCs as those competent to prime CD8+ T-cells.
Dual Role of DCs in HIV Infection
In HIV-1 infection, DCs play a dual role of promoting immunity while also facilitating infection. C-type lectin receptors on the surface of DCs, such as DC-SIGN, can bind HIV-1 envelope gp120 (Turville et al., 2002). DCs can then internalise and protect virus, extending the typically short infectious half-life of virus to several days (Kwon et al., 2002). Alternatively, it has been shown that DCs can become infected (Blauvelt et al., 1997). In either case, HIV-1 associates with DCs to travel to lymphoid tissue, where 98% of T-cells reside (Haase, 1999, Trepel, 1974). During antigen presentation, DC-associated virus, HIV-1 receptor, and co-receptors co-localize at the site of cell contact, facilitating infection of CD4+ T-cells (Arrighi et al., 2004, McDonald et al., 2003). Taken together, these interactions suggest that DC dynamics are particularly important to HIV-1 infection.
Typical Course of HIV-1 Infection
After an acute phase of infection, characterized by high viral loads and high immune system activity that lasts on the order of weeks, the viral-host system stabilizes to a long-term chronic infection (i.e. clinical latency) that lasts years. This chronic state of infection is characterized by a lower, stable, “set-point” viral load (Ho, 1996). Eventually, due to unknown mechanisms, this stable state is broken, leading to low CD4+ T-cell counts and high viral loads characteristic of AIDS.
SIV Non-Human Primate Model of HIV-1 Infection
It is difficult to obtain data on the entire time course of HIV-1 infection, as patients are typically not diagnosed until well after establishment of infection. It is also difficult to obtain data on the lymphoid compartment due to the invasiveness of LN biopsy. Therefore, SIV infection of non-human primates (NHP) is currently the best experimental model of HIV-1 infection in humans. SIV infection in NHPs begins with an acute period of high viremia that lasts approximately 3 weeks (Reimann et al., 2005), as with HIV-1 infection of humans. In contrast, chronic infection in NHPs lasts on the order of months to a year, compared to years in human infection. As with AIDS in humans, simian AIDS is characterized by high viremia and depletion of CD4+ T-cells (Dioszeghy et al., 2006).
Role of DCs in Progression to AIDS
Several mechanisms have been proposed to trigger progression from the chronic phase of infection to AIDS. Many have hypothesized that progressive alteration of the immune system results in the transition to AIDS (Chougnet & Gessani, 2006, Granelli-Piperno et al., 2004, Krathwohl et al., 2006). Dysfunction of DCs is central to many of these hypotheses. During progression, DCs either fail to prime T-cells or are actively immunosuppressive (Granelli-Piperno et al., 2004, Krathwohl et al., 2006), resulting in failure of immune control; however, the reasons for this dysfunction are unknown. Are DCs directly affected by HIV-1? Or, does virus alter CD4+ T-cells, indirectly causing DC dysfunction due to lack of T-cell help (Chougnet & Gessani, 2006)?
To study the roles of DCs during HIV-1 infection, we present a mathematical model of HIV-1 infection and accompanying immune response. Expanding on previous work (Bajaria & Kirschner, 2005), we develop a next-generation model focused on the dynamics within a LN, we include recent findings regarding the function of DCs, and we address current questions regarding DCs in HIV-1 infection. We validate our model by comparison to data generated in a non-human primate SIV infection model and published human clinical data. As the equations that constitute our mathematical model describe specific interactions, our analysis allows us to predict the importance of DC mechanisms and their role in triggering progression to AIDS. We explore how T-cell infection is enhanced by DCs, showing that the relative importance of this effect changes with respect to infection state. In particular, our model predicts which mechanisms of DC dysfunction are most significant in the transition to AIDS.
Methods
NHP SIV Infection Model
Adult cynomolgus macaques (Macaca fascicularis) were infected intrarectally with SIV/DeltaB670 (Murphey-Corb et al., 1986) and sacrificed at 2 wk post-infection or upon development of AIDS, defined by reduced CD4+ T-cell counts and clinical symptoms. Axillary and hilar LN tissues were processed as described previously (Fallert & Reinhart, 2002, Reinhart et al., 2002). The animal studies were performed under the guidance and approval of the University of Pittsburgh Institutional Animal Care and Use Committee.
Immunofluorescence Microscopy and Immunohistochemistry
We performed immunofluorescence on 14um tissue sections using primary antibodies for Ki67 (Novocastra, clone MM1; 1:100) and CD3 (Novocastra, clone CD3-12; 1:100), secondary antibodies FITC-conjugated goat anti-mouse IgG1 (Jackson ImmunoResearch; 1:100), biotinylated goat anti-rabbit Ig (Zymed; 1:100), AF488-conjugated rabbit anti-Fluorescein (Molecular Probes; 1:80), and streptavidin-AF647 (Molecular Probes; 1:100). Images were captured on an Olympus Fluoview 500 laser scanning confocal microscope. Images were analysed using MetaMorph software (Universal Imaging). CD3 is a marker for T-cells, and Ki67 indicates cells that have divided within the past 3-4 days (Pitcher et al., 2002). Because T-cell division during HIV-1 infection is primarily due to antigen-driven immune activation rather than an antigen-independent homeostatic response (Cohen Stuart et al., 2000, Hazenberg et al., 2000), we consider CD3+Ki67+ cells to be active, effector T-cells.
Immunohistochemical staining (IHC) was performed to detect DC-SIGN+ cells as described previously (Fallert & Reinhart, 2002, Reinhart et al., 2002) using anti-DC-SIGN mAb (BD Pharmingen, clone DCN46). Stained cells were counted in five different sites in the paracortex and averaged. Because DC-SIGN is not a completely specific marker for DCs, observing dendritic morphology of most of the stained cells provided confidence that DCs were counted. IHC to detect CD3+ T-cells was performed similarly and counted in five different microscopic fields and averaged.
In all cases, cell counts per volume of tissue are calculated by multiplying the cell count per mm2 of tissue by the thickness of the tissue section (14um) and scaling to appropriate units (per ml).
In Situ Hybridization
In situ hybridization was performed as previously described (Fallert & Reinhart, 2002, Reinhart et al., 2002). The numbers of SIV vRNA+ cells in 10-20 different microscopic fields per region were manually counted and averaged.
Mathematical Model
Our mathematical model describes cell and virus interactions within the paracortical region of a human LN using a system of nine non-linear ordinary differential equations. These equations describe the rates of flow as cells arrive, interact, change phenotype, and exit. Figure 1 outlines key features. Each of the biological interactions described below is captured by a mathematical term in our model. A more detailed description and biological justification of the model is given in Supplemental Data.
CD4+ T-cell Dynamics
We consider three phenotypic classes of CD4+ T-cells: resting, activated effector, and infected. Resting CD4+ T-cells arrive by infection-independent and -dependent mechanisms. Resting cells can become productively infected, or become abortively infected and undergo apoptosis (Jekle et al., 2003). CD4+ T-cells are primed by DCs to become effector T-helper cells. A fraction are infected during priming (Lekkerkerker et al., 2006). Activated T-helper cells undergo clonal expansion. T-helper cells can become infected by virus or virus-loaded DCs. Infection is inhibited by CTLs (Geiben-Lynn, 2002). Infected CD4+ T-cells can be killed by CTLs. All CD4+ classes can exit via efferent lymphatics.
HIV-1Dynamics
Virus is produced by infected CD4+ T-cells. Production is inhibited by CTL-produced factors (Geiben-Lynn, 2002, Kedzierska & Crowe, 2001, Levy, 2003). The vast majority of virus particles are associated with follicular dendritic cells (Haase, 1999), which extend their half-life (Cavert et al., 1997). Follicular dendritic cells are not explicitly considered, though we account for their effect on virus half-life.
CD8+ T-cell Dynamics
We consider two classes of CD8+ T-cells: resting, and activated effector. Resting CD8+ T-cells arrive due to infection-independent and -dependent mechanisms. Because CD8+ T-cells require more (or different) co-stimulatory signals to become fully activated CTLs (Whitmire & Ahmed, 2000), these are primed only by licensed DCs. Primed CTLs undergo clonal expansion. All CD8+ classes can exit via efferent lymphatics.
Dendritic Cell Dynamics
Immature DCs arrive independently of infection and mature DCs arrive during infection. Within the LN, immature DCs can encounter antigen and undergo maturation. Mature DCs become licensed though interactions with activated helper T-cells (Ridge et al., 1998). Mature and licensed DCs are susceptible to being killed by CTLs (Ronchese & Hermans, 2001, Yang et al., 2006). Any of these DC classes can die, though mature and licensed DCs are short-lived compared to immature DCs (Ruedl et al., 2000).
Parameter Estimation
Parameters are estimated from a variety of published sources. For details of parameter estimation, see Supplemental Data. We handle uncertainties in parameter estimation systematically by uncertainty and sensitivity analysis (see below).
Initialisation of the Simulation
Prior to infection, the LN is assumed to contain only resting/immature cells. We determine the initial numbers from immunohistochemistry measures of uninfected NHPs herein, and from published CD4:CD8 ratios (Biancotto et al., 2007). HIV-1 infection dynamics begin with the arrival of a single mature DC at day 0 presenting both viral antigen and infectious virus.
Solving the Model System
The system of differential equations is solved using the ode15s algorithm in MATLAB (Shampine & Reichelt, 1997). The solution of the system at any given time point yields the average number of each type of cells/virions within the LN. We solve our system over a time course representing years.
Model Validation
To validate the behaviour of our model, we compare data from our model simulations to NHP SIV-infection data. Our model simulates paracortical LN tissue over a longitudinal time course. However, the invasiveness of LN biopsy makes a longitudinal NHP study difficult. Thus, our experimental data are cross-sectional and categorical. Due to variability between out-bred animals, categorization by time post infection is not completely reliable. Instead, we categorize infection state not only by time post infection but also by plasma viral load, blood CD4+ T-cell counts, and clinical symptoms. We map our experimental animal study categories to ranges of time in our model simulation, for the purpose of comparison.
We additionally validate our model by comparison to published human HIV-1 infection data. We scale human total-body cell count estimates by 1/700 to represent one ml of lymphoid tissue. This conversion assumes a typical human body weight is 70 kg, 1% by weight is lymphoid tissue (Haase, 1999), and tissue density is 1 g/ml.
Uncertainty and Sensitivity Analysis
Parameters that govern the rates of interaction in our model are estimated from a variety of published biological data. Because of variability between experimental systems, all estimates have an associated degree of uncertainty. We address this uncertainty in a systematic manner by uncertainty and sensitivity analysis. This analysis also determines which parameters are most important in governing the state of the system. Analysis is performed using Latin Hypercube Sampling and Partial Rank Correlation (LHS/PRC) (Blower & Dowlatabadi, 1994, Marino et al., 2008), and the extended Fourier Amplitude Sensitivity Test (eFAST) (Marino et al., 2008, Saltelli et al., 1999). LHS/PRC is performed using 1000 model simulations, and eFAST is performed using 697 simulations per parameter and 6x parameter resampling for a total of 175644 model simulations. Briefly, both algorithms sample input parameters independently over a range (see Supplemental Table1). We sample using a uniform probability distribution function, and sample on a log scale if the sampling range is two orders of magnitude or greater. The algorithms then perform model simulations with each parameter combination, and measure the sensitivity of the system to changes in each parameter. Like ANOVA, the eFAST method decomposes variance in model output to determine the fraction of variance in model output explained by each input parameter. The eFAST total-order sensitivity index, which we report here, takes into account higher-order interactions between multiple parameters. We determine the limit of detection by allowing the eFAST algorithm to partition variance to a dummy parameter that does not affect model output. To determine statistical significance we perform two-sample Student’s t-test on eFAST values from parameter resampling. LHS/PRC reports sensitivity as a coefficient of correlation between input parameter and model output. Statistical significance of these correlations is determined by Student’s t-test with Bonferroni correction (Curran-Everett, 2000). Statistical comparison between these correlation coefficients is performed using Fisher’s z transformation (Meng et al., 1992). For a complete discussion of uncertainty and sensitivity analysis, see (Marino et al., 2008).
In Silico Interventions
To explore the role of particular interactions or mechanisms, we perform in silico interventions by changing parameter values during the course of a simulation. In silico intervention is analogous to altering particular interactions in vivo using pharmacological treatments. The flexibility of our in silico system allows us to perform an intervention even if there is no analogous experimental treatment.
In addition, we use in silico intervention to induce depletion of CD8+ T-cells: we block recruitment and proliferation, so that no new cells enter the population. Maturation and exit are left in place so that CD8+ T-cells are gradually depleted. This in silico depletion is analogous to experiments where antibodies are used to deplete CD8+ T-cells from SIV-infected Rhesus macaques. A number of groups have demonstrated that this treatment causes a dramatic rise in viral load 1-3 orders of magnitude, depletion of CD4+ T-cells, and disease progression (Jin et al., 1999, Matano et al., 1998, Schmitz et al., 1999). As a positive control, we deplete CD8+ T-cells in silico. For the purpose of our model analysis, we define an “AIDS-like state” based on this immunity-impaired positive control.
Results
To explore the role of DCs during HIV-1 infection, we first capture the homeostatic mechanisms of a healthy LN in the absence of virus. Next, we introduce virus to simulate an acute phase and chronic state of infection, and validate our model by comparing our simulations to SIV-infected NHP data and published human clinical data. Finally, we analyse our model using uncertainty and sensitivity analysis techniques to identify mechanisms involved in HIV-1 infection and pathogenesis.
Simulation of a healthy lymph node
As a negative control, we simulate a healthy LN in the absence of virus. By construction, all cell types remain constant in number, reflecting an assumption of homeostasis in the absence of antigen (Doherty & Christensen, 2000). These levels observed in our simulation agree with NHP infection data derived herein and also with published human clinical data (Haase, 1999) (Table1).
Table 1.
Model simulation values compared to non-human primate experimental data and published human clinical data in lymph node
| Infection state / Model timepoint |
Count | Model simulation | Non-human Primate |
Human clinical data(Haase, 1999) |
|---|---|---|---|---|
| no infection / day 0 | total CD4+ T-cell | 3.5 × 10⁸ | 3.7 × 10⁸* | 2.9 × 10⁸ |
| chronic / day 300 | total CD4+ T-cell | 8.6 × 10⁷ | 10.7 × 10⁷* | 6.7 × 10⁷ |
| acute / day 6 | infected cell | 2.5 × 10⁶ | 1.7 × 10⁶ | 7.1 × 10⁵ |
| chronic / day 300 | infected cell | 8.2 × 10⁵ | 6.4 × 10⁵ | 5.7 × 10⁴ |
| acute / day 6 | virus | 2.0 × 10⁹ | > 108 | |
| chronic / day 300 | virus | 8.3 × 10⁸ |
= this value was calculated from total T-cell count and the CD4:CD8 ratio from (Biancotto et al. 2007)
Simulation of acute phase and chronic steady state match human and NHP infection data
Solving the model simulates the populations of each cell type and virus over time (Figure 2). From our model, we calculate experimentally relevant variables for comparison to our NHP experimental data (Figure 3A-D). We find that our model quantitatively recapitulates the depletion of DCs and T-cells (Figure 3A-B), and the increase in infected and activated T-cell populations (Figure 3C-D) in the paracortical regions of a LN during uninfected, acute and chronic infection.
Figure 2.
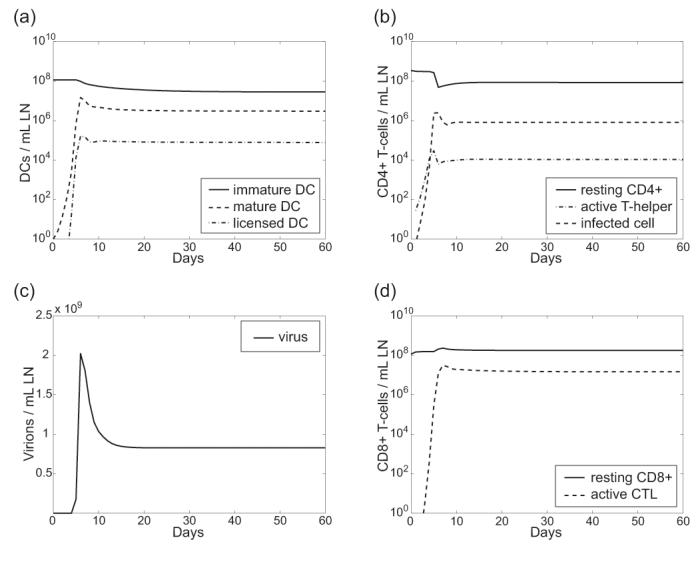
Model simulation shows acute infection settling into chronic by day 20. Shown are time courses for all cell types and virus as follows: (A) Dendritic cells (B) CD4+ T-cells (C) Viral load (D) CD8+ T-cells.
Figure 3.

Comparison of model simulation to experimental non-human primate lymph node paracortical cell counts, and published human lymph node data (Biancotto et al., 2007). Model simulation values are derived from Figure 2. Dotted lines indicate +/- 1 S.D. on the median of uncertainty analysis simulations. Error bars on experimental data represent 1 S.D. on the mean. (A) Dendritic cells (B) Total T-cells (C) Infected cells (D) Percent activated T-cell counts (E) Simulation CD4:CD8 T-cell ratio compared to human clinical data from (Biancotto et al., 2007).
Other studies have shown that DCs are depleted during simian AIDS (Brown et al., 2007). Similarly, we find that total dendritic cells become depleted during SIV infection, both in our experimental animal studies and our model simulations (Figure 3A). The model simulation predicts that DC depletion occurs gradually after infection peaks (Figure 3, compare panels A and C).
Because our model distinguishes CD4+ from CD8+ T-cells, but our experimental data only measures total T-cells, we additionally validate the model simulation CD4:CD8 ratio by comparison to published HIV-1-infected human LN data (Biancotto et al., 2007). Typically in the blood, the CD4:CD8 ratio inverts from 2:1 to 1:2 over the course of infection (Margolick et al., 2006). However, our model recapitulates the 4:1 to 1:2 inversion of the CD4:CD8 ratio that occurs in human lymphoid tissue during chronic HIV-1 infection (Figure 3E).
To ensure relevance to human disease, we additionally validate our model simulation by comparison to published human HIV-1 infection data (Table 1). Our model agrees with human estimated lymphoid tissue cell counts.
Determination of parameters that drive viral load
Sensitivity and uncertainty analysis reveals how variation in model parameters affects infection dynamics. First, we analyse parameters directly related to CD4+ T-cells, CD8+ T-cells, and virus (see Supplemental Material). Next, we find many of the significant parameters identified by this analysis are DC-related (Table 2A). These DC-related mechanisms are either positively or negatively correlated with viral load by LHS/PRC, indicating the dual role of DCs in promoting both infection and immunity. We find that the parameter governing the immigration of mature DCs that have encountered antigen in the periphery (ϕDM) has a negative correlation with viral load. Although additional mature DCs promote infection, the net effect is to promote immunity, reducing steady state viral load. The parameters that control licensing of DCs by T-helper cells (λ) and priming of CTLs by licensed DCs (r8L) are both strongly negatively correlated with viral load as these mechanisms promote immunity. In contrast, parameters that control priming and subsequent infection of T-helper cells by DC-associated virus (rDM and kDM, respectively) are correlated with increased viral load.
Table 2.
A. Sensitivity of DC parameters during chronic state B. Global sensitivity analysis identifies mechanisms that can cause progression to AIDS-like state
| Parameter Definition | Symbol | Correlation with viral load† |
|---|---|---|
| Recruitment | ||
| Max. immigration rate of mat. DC due to antigen | φDM | ↓ |
| Licensing | ||
| Licensing rate of mat. DCs by T-helper | λ | ↓ |
| Priming | ||
| Priming rate of naïve CD4+ by mat. DC | rDM | ↑ |
| Priming rate of naïve CD8+ by lic. DC | r8L | ↓ |
| Enhancement of CD4+ T -cell Infection | ||
| Infection rate of T-helper by mat. DC-associated virus | kDM | ↑ |
| Parameter Definition | Symbol | Sensitivity† |
|---|---|---|
| Source and Recruitment | ||
| Max. recruitment rate of naïve CD4+ by DC | φ4 | * |
| Max. recruitment rate of naïve CD8+ by DC | φ8 | ↓ * |
| Max. immigration rate of mat. DC due antigen | φDM | * |
| Death / Exit to Efferent Lymph | ||
| Death/Exit rate of infected cells | μI | ↑ |
| Destruction rate of virus particles | μV | ↓ * |
| Death/Exit rate of naïve CD8+ | μ8 | ↑ |
| Death/Exit rate of CTL | μC | ↑ |
| Proliferation / Clonal Expansion | ||
| Proliferation rate of CTL | pC | ↓ |
| Priming | ||
| Priming rate of naïve CD4+ by mat. DC | rDM | ↑ * |
| Priming rate of naïve CD8+ by lic. DC | r8L | ↓ * |
| Infection | ||
| Abortive infection and bystander effects of naïve CD4+ | kab | ↓ * |
| Infection rate of T-helper by virus | kV | ↑ |
| Infection rate of T-helper by mat. DC-associated virus | kDM | ↑ |
| Virus Properties | ||
| Average number of virus produced by an infected cell | N | ↑ * |
| CTL Effector Functions | ||
| Inhibition of mat. DC-associated virus infection by CTL | c2 | ↑ |
| Inhibition of infected cell virus production by CTL | c4 | ↑ |
| Killing rate of infected cells by CTL | κI | ↓ * |
| Killing rate of lic. DC by CTL | κL | ↑ |
| DC Maturation and Licensing | ||
| Licensing rate of mat. DCs by T-helper | λ | ↓ * |
= statistically significant positive correlation (p < 5.9 × 10⁻⁴)
= statistically significant negative correlation (p < 5.9 × 10⁻⁴)
= numerical correlations are given in Supplemental Data
= significant positive correlation by LHS/PRC (p < 2.4 × 10⁻⁴)
= significant negative correlation by LHS/PRC (p < 2.4 × 10⁻⁴)
= significant total-order sensitivity index by eFAST (p < 0.01)
= numerical sensitivity indices are given in Supplemental Data
Importance of DC-facilitated infection varies during the course of HIV-1 infection
Our model captures four mechanisms leading to productive infection of CD4+ T-cells (Figure 4A). Resting CD4+ T-cells become infected cells by all four routes. In the first case, virus infects resting T-cells directly without a need for priming. Of these cells, a small fraction are stimulated to become productively infected, and the rest remain abortively infected and undergo apoptosis. This is the only route of infection described that is completely independent of DCs. In the second case, CD4+ T-cells are concurrently primed and infected by DCs. Cases 3 and 4 depend on mature or licensed DCs to first prime CD4+ T-cells. In the third case, virus infects activated T-helper cells independently of DCs. In the fourth case, DC-associated virus infects primed T-helper cells. To gauge the relative importance of each of these infection mechanisms, we perform a focused sensitivity analysis on these nine parameters during establishment of infection/early acute phase and chronic state of infection. During the acute phase of infection, four parameters are significantly correlated with viral load (see asterisks, Figure 4B): abortive infection of T-cells (κab), which are then stimulated to become productively infected (α), priming of T-helper cells (rDM), and concurrent priming and infection by mature DCs (bM) are significantly correlated with viral load. During the earliest establishment of infection, there has not been sufficient time to prime many T-helper cells. Thus, mechanisms that require a pool of activated T-helper host cells (such as kV, kDM, kDL) cannot contribute significantly to infection levels. Comparing the relative strength of each these four infection mechanisms during infection establishment, we find that priming of T-helper cells, and concurrent priming and infection by mature DCs have a significantly greater correlation with viral load than the other infection mechanisms (see daggers, Figure 4B). Our model predicts that the ability of DCs to concurrently prime and infect resting CD4+ T-cells is crucial to the establishment of infection.
Figure 4.

Sensitivity analysis on different routes of infection. (A) Four mechanisms of infection are captured by the model. (B) Correlation between parameter value and early acute phase viral load (days 2-6). (C) Correlation between parameter value and chronic state viral load (day 300). (* = p<0.0011) (†= significantly different from all other parameters p<0.0003).
During the chronic state of infection (Figure 4C), abortive infection of resting T-cells becomes negatively correlated, and concurrent priming and infection of T-cells by DCs becomes insignificant. Instead, infection mechanisms 3 and 4, priming followed by infection (controlled by parameters kV, kDM, and kDL), are significantly correlated to chronic state viral loads (see asterisks, Figure 4C). Comparing the relative significance of each of these mechanisms, we find that infection of activated T-helper cells by DC-associated virus has a significantly greater correlation, revealing the importance of DCs enhancing infection during maintenance of infection (see dagger, Figure 4C).
Many mechanisms can cause progression to an AIDS-like state
As a positive control, we deplete CTLs in silico (Figure 5). In the absence of immune effector functions, the system establishes a new steady state characterized by a high viral load set-point (Figure 5A-B, bold solid line) and reduction in CD4+ T-cell counts (not shown). In subsequent model analysis, we compare the effects of other in silico interventions to this positive control “AIDS-like state”.
Figure 5.

Parameters that induce an AIDS-like state. Parameters are increased or reduced to the extremes of their range of variation (see Supplemental Table I) at day 60 (see arrow) to determine whether they are capable of inducing an AIDS-like state. In both panels, an AIDS-like state is induced by CD8+ T-cell depletion at day 60 (see arrow), as a positive control. All other parameters are held to their default values (see Supplemental Table I). (A) Parameters related to infection and viral production (B) Parameters related to immune effector functions. Table 2 accompanies this figure and presents all the parameters and their definitions.
Parameters we found to be significant in our sensitivity analysis (Table 2B) are important in determining viral load. Thus, mechanisms controlled by these parameters are likely involved, singly or in combination, in the transition to AIDS. Specific parameters identified by both LHS/PRC and eFAST methods have a very significant effect on viral load. However, the relative strengths and weaknesses of these algorithms cause them to identify different subsets of marginally sensitive parameters. These statistically significant but weak mechanisms might work in combination with each other, or the more significant mechanisms, causing a multi-factorial progression to AIDS. To test which mechanisms could be involved in progression to an AIDS-like state, we perform in silico intervention by varying the mechanisms we identified in the sensitivity analysis (Figure 5). We find that parameters that are able to cause an AIDS-like state fall into three functional categories: first, mechanisms related to infection and viral replication (Figure 5A); second, mechanisms related to maintenance or effector functions of immune response (Figure 5B); third, mechanisms related to death or exit of CD8+ T-cells or virus (Appendix Figure 2A). As expected, based on DCs dual roles, DC functions are represented in the infection (Figure 5A) and immune response (Figure 5B) categories.
The first functional group of parameters identified (N, μI, kDM, rDM, kV) is related to mechanisms of infection and viral replication. Changing these parameters from their baseline values to the extremes of their range of variation (see Appendix Table 1 in Supplemental Material) can induce a transition to an AIDS-like state. This supports the hypothesis that a progressive adaptation of virus could result in progression to AIDS. Adaptation of virus has been suggested by others: mechanisms include changes in coreceptor usage or affinity (Gorry et al., 2004, Xiao et al., 1998), or increases in replication number (Stilianakis et al., 1997). In addition, it has been shown that the HIV-1 protein Nef causes up-regulation of DC-SIGN in infected DCs, possibly increasing DC-enhanced infection (Sol-Foulon et al., 2002).
The second functional group of parameters (r8L, κI, κL, λ) controls maintenance or effector functions of immune response. Three of these mechanisms form a causal pathway: first, DCs become licensed by T-cell help (λ); next, licensed DCs prime CTLs (r8L); finally; CTLs kill infected T-cells (κI). We find that reducing any of these mechanisms to the minimum of their range of variation (see Appendix Table 1 in Supplemental Material), results in a failure of the immune response to control infection, leading to an AIDS-like state. This finding lends support to the hypothesis that an impairment of immune response results in an inability to control viral load. Immunologically, reduction in CTL priming or CTL killing of infected cells could result from acquisition of CTL epitope mutations (Wodarz & Nowak, 2002). Alternatively, as DCs are central to the generation of CTL response, alterations in licensed DC function could impair immunity.
The third functional group identified, parameters related to death or exit of CD8+ T-cells or virus, represents mechanisms related to lymphoid tissue architecture and regulated traffic of cells though LNs. This finding is not surprising given that alterations in T-cell migration and lymph node architecture are hallmarks of HIV-1 infection, other chronic infections, and immunodeficiency in general (von Andrian & Mempel, 2003). See Supplemental Material for details on these results.
Finally, we found that statistically significant but weakly correlated parameters (ϕ4, ϕ8, ϕDM, pC, c2, c4) were unable to independently induce an AIDS-like viral load. Because components of the immune system are highly interactive, progressive HIV-1 infection to AIDS is likely a multi-factorial and multi-step process. Indeed, we find that these parameters in combination can lead to an increase in viral load approximately equal to acute phase viremia (Appendix Figure 2B).
DC dysfunction in progression to AIDS
There exist two main hypotheses for the role of DC dysfunction in progression to AIDS (Figure 6A). The first suggests that, as helper T cells become depleted by HIV-1 infection, they are present in insufficient numbers to license DCs, which in turn reduces the ability of DCs to prime CD8+ T cells. The second hypothesis suggests that DC dysfunction is the result of a direct viral effect on DC intracellular processes (Chougnet & Gessani, 2006, Cohen et al., 1999). Likely, both mechanisms are at play during infection; however, our model analysis tests if one hypothesis is more significant in AIDS progression. To this end, we vary parameters controlling DC licensing by T-cell help (λ) and licensed DC priming of CTLs (r8L). When all other confounding factors are held constant at their default parameter values (Supplemental Table 1) we find that decreasing either or both of these mechanisms can cause an AIDS-like viral load. To examine further, we use global sensitivity analysis using the eFAST method to perform thousands of in silico experiments varying all model parameters simultaneously. This analysis identifies overall sensitivities that are apparent despite uncertainty or variability in other mechanisms. We find that licensed DC priming of CTLs (r8L) is a significantly more sensitive (p<0.01) control point than DC licensing by T-cell help (λ). This result indicates that, given biological variability in many other mechanisms affecting both DCs and CTLs, a direct failure of licensed DCs more likely contributes to HIV-1 immunopathogenesis than an indirect failure of CD4+ T-cell help to license DCs. This finding suggests that therapies targeting DCs function will be more successful than therapies targeting a failure of CD4+ T-cell help, as this is a stronger control point of the system.
Figure 6.

Direct failure of licensed DCs more likely contributes to HIV-1 immunopathogenesis than an indirect failure of CD4+ T-cell help. (A) Two hypotheses of DC dysfunction: Loss of CD4+ T-cell help could indirectly cause DC failure to prime CTLs (Hypothesis 1). This is represented in the model by decrease in parameter λ. Alternatively, the virus could directly impair DC function (Hypothesis 2). This is represented in the model by decrease in parameter r8L. (B) Global sensitivity analysis using the eFAST method shows that CTL priming by licensed DCs (r8L) is a significantly more sensitive control point of the system, favouring Hypothesis 2.
Discussion
The immune response to infectious disease is complex: the individual cells of the immune system are highly interactive, and the overall function of the system is a product of this multitude of interactions. The interplay between HIV-1 and the immune system is particularly complicated, as HIV-1 directly interacts with many immune cells, altering their functions, ultimately subverting the system at its core. Because of this complexity, the immune response and its interaction with HIV-1 are naturally suited to a mathematical modelling approach. Building on previous work (Bajaria & Kirschner, 2005, Bajaria et al., 2002), we present, to our knowledge, the first mechanistic model of the specific roles of DCs during HIV-1 infection. Here we focus on the dynamics within a lymph node and the role of different classes of DCs in HIV-1 dynamics. We move beyond the “Langerhan’s cell paradigm” of DC function by including LN-resident immature DCs and multiple maturation/activation states. We focus on LN, as it is the nexus of viral replication and antiviral immune response, and is historically under-studied due to difficulties in observing human lymphoid tissue. Further, the lymph node has been consistently under-appreciated in mathematical models studying HIV-1 infection and immune system dynamics.
Sensitivity and uncertainty analysis reveals which parameters and, by extension, which interactions are most important in determining the function of the virus-host system. Our analysis shows that many of the most important parameters that determine viral load levels relate to DCs. This finding illustrates the role of DCs as a central hub of interaction and information exchange during HIV-1 infection.
Others have suggested that the immune system has evolutionarily optimised “bow-tie” or “hour-glass” structural motifs, in which diverse and redundant input signals converge on a single control point. The signals are integrated and produce diverse and redundant output signals to the rest of the system. They suggest that CD4+ T-cells serve as one control point, and propose that the severity of AIDS results from HIV-1 compromising this vulnerable control point (Kitano & Oda, 2006). Similarly, our results show that DCs serve as a control point: DCs integrate signals from the pathogen and other components of the immune system, then signal other immune system cells by way of MHC molecules, co-stimulation, and cytokines.
Given the central position of DCs in immune system interactions, it is not surprising that HIV-1 has adapted to exploit them to enhance infection. We showed that this enhancement is important in maintaining chronic infection viral load levels, and that increasing this effect can induce progression to an AIDS-like state. Others have suggested that the ability of HIV to infect resting CD4+ T-cells is critical to the earliest stage of infection, as resting T-cells predominate in the peripheral tissue where HIV is first encountered (Zhang et al., 2004). Importantly, we find a similar phenomenon when HIV arrives in a lymph node: in the early stages, when activated T-helper host cells are limited, concurrent priming and infection by DCs is crucial in driving acute viremia.
We also explored the opposing anti-viral immunogenic role of DCs. We showed that T-cell help for DC licensing, priming of CTLs by licensed DCs, and CTL killing of infected cells are all critical steps in controlling chronic infection. Impairing any of these steps can cause an AIDS-like state. In particular, our model analysis suggests that the system as a whole is more sensitive to the direct failure of DCs to prime CTLs, rather than by the indirect route of failure of T-cell help to DCs. This finding has implications for the design of therapeutic vaccines and adjuvants: modulation of DC numbers and function could improve the outcome of infection, even if other immunological defects cannot be treated.
One limitation of this kind of model is that differential equations consider average rates of interaction between populations. The model cannot capture stochastic effects or spatial heterogeneity. Ongoing work includes agent-based models of immune response in a lymph node that address these issues (Riggs et al., 2008).
Clearly experimental science has made vast advances in our study of the immune response and, in particular, HIV-1 infection dynamics. The systems biology approach presented here lends an additional tool to guide our understanding of the complexities of this biological system. An integrative approach can be most useful for identifying factors that are crucial to infection outcomes, and here we have presented multiple predictions that can now be further explored in an experimental setting.
Supplementary Material
Acknowledgements
We thank Jenna Vanliere for early efforts on this work, and members of the Kirschner Lab for helpful discussions. Dawn McClemens-McBride, Anita Trichel, Julia Nyaundi, and Michael Murphey-Corb assisted with animal studies. S. Watkins, J. Devlin, and S. Albert assisted with the confocal microscopy and analysis.
Footnotes
Despite the “dendritic cell” moniker, follicular dendritic cells are functionally different from the myeloid DCs we consider here. We do not consider follicular dendritic cells in our model. Another class, plasmacytoid DCs, is notable for its high production of interferon, but are less potent antigen presenting cells, so will not be considered here.
References
- Arrighi JF, Pion M, Garcia E, Escola JM, van Kooyk Y, Geijtenbeek TB, Piguet V. DC-SIGN-mediated infectious synapse formation enhances X4 HIV-1 transmission from dendritic cells to T cells. J Exp Med. 2004;200:1279–88. doi: 10.1084/jem.20041356. [DOI] [PMC free article] [PubMed] [Google Scholar]
- Bajaria SH, Kirschner D. CTL action during HIV-1 is determined via interactions with multiple cell types. In: Tan WY, Wu H, editors. Deterministic and Stochastic Models for AIDS Epidemics and HIV Infection with Interventions. World Scientific; River Edge, New Jersey: 2005. pp. 219–254. [Google Scholar]
- Bajaria SH, Webb G, Cloyd M, Kirschner D. Dynamics of naive and memory CD4+ T lymphocytes in HIV-1 disease progression. J Acquir Immune Defic Syndr. 2002;30:41–58. doi: 10.1097/00042560-200205010-00006. [DOI] [PubMed] [Google Scholar]
- Biancotto A, Grivel JC, Iglehart SJ, Vanpouille C, Lisco A, Sieg SF, Debernardo R, Garate K, Rodriguez B, Margolis LB, Lederman MM. Abnormal activation and cytokine spectra in lymph nodes of persons chronically infected with HIV-1. Blood. 2007 doi: 10.1182/blood-2006-11-055764. [DOI] [PMC free article] [PubMed] [Google Scholar]
- Blauvelt A, Asada H, Saville MW, Klaus-Kovtun V, Altman DJ, Yarchoan R, Katz SI. Productive infection of dendritic cells by HIV-1 and their ability to capture virus are mediated through separate pathways. J Clin Invest. 1997;100:2043–53. doi: 10.1172/JCI119737. [DOI] [PMC free article] [PubMed] [Google Scholar]
- Blower SM, Dowlatabadi H. Sensitivity and Uncertainty Analysis of Complex Models of Disease Transmission: an HIV Model, as an Example. International Statistical Review. 1994;62:229–243. [Google Scholar]
- Brown KN, Trichel A, Barratt-Boyes SM. Parallel loss of myeloid and plasmacytoid dendritic cells from blood and lymphoid tissue in simian AIDS. J Immunol. 2007;178:6958–67. doi: 10.4049/jimmunol.178.11.6958. [DOI] [PubMed] [Google Scholar]
- Bukczynski J, Wen T, Wang C, Christie N, Routy JP, Boulassel MR, Kovacs CM, Macdonald KS, Ostrowski M, Sekaly RP, Bernard NF, Watts TH. Enhancement of HIV-specific CD8 T cell responses by dual costimulation with CD80 and CD137L. J Immunol. 2005;175:6378–89. doi: 10.4049/jimmunol.175.10.6378. [DOI] [PubMed] [Google Scholar]
- Cavert W, Notermans DW, Staskus K, Wietgrefe SW, Zupancic M, Gebhard K, Henry K, Zhang ZQ, Mills R, McDade H, Schuwirth CM, Goudsmit J, Danner SA, Haase AT. Kinetics of response in lymphoid tissues to antiretroviral therapy of HIV-1 infection. Science. 1997;276:960–4. doi: 10.1126/science.276.5314.960. [DOI] [PubMed] [Google Scholar]
- Chougnet C, Gessani S. Role of gp120 in dendritic cell dysfunction in HIV infection. J Leukoc Biol. 2006 doi: 10.1189/jlb.0306135. [DOI] [PubMed] [Google Scholar]
- Cohen SS, Li C, Ding L, Cao Y, Pardee AB, Shevach EM, Cohen DI. Pronounced acute immunosuppression in vivo mediated by HIV Tat challenge. Proc Natl Acad Sci U S A. 1999;96:10842–7. doi: 10.1073/pnas.96.19.10842. [DOI] [PMC free article] [PubMed] [Google Scholar]
- Stuart J. W. Cohen, Hazebergh MD, Hamann D, Otto SA, Borleffs JC, Miedema F, Boucher CA, de Boer RJ. The dominant source of CD4+ and CD8+ T-cell activation in HIV infection is antigenic stimulation. J Acquir Immune Defic Syndr. 2000;25:203–11. doi: 10.1097/00126334-200011010-00001. [DOI] [PubMed] [Google Scholar]
- Curran-Everett D. Multiple comparisons: philosophies and illustrations. Am J Physiol Regul Integr Comp Physiol. 2000;279:R1–8. doi: 10.1152/ajpregu.2000.279.1.R1. [DOI] [PubMed] [Google Scholar]
- Dioszeghy V, Benlhassan-Chahour K, Delache B, Dereuddre-Bosquet N, Aubenque C, Gras G, Le Grand R, Vaslin B. Changes in soluble factor-mediated CD8+ cell-derived antiviral activity in cynomolgus macaques infected with simian immunodeficiency virus SIVmac251: relationship to biological markers of progression. J Virol. 2006;80:236–45. doi: 10.1128/JVI.80.1.236-245.2006. [DOI] [PMC free article] [PubMed] [Google Scholar]
- Doherty PC, Christensen JP. Accessing complexity: the dynamics of virus-specific T cell responses. Annu Rev Immunol. 2000;18:561–92. doi: 10.1146/annurev.immunol.18.1.561. [DOI] [PubMed] [Google Scholar]
- Fallert BA, Reinhart TA. Improved detection of simian immunodeficiency virus RNA by in situ hybridization in fixed tissue sections: combined effects of temperatures for tissue fixation and probe hybridization. J Virol Methods. 2002;99:23–32. doi: 10.1016/s0166-0934(01)00378-0. [DOI] [PubMed] [Google Scholar]
- Geiben-Lynn R. Anti-human immunodeficiency virus noncytolytic CD8+ T-cell response: a review. AIDS Patient Care STDS. 2002;16:471–7. doi: 10.1089/10872910260351249. [DOI] [PubMed] [Google Scholar]
- Gorry PR, Sterjovski J, Churchill M, Witlox K, Gray L, Cunningham A, Wesselingh S. The role of viral coreceptors and enhanced macrophage tropism in human immunodeficiency virus type 1 disease progression. Sex Health. 2004;1:23–34. doi: 10.1071/sh03006. [DOI] [PubMed] [Google Scholar]
- Granelli-Piperno A, Golebiowska A, Trumpfheller C, Siegal FP, Steinman RM. HIV-1-infected monocyte-derived dendritic cells do not undergo maturation but can elicit IL-10 production and T cell regulation. Proc Natl Acad Sci U S A. 2004;101:7669–74. doi: 10.1073/pnas.0402431101. [DOI] [PMC free article] [PubMed] [Google Scholar]
- Haase AT. Population biology of HIV-1 infection: viral and CD4+ T cell demographics and dynamics in lymphatic tissues. Annu Rev Immunol. 1999;17:625–56. doi: 10.1146/annurev.immunol.17.1.625. [DOI] [PubMed] [Google Scholar]
- Hazenberg MD, Stuart JW, Otto SA, Borleffs JC, Boucher CA, de Boer RJ, Miedema F, Hamann D. T-cell division in human immunodeficiency virus (HIV)-1 infection is mainly due to immune activation: a longitudinal analysis in patients before and during highly active antiretroviral therapy (HAART) Blood. 2000;95:249–55. [PubMed] [Google Scholar]
- Ho DD. Viral counts count in HIV infection. Science. 1996;272:1124–5. doi: 10.1126/science.272.5265.1124. [DOI] [PubMed] [Google Scholar]
- Janeway C. Immunobiology : the immune system in health and disease. 6th Garland Science; New York: 2005. [Google Scholar]
- Janssen EM, Lemmens EE, Wolfe T, Christen U, von Herrath MG, Schoenberger SP. CD4+ T cells are required for secondary expansion and memory in CD8+ T lymphocytes. Nature. 2003;421:852–6. doi: 10.1038/nature01441. [DOI] [PubMed] [Google Scholar]
- Jekle A, Keppler OT, De Clercq E, Schols D, Weinstein M, Goldsmith MA. In vivo evolution of human immunodeficiency virus type 1 toward increased pathogenicity through CXCR4-mediated killing of uninfected CD4 T cells. J Virol. 2003;77:5846–54. doi: 10.1128/JVI.77.10.5846-5854.2003. [DOI] [PMC free article] [PubMed] [Google Scholar]
- Jin X, Bauer DE, Tuttleton SE, Lewin S, Gettie A, Blanchard J, Irwin CE, Safrit JT, Mittler J. Dramatic rise in plasma viremia after CD8(+) T cell depletion in simian immunodeficiency virus-infected macaques. J Exp Med. 1999;189:991–8. doi: 10.1084/jem.189.6.991. other authors. [DOI] [PMC free article] [PubMed] [Google Scholar]
- Kedzierska K, Crowe SM. Cytokines and HIV-1: interactions and clinical implications. Antivir Chem Chemother. 2001;12:133–50. doi: 10.1177/095632020101200301. [DOI] [PubMed] [Google Scholar]
- Kitano H, Oda K. Robustness trade-offs and host-microbial symbiosis in the immune system. Mol Syst Biol. 2006;2 doi: 10.1038/msb4100039. 2006 0022. [DOI] [PMC free article] [PubMed] [Google Scholar]
- Krathwohl MD, Schacker TW, Anderson JL. Abnormal presence of semimature dendritic cells that induce regulatory T cells in HIV-infected subjects. J Infect Dis. 2006;193:494–504. doi: 10.1086/499597. [DOI] [PubMed] [Google Scholar]
- Kwon DS, Gregorio G, Bitton N, Hendrickson WA, Littman DR. DC-SIGN-mediated internalization of HIV is required for trans-enhancement of T cell infection. Immunity. 2002;16:135–44. doi: 10.1016/s1074-7613(02)00259-5. [DOI] [PubMed] [Google Scholar]
- Lekkerkerker AN, van Kooyk Y, Geijtenbeek TB. Viral piracy: HIV-1 targets dendritic cells for transmission. Curr HIV Res. 2006;4:169–76. doi: 10.2174/157016206776055020. [DOI] [PubMed] [Google Scholar]
- Levy JA. The search for the CD8+ cell anti-HIV factor (CAF) Trends Immunol. 2003;24:628–32. doi: 10.1016/j.it.2003.10.005. [DOI] [PubMed] [Google Scholar]
- Margolick JB, Gange SJ, Detels R, O’Gorman MR, Rinaldo CR, Jr., Lai S. Impact of inversion of the CD4/CD8 ratio on the natural history of HIV-1 infection. J Acquir Immune Defic Syndr. 2006;42:620–6. doi: 10.1097/01.qai.0000223028.55080.9d. [DOI] [PubMed] [Google Scholar]
- Marino S, Hogue IB, Ray CJ, Kirschner DE. A Methodology For Performing Global Uncertainty And Sensitivity Analysis In Systems Biology. J Theor Biol. 2008 doi: 10.1016/j.jtbi.2008.04.011. in press. [DOI] [PMC free article] [PubMed] [Google Scholar]
- Matano T, Shibata R, Siemon C, Connors M, Lane HC, Martin MA. Administration of an anti-CD8 monoclonal antibody interferes with the clearance of chimeric simian/human immunodeficiency virus during primary infections of rhesus macaques. J Virol. 1998;72:164–9. doi: 10.1128/jvi.72.1.164-169.1998. [DOI] [PMC free article] [PubMed] [Google Scholar]
- McDonald D, Wu L, Bohks SM, KewalRamani VN, Unutmaz D, Hope TJ. Recruitment of HIV and its receptors to dendritic cell-T cell junctions. Science. 2003;300:1295–7. doi: 10.1126/science.1084238. [DOI] [PubMed] [Google Scholar]
- Mellman I, Steinman RM. Dendritic cells: specialized and regulated antigen processing machines. Cell. 2001;106:255–8. doi: 10.1016/s0092-8674(01)00449-4. [DOI] [PubMed] [Google Scholar]
- Meng X, Rosenthal R, Rubin DB. Comparing Correlated Correlation Coefficients. Psychological Bulletin. 1992;111:172–175. [Google Scholar]
- Murphey-Corb M, Martin LN, Rangan SR, Baskin GB, Gormus BJ, Wolf RH, Andes WA, West M, Montelaro RC. Isolation of an HTLV-III-related retrovirus from macaques with simian AIDS and its possible origin in asymptomatic mangabeys. Nature. 1986;321:435–7. doi: 10.1038/321435a0. [DOI] [PubMed] [Google Scholar]
- Pitcher CJ, Hagen SI, Walker JM, Lum R, Mitchell BL, Maino VC, Axthelm MK, Picker LJ. Development and homeostasis of T cell memory in rhesus macaque. J Immunol. 2002;168:29–43. doi: 10.4049/jimmunol.168.1.29. [DOI] [PubMed] [Google Scholar]
- Poli G, Pantaleo G, Fauci AS. Immunopathogenesis of human immunodeficiency virus infection. Clin Infect Dis. 1993;17(Suppl 1):S224–9. [PubMed] [Google Scholar]
- Reimann KA, Parker RA, Seaman MS, Beaudry K, Beddall M, Peterson L, Williams KC, Veazey RS, Montefiori DC. Pathogenicity of simian-human immunodeficiency virus SHIV-89.6P and SIVmac is attenuated in cynomolgus macaques and associated with early T-lymphocyte responses. J Virol. 2005;79:8878–85. doi: 10.1128/JVI.79.14.8878-8885.2005. other authors. [DOI] [PMC free article] [PubMed] [Google Scholar]
- Reinhart TA, Fallert BA, Pfeifer ME, Sanghavi S, Capuano S, 3rd, Rajakumar P, Murphey-Corb M, Day R, Fuller CL, Schaefer TM. Increased expression of the inflammatory chemokine CXC chemokine ligand 9/monokine induced by interferon-gamma in lymphoid tissues of rhesus macaques during simian immunodeficiency virus infection and acquired immunodeficiency syndrome. Blood. 2002;99:3119–28. doi: 10.1182/blood.v99.9.3119. [DOI] [PubMed] [Google Scholar]
- Ridge JP, Di Rosa F, Matzinger P. A conditioned dendritic cell can be a temporal bridge between a CD4+ T-helper and a T-killer cell. Nature. 1998;393:474–8. doi: 10.1038/30989. [DOI] [PubMed] [Google Scholar]
- Riggs T, Walts A, Perry N, Bickle L, Lynch JN, Myers A, Flynn J, Linderman JJ, Miller MJ, Kirschner DE. A comparison of random vs. chemotaxis-driven contacts of T cells with dendritic cells during repertoire scanning. J Theor Biol. 2008;250:732–51. doi: 10.1016/j.jtbi.2007.10.015. [DOI] [PMC free article] [PubMed] [Google Scholar]
- Ronchese F, Hermans IF. Killing of dendritic cells: a life cut short or a purposeful death? J Exp Med. 2001;194:F23–6. doi: 10.1084/jem.194.5.f23. [DOI] [PMC free article] [PubMed] [Google Scholar]
- Ruedl C, Koebel P, Bachmann M, Hess M, Karjalainen K. Anatomical origin of dendritic cells determines their life span in peripheral lymph nodes. J Immunol. 2000;165:4910–6. doi: 10.4049/jimmunol.165.9.4910. [DOI] [PubMed] [Google Scholar]
- Saltelli A, Tarantola S, Chan KP-S. A Quantitative Model-Independent Method for Global Sensitivity Analysis of Model Output. Technometrics. 1999;41:39–56. [Google Scholar]
- Schmitz JE, Kuroda MJ, Santra S, Sasseville VG, Simon MA, Lifton MA, Racz P, Tenner-Racz K, Dalesandro M. Control of viremia in simian immunodeficiency virus infection by CD8+ lymphocytes. Science. 1999;283:857–60. doi: 10.1126/science.283.5403.857. other authors. [DOI] [PubMed] [Google Scholar]
- Schoenberger SP, Toes RE, van der Voort EI, Offringa R, Melief CJ. T-cell help for cytotoxic T lymphocytes is mediated by CD40-CD40L interactions. Nature. 1998;393:480–3. doi: 10.1038/31002. [DOI] [PubMed] [Google Scholar]
- Serre K, Giraudo L, Siret C, Leserman L, Machy P. CD4 T cell help is required for primary CD8 T cell responses to vesicular antigen delivered to dendritic cells in vivo. Eur J Immunol. 2006;36:1386–97. doi: 10.1002/eji.200526193. [DOI] [PubMed] [Google Scholar]
- Shampine LF, Reichelt MW. The MATLAB ODE Suite. SIAM Journal on Scientific Computing. 1997;18:1–22. [Google Scholar]
- Shedlock DJ, Shen H. Requirement for CD4 T cell help in generating functional CD8 T cell memory. Science. 2003;300:337–9. doi: 10.1126/science.1082305. [DOI] [PubMed] [Google Scholar]
- Smith CM, Wilson NS, Waithman J, Villadangos JA, Carbone FR, Heath WR, Belz GT. Cognate CD4(+) T cell licensing of dendritic cells in CD8(+) T cell immunity. Nat Immunol. 2004;5:1143–8. doi: 10.1038/ni1129. [DOI] [PubMed] [Google Scholar]
- Sol-Foulon N, Moris A, Nobile C, Boccaccio C, Engering A, Abastado JP, Heard JM, van Kooyk Y, Schwartz O. HIV-1 Nef-induced upregulation of DC-SIGN in dendritic cells promotes lymphocyte clustering and viral spread. Immunity. 2002;16:145–55. doi: 10.1016/s1074-7613(02)00260-1. [DOI] [PubMed] [Google Scholar]
- Steinman RM. The dendritic cell system and its role in immunogenicity. Annu Rev Immunol. 1991;9:271–96. doi: 10.1146/annurev.iy.09.040191.001415. [DOI] [PubMed] [Google Scholar]
- Stilianakis NI, Dietz K, Schenzle D. Analysis of a model for the pathogenesis of AIDS. Math Biosci. 1997;145:27–46. doi: 10.1016/s0025-5564(97)00018-7. [DOI] [PubMed] [Google Scholar]
- Trepel F. Number and distribution of lymphocytes in man. A critical analysis. Klin Wochenschr. 1974;52:511–5. doi: 10.1007/BF01468720. [DOI] [PubMed] [Google Scholar]
- Turville SG, Cameron PU, Handley A, Lin G, Pohlmann S, Doms RW, Cunningham AL. Diversity of receptors binding HIV on dendritic cell subsets. Nat Immunol. 2002;3:975–83. doi: 10.1038/ni841. [DOI] [PubMed] [Google Scholar]
- von Andrian UH, Mempel TR. Homing and cellular traffic in lymph nodes. Nat Rev Immunol. 2003;3:867–78. doi: 10.1038/nri1222. [DOI] [PubMed] [Google Scholar]
- Wang JC, Livingstone AM. Cutting edge: CD4+ T cell help can be essential for primary CD8+ T cell responses in vivo. J Immunol. 2003;171:6339–43. doi: 10.4049/jimmunol.171.12.6339. [DOI] [PubMed] [Google Scholar]
- Whitmire JK, Ahmed R. Costimulation in antiviral immunity: differential requirements for CD4(+) and CD8(+) T cell responses. Curr Opin Immunol. 2000;12:448–55. doi: 10.1016/s0952-7915(00)00119-9. [DOI] [PubMed] [Google Scholar]
- Wilson NS, Villadangos JA. Lymphoid organ dendritic cells: beyond the Langerhans cells paradigm. Immunol Cell Biol. 2004;82:91–8. doi: 10.1111/j.1440-1711.2004.01216.x. [DOI] [PubMed] [Google Scholar]
- Wodarz D, Nowak MA. Mathematical models of HIV pathogenesis and treatment. Bioessays. 2002;24:1178–87. doi: 10.1002/bies.10196. [DOI] [PubMed] [Google Scholar]
- Xiao L, Rudolph DL, Owen SM, Spira TJ, Lal RB. Adaptation to promiscuous usage of CC and CXC-chemokine coreceptors in vivo correlates with HIV-1 disease progression. Aids. 1998;12:F137–43. doi: 10.1097/00002030-199813000-00001. [DOI] [PubMed] [Google Scholar]
- Yang J, Huck SP, McHugh RS, Hermans IF, Ronchese F. Perforin-dependent elimination of dendritic cells regulates the expansion of antigen-specific CD8+ T cells in vivo. Proc Natl Acad Sci U S A. 2006;103:147–52. doi: 10.1073/pnas.0509054103. [DOI] [PMC free article] [PubMed] [Google Scholar]
- Zhang ZQ, Wietgrefe SW, Li Q, Shore MD, Duan L, Reilly C, Lifson JD, Haase AT. Roles of substrate availability and infection of resting and activated CD4+ T cells in transmission and acute simian immunodeficiency virus infection. Proc Natl Acad Sci U S A. 2004;101:5640–5. doi: 10.1073/pnas.0308425101. [DOI] [PMC free article] [PubMed] [Google Scholar]
Associated Data
This section collects any data citations, data availability statements, or supplementary materials included in this article.