Abstract
The severity of diseases has often been assigned by direct observation of a patient and by pathological examination after symptoms have appeared. As we move into the genomic era, the ability to predict disease severity prior to manifestation has improved dramatically due to genomic sequencing and analysis of gene expression microarrays. However, as the severity of diseases can be exacerbated by non genetic factors, the ability to predict disease severity by examining gene expression alone may be inadequate. We propose the creation of a “clinarray” to examine phenotypic expression in the form of clinical laboratory measurements. We demonstrate that the clinarray can be used to distinguish between the severities of patients with cystic fibrosis and those with Crohn’s disease by applying unsupervised clustering methods that have been previously applied to microarrays.
Introduction
The conceptualization and application of biological methods and techniques to clinical data can help narrow the gap between basic science and their clinical relevance as espoused as the underpinnings of translational research. For the past decade, a major modality of research in the biosciences has been microarray technology. Microarrays and gene expression profiling have been used to gain valuable insight into biological processes through the measurement of tens of thousands of genes and have paved the way for novel prognostic tests and disease-subclass determination1. This platform has provided the ability to quantify gene expression under differing experimental conditions that can be used by various algorithms to classify, learn or predict biologically relevant processes.
In 1999, Todd Golub and colleagues showed that supervised clustering of microarray samples could distinguish between acute myeloid leukemia and acute lymphoblastic leukemia2. Alizadeh and colleagues used an unsupervised algorithm to discover subtypes with differing severities from samples of a single disorder, B-cell lymphomas, the difference of which can directly affect clinical outcome3. Laura van’t Veer and colleagues used supervised classification of gene expression to determine a signature that is indicative of the clinical outcome of breast cancer4. More recently, Nathan Price and colleagues used gene expression data to create a highly accurate two-gene classifier for differentiating between gastrointestinal stromal tumor and leiomyosarcomas5. The application of supervised and unsupervised algorithms to high-bandwidth gene expression data have had a direct impact at both the bench and bedside to further our understanding and treatment of singular human diseases6.
However, diseases like cystic fibrosis or Crohn’s disease, that have environmental influences or social influences or both, make classification based on microarray data imprecise7. Hence, the prediction of clinical outcome of patients with more complex diseases must examine other variables that are often considered qualitatively. An often-overlooked metric that is a direct measurement of phenotypic information is clinical laboratory data. Stoll and colleagues previously created physiological profiles from measurements in rats, but this approach has yet to be translated to humans8. While data collected during clinical care were prone to transcription errors in the past, the movement towards using electronic medical records (EMR) has improved the data quality due to elimination of transcription and omission errors9. In this paper we propose the aggregation of clinical laboratory tests gathered from EMR data on a per-patient basis to create what we term a clinarray, enabling quantitative methods traditionally used on gene expression microarrays to now be applied to clinical data.
The clinarray is a platform that allows for the quantification of phenotypic expression, across a panel of pathophysiological measurements through clinical laboratory tests, for a patient in the same way that the microarray is a platform used to quantify genome-wide expression for an experiment. We first show that we can apply unsupervised clustering methods to aggregations of clinarrays to retrieve pathophysiologically-relevant laboratory groupings. We then show that unsupervised methods used in microarray analysis can be directly applied to clinarrays to distinguish patients with severe and less-severe forms of cystic fibrosis and Crohn’s disease.
Data collection, processing and the clinarray
Quantitative clinical laboratory data, consisting of 317,338 measurements across 553 distinct lab tests, originally obtained at the Lucile Packard Children’s Hospital, were collected in a de-identified manner from the Stanford Translational Research Integrated Database Environment (STRIDE). In total, this data represented 966 patients across all ages that were diagnosed with one or more of 3 chronic diseases (Table 1). The use of de-identified clinical laboratory data in this manner was approved by the Institutional Review Board of the Stanford University School of Medicine.
Table 1.
Diseases used in our study, the number of patients in our data diagnosed with a given disease.
| Diseases | Number of Patients |
|---|---|
| Crohn’s disease | 154 |
| Cystic fibrosis | 449 |
| Down Syndrome | 366 |
We averaged the values for each individual lab test across all time points subsequent to a patient being diagnosed with any of the three diseases. Each average represents one value in what we term the clinarray. The clinarray thus represents the collection of average laboratory values for one patient.
Metric for Severity
Measurements of severity have often been derived from direct clinical or pathological examination of patients or patient samples. The drawback of using de-identified quantitative laboratory measurements is that direct indicators of disease severity are not available for use. However, as it has been previously shown that the number of blood samples drawn for laboratory tests increases for intensive care patients with more severe illness, based on APACHE III scores10, we believe that we can calculate a similar proxy for severity in using de-identified laboratory test data.
Our proxy for the severity of chronic disease is the average number of laboratory tests measured on a patient per year after their first recorded diagnosis of a disease. For each patient, we sum the number of laboratory tests measured on that patient regardless of type. We then divide by the number of years over which the patient has had laboratory measurements taken. We propose that the greater the number of laboratory tests measured on a patient per year, the more severe the form of chronic disease. We associate this severity score with each patient.
Hierarchical clustering of patients and lab tests
After construction, all clinarrays were grouped by disease type. Clinarrays for patients with more than one disorder were considered in each disorder. For each disease, we created a disease-specific matrix in which columns represented individual clinarrays and rows represented laboratory tests. Each cell represented a clinarray value for that specific patient/laboratory pair.
Normalization
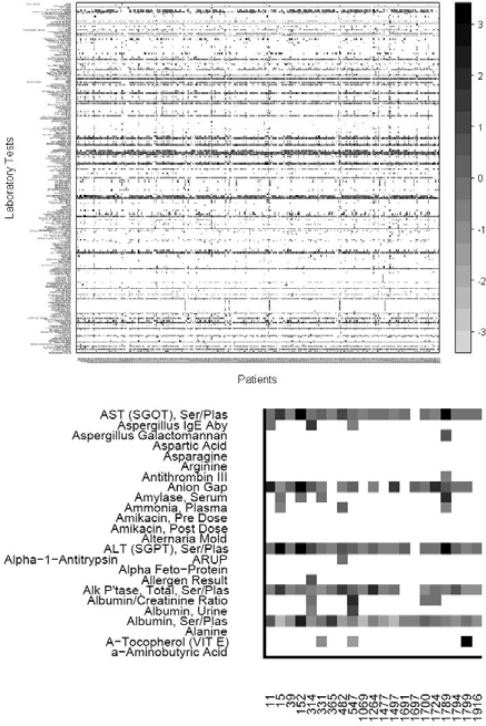
For each disease-specific matrix, we normalized the values by laboratory type. We calculated the mean measurements for each laboratory among all clinarrays. We then assigned a z-score for each cell in our matrix by calculating the number of standard deviations a particular laboratory/patient clinarray value was from their respective laboratory mean. Any values more than three standard deviations were set to three standard deviations. We then removed labs if no patients had the lab measured (Figure 1).
Figure 1.
Top: Clinarrays from patients with cystic fibrosis. Columns correspond to patients as represented by clinarrays and rows represent laboratory tests. Any available laboratory studies measured in no cystic fibrosis patients were removed. Clinarrays missing a specific laboratory test measurement are white. Gray scale indicates the degree of deviation from the mean. Bottom: Magnified portion of the matrix.
We used the normalized laboratory values to examine the coherence of applying hierarchical clustering to laboratory tests across the clinarrays. We calculated pair-wise Pearson’s correlation coefficients (cor) as a measure of similarity between laboratory tests within each disease-specific matrix11. As our disease-specific matrix is sparse, correlations between individual clinarrays may not always be possible. To rectify this, we pruned each disease-specific matrix by removing clinarrays that had fewer than three overlapping laboratory tests with all other clinarrays, thereby yielding a disease-specific matrix in which all correlations between clinarrays were meaningful. We then removed any laboratory test missing values in 20% or more clinarrays, in each disease-specific matrix.
The resulting disease-specific matrices were fairly dense. We then applied hierarchical clustering algorithms using average agglomeration methods to examine the clustering of laboratory tests and to distinguish between patients with differing disease severities. We first clustered laboratory tests across each disease-specific matrix, with a distance measure of 1 minus the correlation coefficient, where negative correlations were considered as zero. Clusters of laboratory tests were then manually examined.
We then hierarchically clustered each disease-specific matrix to search for natural subtypes of disease. The similarity of clinarrays was again computed as 1 minus the correlation coefficient, where negative correlations were considered as zero.
We then examined major subtypes for each disease by comparing the severity scores assigned to patients found in each cluster, to assess whether the major clusters significantly distinguished between patients with differing disease severities.
Results
Three disease-specific matrices were created with rows representing laboratories and columns representing clinarrays. We pruned our matrices as described above, which removed a number of patients and laboratories (Table 2).
Table 2.
Disease, the number of patients left after pruning, and the number of laboratory tests for which at least 80% of patients have measurements.
| Diseases | # patients after pruning | # of labs at 80% threshold |
|---|---|---|
| Crohn’s disease | 141 (92%) | 29 |
| Cystic fibrosis | 352 (78%) | 32 |
| Down Syndrome | 320 (87%) | 9 |
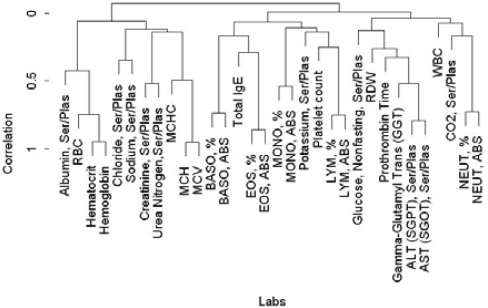
We first clustered laboratory tests using the cystic fibrosis disease matrix by correlating measurements of labs across all clinarrays to see if logical and coherent clusters could be retrieved (Figure 2). As expected, liver function tests clustered together, as did blood markers.
Figure 2.
Hierarchical cluster of laboratory tests
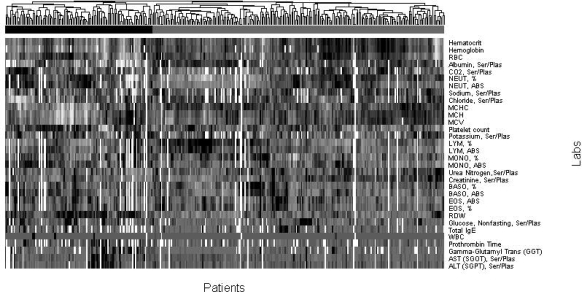
We next examined whether clustering patients by correlating clinarrays yielded significant subtypes of disease, and whether these subtypes corresponded to patients with differing disease severity. After calculating a severity score for each patient, we applied hierarchical clustering for each disease-specific matrix with average agglomeration to cluster patients based on their clinarrays as described above. (Figure 3) The resulting hierarchical clustering of patients broadly demonstrated two subtypes of disease in each of the three chronic diseases. We retrieved the severity score for all patients within both subtypes and applied the Wilcoxon test to determine if there was any significant difference between the two groups. We find that the patients in the two discovered disease subtypes have statistically significant differences in severity of cystic fibrosis (mean severe = 153.93, mean less-severe = 50.81, p = 4.29 × 10⁻⁹) as well as Crohn’s disease (mean severe = 157, mean less-severe = 100.39, p = .023). The subtypes for patients with Down Syndrome were not significantly different (p = 0.24).
Figure 3.
Clustered clinarrays for cystic fibrosis. Analysis of the two major subtypes demonstrates that patients with more severe disease clustered under the black bar and patients with less severe disease clustered under the grey bar.
Discussion
Gene expression microarrays have been used for over ten years to probe diseases and have been very successful in redefining our knowledge about their classification, severity, treatment possibilities and clinical outcome. That being said, there exist many factors of disease that can not be explained by genetics, and as an extension gene expression, alone. The etiologies of diseases such as Crohn’s disease or cystic fibrosis have not been completely elucidated and may involve complex interactions between an organism’s genetic profile and the environment. Thus, the prediction of severities for these diseases remains elusive.
We have introduced the clinarray as a platform for using clinical laboratory tests to examine phenotypic expression and have been able to apply methods traditionally used on microarrays to clinarrays. Unsupervised clustering of patient clinarrays yields disease subtypes with a significant clinical difference in disease severity. Rather than examining classification of disease subtype and disease severity from a gene expression vantage as Alizadeh and colleagues have done, we examine the same questions from the clinical vantage with promising results. The distinct patterns of laboratory tests that emerged may be helpful in designing future predictors for severity for use in the clinical environment in the same way that gene expression profiling for differences in B-cell lymphomas will inform the physician as to the best method to treat a patient.
We were unable to come up with significant distinctions for disease severity among the clusters generated for Down syndrome as a result of our unsupervised clustering. We suspect that the nine overlapping laboratory tests for Down syndrome was not enough to generate the significant clusters similar to Crohn’s disease and cystic fibrosis, where we had significantly more features available. Ideally we would want to have complete laboratory tests for all patients, but the clinical setting is only rarely conducive to gathering a comprehensive set of measurements, relying on only acquiring certain laboratory tests depending on disease.
We acknowledge the following caveats in the way we proceeded with this research. Our clinarray is currently created by taking the average lab values across a patient’s entire history as an outpatient and inpatient. This currently does not take into account any temporality of the lab measurements or the clinical setting of the measurements. We also acknowledge that our metric for severity is not ideal, but the constraints of the de-identified quantitative laboratory data we received prevented us from retrieving unbiased measurements of severity. Future work will involve creating clinarrays in a temporal manner with the resolution being limited only by the timescale of the data as well as focusing on the acquisition and validation of better severity metrics. Our pruning method, which removed clinarrays with a paucity of measurements such that correlation was impossible, allowed for a more conservative interpretation of our results. Finally, we acknowledge that the clinical relevance of such a method has yet to be determined. However, we do believe that the clinarray is not limited to laboratory data and may be applied throughout the clinical domain for areas such as radiology, pathology, and even epidemiology.
While we have only examined the clinical aspects of using the clinarray, many other possibilities exist to probe the molecular and genetic space of biological processes in a translational manner using this platform. For example, clinarrays for different diseases could be compared to gene expression measurements for the same diseases to investigate biological processes including aging that are currently studied in model organisms whose mechanisms may differ from that of humans. As more clinical and hospital environments are moving to electronic medical records, the amount of patient data available for this type of translational research will only increase. The ability for the clinarray to aggregate this data allows for previously developed methods to be applied to problems in human health and to broaden our understanding of human disease.
Author Contributions
DC and AB conceived of the idea. DC designed and analyzed the results of clinarray analysis of Crohn’s disease and cystic fibrosis patients. SW provided clinical laboratory data from the STRIDE system under supervision of PC and leadership of HL. TF ensured deidentification met institutional requirements. DC wrote the manuscript. AB revised the manuscript. All authors approved the manuscript.
Acknowledgments
The work was supported by grants from Lucile Packard Foundation for Children’s Health, National Library of Medicine (T15 LM007033), National Institute of General Medical Sciences (R01 GM079719), Howard Hughes Medical Institute, and the Pharmaceutical Research and Manufacturers of America Foundation. Stanford Medical School provides the funding for the development of the STRIDE system. Lucile Packard Children’s Hospital provides resource and ongoing operational support.
References
- 1.Butte AJ. The use and analysis of microarray data. Nature Reviews Drug Discovery. 2002;1:951–60. doi: 10.1038/nrd961. [DOI] [PubMed] [Google Scholar]
- 2.Golub TR, Slonim DK, Tamayo P, et al. Molecular classification of cancer: class discovery and class prediction by gene expression monitoring. Science. 1999 Oct 15;286(5439):531–7. doi: 10.1126/science.286.5439.531. [DOI] [PubMed] [Google Scholar]
- 3.Alizadeh AA, Eisen MB, Davis RE, et al. Distinct types of diffuse large B-cell lymphoma identified by gene expression profiling. Nature. 2000 Feb 3;403(6769):503–11. doi: 10.1038/35000501. [DOI] [PubMed] [Google Scholar]
- 4.van’t Veer LJ, Dai H, van de Vijver MJ, et al. Gene expression profiling predicts clinical outcome of breast cancer. Nature. 2002 Jan 31;:415, 530–6. doi: 10.1038/415530a. [DOI] [PubMed] [Google Scholar]
- 5.Price ND, Trent J, El-Naggar AK, et al. Highly accurate two-gene classifier for differentiating gastrointestinal stromal tumors and leiomyosarcomas. PNAS. 2007 Feb 27;104(9):3414–19. doi: 10.1073/pnas.0611373104. [DOI] [PMC free article] [PubMed] [Google Scholar]
- 6.Zerhouni EA. Translational and clinical science--time for a new vision. The New England Journal of Medicine. 2005 Oct 13;353(15):161–3. doi: 10.1056/NEJMsb053723. [DOI] [PubMed] [Google Scholar]
- 7.Guttmacher AE, Collins FS. Genomics as a probe for disease biology. The New England Journal of Medicine. 2003 Sep 4;349(10):969–74. doi: 10.1056/NEJMra012479. [DOI] [PubMed] [Google Scholar]
- 8.Stoll M, Jr, Cowley AW, Tonellato PJ, et al. A genomic-systems biology map for cardiovascular function. Science. 2001 Nov 23;294(5547):1723–6. doi: 10.1126/science.1062117. [DOI] [PubMed] [Google Scholar]
- 9.Payne PR, Johnson SB, Starren JB, Tilson HH, Dowdy D. Breaking the translational barriers: the value of integrating biomedical informatics and translational research. J Investig Med. 2005 May;53(4):192–200. doi: 10.2310/6650.2005.00402. [DOI] [PubMed] [Google Scholar]
- 10.Zimmerman JE, Seneff MG, Sun X, Wagner DP, Knaus WA. Evaluating laboratory usage in the intensive care unit: Patient and institutional characteristics that influence frequency of blood sampling. Critical Care Medicine. 1997 May;25(5):737–48. doi: 10.1097/00003246-199705000-00006. [DOI] [PubMed] [Google Scholar]
- 11.Butte AJ, Kohane IS. Unsupervised knowledge discovery in medical databases using relevance networks. Proc AMIA Symp. 1999:711–715. [PMC free article] [PubMed] [Google Scholar]


