

Abstract
Descriptions of health risks in words, numbers, and graphics can all cause comprehension problems. Our novel risk communication tool involves a game-like interaction to allow users to experience the probability of a health event. The underlying principles are grounded in cognitive theory, but laboratory demonstrations do not guarantee usefulness in the real world. To help us create software on the basis of the theory, we have developed a qualitative method incorporating elements of focus groups and scenario-based usability testing in a community-based participatory research setting in Harlem, NY. In this procedure, a facilitator mediates discussion between software developers and community participants. Using this method, we have elicited guidance from focus groups and found that the interactive game appears to carry an emotional impact that static graphics do not. Additional testing is expected to help develop a useful risk communication tool and lead to richer understanding of lay models of health risk.
INTRODUCTION
Probabilities are often used to express health risks to patients and the public in interactive health communication, decision support tools, risk assessment for health promotion, informed consent forms, and other educational and decision tools. The cognitive biases involved in manipulating probabilistic information have been well studied.1, 2 For example, a classic effect that is widely exploited in health communication is the framing effect, in which the disutility of a loss is larger than the utility of a gain of the same objective magnitude.3, 4 Another bias relevant to health decisions is the tendency to place undue weight on small probabilities, which can lead to apparent overreactions to rare events such as the chance of side effects from a vaccine.1, 5 These cognitive biases affect all patients, but poor numeracy can present an additional hurdle. Basic skills with arithmetic and probabilities vary widely among the public6, 7 and are associated with comfort with8, 9 and understanding of6, 10 quantitative risk information. Graphs can often improve reasoning about quantitative information for both expert and lay audiences,11–13 but may require graphical literacy skills and create perceptual biases, and thus do not resolve all communication issues.14, 15 For example, many members of the public cannot interpret risks presented in survival curves, and physicians make poor decisions about risks when shown data as stacked bar charts.14, 15 Utility elicitation studies show that using different methods to portray probabilistic information can lead to different utilities.16
Numbers, graphs, and textual descriptions of risk are all symbolic representations of an experience. A potential alternative to these symbolic representations is suggested by choice behavior studies showing that decisions are markedly different when people have the opportunity to learn probabilities through experience.17, 18 These studies allow subjects to learn the riskiness of a deck of cards by drawing cards, rather than by reading a description of the risks. When learning from experience, participants are less likely to show biases such as a strong preference for certainties or an overreaction to rare risks.
We are attempting to exploit these findings by developing a novel risk communication tool that provides a virtual experience of a risk rather than merely a symbolic representation of the experience. The risk communication tool invites users to play a game; to demonstrate a risk of 10%, for example, the user's icon will ‘get the disease’ in 10% of the interactions and escape in 90%. We have hypothesized that, compared to static graphics, such an interactive tool will (a) lead to more accurate risk estimates, (b) induce a stronger affective appreciation of large risks, which will more strongly motivate users to take risk-reducing actions, and (c) reduce overreactions to very small risks, which will reduce concern about very rare events. A quantitative study is planned to test these hypotheses.
However, before such a study can be conducted, it is essential that the new tool be easy to use, intuitive, and appropriately engage viewers’ mental models of risk and probability in the context of health. A demonstration of the soundness of a theoretical principle in a laboratory setting provides no guarantee that a tool developed on the basis of that principle will be useful in the real world. We are therefore conducting qualitative testing to explore users’ interpretations of health risks and to engage users in improving the acceptability and usability of the tool through iterative prototyping. The goal of this paper is to describe the prototype and how we are combining several qualitative methods in the development and assessment process. Although the project is still ongoing, we also provide examples of interim results to demonstrate pragmatic issues.
PROTOTYPE DESIGN CHOICES
In the lab experiments, 17, 18 participants were not given the numerical probability and had to draw cards from the deck to learn it. We considered it unlikely that real patients or health consumers would be willing to draw cards to learn about risk without any explanation. Instead, the prototype software described the risk and then provided virtual experience to supplement the description.
Previous literature reviews14, 15 suggested that groups of human figures could be effective in illustrating probabilities. We used an array of 1000 small human figures so that the prototype could show both relatively rare events (such as 1 in 1000) and common ones. The figures were pale green, with those affected by disease colored dark blue (with a text explanation of the color difference). These colors provided good contrast on our monitors, would be visible by users with red/green color blindness, and had no negative rhetorical implications (e.g., using black to depict disease and white to depict health might pose problems for a racially mixed audience).
The prototype showed a number (e.g., “1 in every 10”) with both an illustration and a verbal explanation (e.g., “This means that when a doctor examines 10 people, 1 of them will probably get the disease in their lifetime. And when a doctor examines 1000 people, about 100 will get the disease. So we know how many people will be affected, but not which ones.”). Text was at or below the 9th-grade reading level.
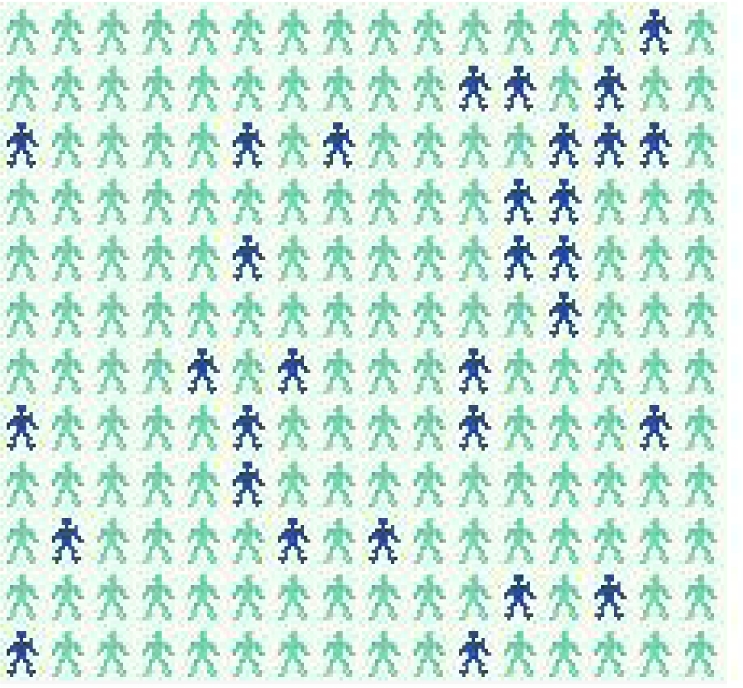
The software also showed a grid of squares and invited users to click on any square to see if the stick figure under it was affected (Figure 1). This display was designed to be similar to the card-drawing experience from the laboratory experiments. We rejected the idea of showing only one card at a time (as had been done in the experiments) because so many cards would be needed to show rare events.
Figure 1.

In this version of the prototyope, users can interact with the graphic to see if a stick figure will “get the disease” in the future, as in the image at top right, or not, as at bottom right. A Javascript random number generator ensures that each icon has the specified risk of getting the disease (in this case, 24%). The purpose is to demonstrate the size of the risk over several repetitions. The software showed 1000 figures; for clarity, we show fewer than 200 here.
DEVELOPMENT METHODS
The procedure we developed draws from three methodological perspectives: focus group research, scenario-based usability engineering, and community-based participatory research.
A. Focus groups: Focus groups allow researchers to explore individuals’ opinions, interpretations, and descriptions of subjective experiences, and also encourage group interactions that produce novel insights.19 For example, the group discussion encourages spontaneity and is conducted in naturalistic language rather than terms specified by the researcher.19 An advantage of focus groups is that transcripts can be coded and analyzed in depth using established methods (e.g., content analysis or grounded theory).
B. Scenario-based usability engineering: We have adopted Rosson and Carroll’s term for this focus group method, in which developers and users discuss a proposed system.20 In the first step, the group discusses short, highly realistic stories (“scenarios”) about a person using the system. The scenarios are then used to help in requirements analysis, information and interaction design, and analysis of prototypes as the system is developed and refined in a series of iterations. (In contrast to use cases, which create a complete description of a system’s actions in response to all possible user actions, the scenario focuses on a specific user’s experience in a specific context, using vivid naturalistic language to engage developers and users.20) From a social science perspective, this method is typically very informal. The discussions are not transcribed or coded; instead the developers integrate new ideas immediately into revisions. The strengths of this method are in its dialog between developers and users, its use of vivid anecdotal stories to stimulate ideas, and its focus on a specific system or software. In our modification of this method, we introduced scenario-based usability methods into a focus group with a trained facilitator. This encourages researcher-participant dialog while also allowing exploration of larger social and personal issues and perspectives; qualitative methods will then be used to analyze the transcripts.
C. Community-based participatory research: Members of minority communities are often distrustful of academic research, in which researchers visit the community to recruit subjects but do not provide the fruits of the research to that community. By contrast, in community-based participatory research, community members partner with academic researchers and are involved in all stages of the research process, from identifying research topics and approving projects to disseminating results in the community.21, 22 The goal of community-based participatory research is to develop partnerships between researchers and community members to solve community problems. We found unexpected resonance between this perspective and that of usability testing, in which the researcher and the user work together to identify problems and create usable products. (Scenario-based usability testing methods have even been called ‘participatory design’.23) We developed a partnership with the Harlem Health Promotion Center (HHPC), a community-based participatory research center in Harlem, NY, funded by the Centers for Disease Control and Prevention. Through its affiliations with community groups, HHPC has helped us reach health consumers who might not ordinarily participate in academic research. To ensure that this research will benefit the community, results from the focus groups are shared with the HHPC, which is studying technology use in Harlem and developing a health web portal through its Digital Partners Project, and a version of the risk communication tool will be provided for the portal.
Combined qualitative method: The combined method is a scenario-based discussion between users and a developer, moderated by a trained facilitator who informs the group that she is acting as a mediator between the two sets of stakeholders, not as a researcher. Each member of the group is provided with a laptop, and the facilitator’s laptop is projected on the wall to allow her to do demonstrations. The number of participants is small (5 or fewer) to allow room for the laptops and projector on the conference table and also to allow a single developer to set up, break down, and handle the inevitable glitches during use. The facilitator is a public health worker with a master’s degree in public health and training in social research methods; she is a regular user of the Internet but has no informatics training. The facilitator guides discussion on the scenarios and provides questions and topics for discussion. The recorded discussions are transcribed and will be coded for a content analysis on such themes as personal risk, physician-patient communication, preferred resources and methods for obtaining health information, Harlem-specific health issues, and Internet and computer use. The groups have discussed two scenarios, a “choice scenario” that is similar to the prompt used in several medical choice studies,5 and a “personalized risk scenario” modeled after stimuli used in recent studies of graphics.24, 25
Choice scenario: Joan has just gone to see her doctor. Her doctor said that there was a new kind of very serious infectious disease in town. If you catch it, you will feel so terrible that you will have to take a week off from work and stay in bed. The doctor says you have a 1 in 10 chance of catching this disease. Luckily, there is a vaccine against it. But the vaccine sometimes has side effects. The most serious side effect is a nerve problem called GBS that can temporarily paralyze some of your muscles. After a few weeks, this side effect wears off. There is a 1 in 1000 chance that if you get this particular vaccine, you will get the side effect. Joan is wondering if she understands the risks and is trying to decide whether she should get the vaccine. She is not really sure she understands what the doctor means by “1 in 10 chance” or “1 in 1000 chance.” But she felt embarrassed admitting that she didn’t understand, so she didn’t ask for more explanation.
Personalized risk scenario: Michelle has just gone to see her doctor to get some allergy medicine. While she was there, she asked the doctor about breast cancer because she is very worried about breast cancer. The doctor examined her and asked her a series of questions about her age, whether anybody in her family had ever had breast cancer, and other questions about her health and her habits. Then the doctor said that for Michelle, heart disease was a greater risk than breast cancer was. The doctor told Michelle that her personal risk of developing heart disease in her lifetime was 46%, and her personal risk of getting breast cancer was 9%. He also recommended some things she could do to reduce her risk. Michelle is not sure she really understands what the doctor means by “risk of 46%” or “risk of 9%.” But she didn’t ask for more explanation.
Participants discuss the scenario and brainstorm about ways of explaining the risks to ‘Joan’ or ‘Michelle.’ They are invited to look at and discuss three visuals for illustrating the number: a bar chart, a group of stick figures with the blue figures randomly arranged (Figure 2A), a group of stick figures with the affected ones grouped together (Figure 2B).
Figure 2A.
Randomly arranged stick figure illustration.
Figure 2B.
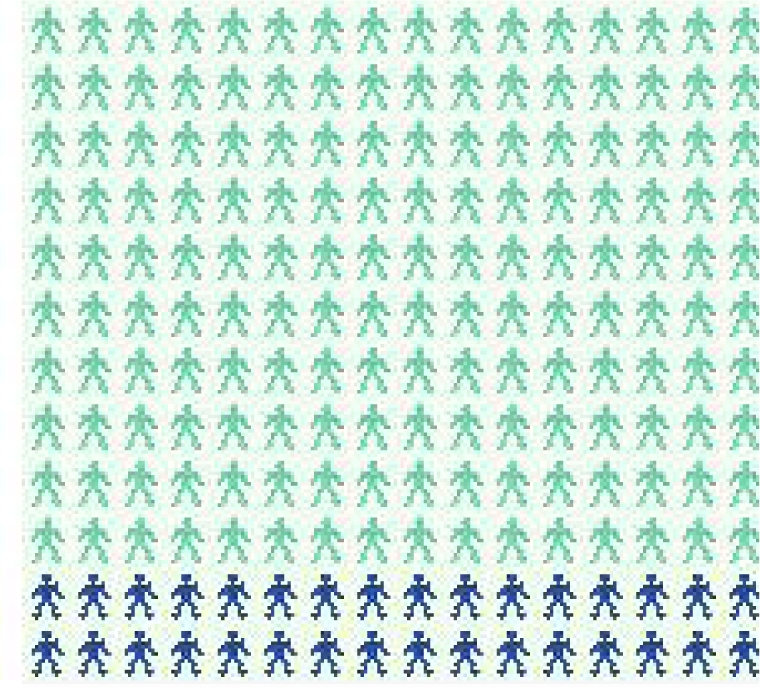
Grouped stick figure illustration. The actual picture had 1000 figures; for clarity, this one has <200.
They then use laptops to explore the risk communication software and are invited to discuss their opinions, reactions, and preferences. The groups are also invited to view the HHPC Web Portal under development and provide feedback and suggestions.
PRELIMINARY RESULTS
Although the purpose of this paper is to describe the methods, we provide examples of interim results to demonstrate the application of the methods and illustrate some pragmatic issues. The combined qualitative method has been applied in three small focus groups with a total of 6 women and 3 men (4 black, 3 Hispanic/Latino, 2 white). The project was approved by the Columbia IRB and all participants gave written informed consent. The combined method has been successful in establishing a collaborative dynamic within each group. Because the study supports the development of the HHPC Web Portal as a community resource, participants feel a sense of ownership and are eager to engage in usability discussions about ways to improve the tool.
The first groups revealed logistical hurdles. For example, the no-show rate ranged from 20% to 70% despite reminder telephone calls. In one group, only 2 of 7 scheduled participants arrived, but as neither wanted to reschedule, we proceeded with the group and retain the results in our analysis. Pacing is also an issue: each group was scheduled to discuss both scenarios as well as view the HHPC Web Portal, but each group has run out of time, so only one scenario is now used per group. Analysis of the transcripts is ongoing, and two more focus groups are planned, but some preliminary themes are apparent.
▪ Physician-patient communication problems: In each scenario, a person receives health information from her physician that she does not fully understand. Participants have responded eagerly to these stories and have offered similar ones about their own experiences or those of their friends and family. Many agreed that it is difficult to ask for more information while speaking with a doctor, and several said doctors are too busy to explain things in depth. When participants said they would seek additional information elsewhere, the most common source mentioned was the Internet.
▪ Simplicity versus complexity: When offered a choice of several graphics to explain the risk of disease, many participants initially wanted minimal text and preferred simpler graphics (e.g., a bar chart instead of an array of stick figures, and a static graphic instead of the computer game). However, in some cases, as discussion progressed and the participants played with the computer game, many people changed their preference to a more complicated graphic or suggested additional text.
▪ Emotional impact: Several participants, when playing with the computer game, expressed strong dismay when their icon ‘got the disease,’ whereas none of the participants expressed any emotional reaction to the graphics or the textual (numeric) description of the risk. The game may have conveyed an emotional dimension that was absent from the other textual and visual depictions. This impact was very negative in some cases; one participant said she did not want to play the game again.
▪ Importance of text: Users have tended to focus strongly on improving the textual descriptions and their fit to the visuals. For example, when a risk described as “1 in every 10” was depicted with 100 blue figures scattered among a group of 1000, some participants were confused, saying they expected to see 1 blue figure, not 100. They suggested adding text so that a later version read: “This means that when a doctor examines 10 people, 1 of them will probably get the disease in their lifetime. And when a doctor examines 1000 people, about 100 will get the disease.”
▪ Computer familiarity: One user with little computer experience found the tool confusing; one found it too simplistic.
DISCUSSION
The combined qualitative method has produced a fruitful collaborative relationship for development of a new risk communication tool on the basis of cognitive psychology principles. Using this method, we can pilot a variety of versions of the software and make changes suggested by potential users. The method will be applied to additional focus groups as this project is completed, and transcripts will be analyzed. In addition, feedback from the first focus groups has already been incorporated in two revisions for iterative prototyping. Preliminary examination of the qualitative data suggests some support for our hypotheses that the interactive method would have affective impact, but confirmation awaits the completion of the qualitative study as well the quantitative study now under development. Our participants’ preference for risk-reducing information instead of risks alone is consistent with health communication research about the importance of pairing risk communication with potential risk-reducing actions.25, 26 The fact that these issues arose in our focus group discussions after the computer software was introduced supports the possibility that the emotional impact of the game was larger than any impact of the other risk communication modalities. Additional focus group work and complete analysis of the transcripts is expected to help in the transition from laboratory finding to useful software as well as lead to richer understandings of lay models of risk and probability, technology use, and health issues.
Acknowledgments
We are grateful for the assistance of Connie Chan (coder), Nisha Beharie (group moderator), Elke Weber (consultant), and the Harlem Health Promotion Center. Jessica Ancker is supported by NLM predoctoral fellowship T15-LM007079. The study is supported by the Agency for Healthcare Research and Quality (5-R03-HS016333).
REFERENCES
- 1.Tversky A, Kahneman D. Judgment under uncertainty: Heuristics and biases. Science. 1974;(185):1124–30. doi: 10.1126/science.185.4157.1124. [DOI] [PubMed] [Google Scholar]
- 2.Slovic P. Perception of risk. Science. 1987;(236):280–5. doi: 10.1126/science.3563507. [DOI] [PubMed] [Google Scholar]
- 3.Rothman AJ, Salovey P. Shaping perceptions to motivate healthy behavior: The role of message framing. Psychol Bull. 1997;121(1):3–19. doi: 10.1037/0033-2909.121.1.3. [DOI] [PubMed] [Google Scholar]
- 4.Schneider T, S P, Apanovitch A, et al. The effects of message framing and ethnic targeting on mammography use among low-income women. Health Psychol. 2001;20:256–66. doi: 10.1037//0278-6133.20.4.256. [DOI] [PubMed] [Google Scholar]
- 5.Weinstein ND, Sandman PM, Hallman WK. Testing a visual display to explain small probabilities. Risk Anal. 1994;14(6):895–6. doi: 10.1111/j.1539-6924.1994.tb00053.x. [DOI] [PubMed] [Google Scholar]
- 6.Schwartz L, Woloshin S, Black W, et al. The role of numeracy in understanding the benefit of screening mammography. Ann Intern Med. 1997;127(11):966–72. doi: 10.7326/0003-4819-127-11-199712010-00003. [DOI] [PubMed] [Google Scholar]
- 7.Lipkus IM, Samsa G, Rimer BK. General performance on a numeracy scale among highly educated samples. Med Decis Making. 2001;21:37–44. doi: 10.1177/0272989X0102100105. [DOI] [PubMed] [Google Scholar]
- 8.Gurmankin AD, Baron J, Armstrong K. The effect of numerical statements of risk on trust and comfort with hypothetical physician risk communication. Med Decis Making. 2004;24(3):265–71. doi: 10.1177/0272989X04265482. [DOI] [PubMed] [Google Scholar]
- 9.Weinstein ND, Atwood K, Puleo E, et al. Colon cancer: Risk perceptions and risk communication. J Health Comm. 2004;9(1):53–65. doi: 10.1080/10810730490271647. [DOI] [PubMed] [Google Scholar]
- 10.Grimes DA, Snively GR. Patients' understanding of medical risks: Implications for genetic counseling. Obstet Gynecol. 1999;93:910–4. doi: 10.1016/s0029-7844(98)00567-5. [DOI] [PubMed] [Google Scholar]
- 11.Cosmides L, Tooby J. Are humans good intuitive statisticians after all? Rethinking some conclusions from the literature on judgment under uncertainty. Cognition. 1996;58:1–73. [Google Scholar]
- 12.Tufte ER. The Visual Display of Quantitative Information. 2nd ed. Cheshire (CT): Graphics Press; 2001. [Google Scholar]
- 13.Cleveland WS, McGill R. Graphical perception and graphical methods for analyzing scientific data. Science. 1985;229:828–33. doi: 10.1126/science.229.4716.828. [DOI] [PubMed] [Google Scholar]
- 14.Ancker JS, Senathirajah Y, Kukafka R, et al. Design features of graphs in health risk communication: A systematic review. J Am Med Inform Assoc. 2006;13(6):608–18. doi: 10.1197/jamia.M2115. [DOI] [PMC free article] [PubMed] [Google Scholar]
- 15.Lipkus IM, Hollands JG. The visual communication of risk. JNCI Monographs. 1999;25:149–63. doi: 10.1093/oxfordjournals.jncimonographs.a024191. [DOI] [PubMed] [Google Scholar]
- 16.Clarke A, Goldstein M, Michelson D, et al. The effect of assessment method and respondent population on utilities elicited for Gaucher disease. Qual Life Res. 1997;6(2):169–84. doi: 10.1023/a:1026446302100. [DOI] [PubMed] [Google Scholar]
- 17.Hertwig R, Barron G, Weber EU, et al. Decisions from experience and the effect of rare events in risky choice. Psychological Science. 2004;15(8):534–39. doi: 10.1111/j.0956-7976.2004.00715.x. [DOI] [PubMed] [Google Scholar]
- 18.Weber EU, Shafir S, Blais AR. Predicting risk sensitivity in humans and lower animals: Risk as variance or coefficient of variation. Psychol Rev. 2004;111(2):430–45. doi: 10.1037/0033-295X.111.2.430. [DOI] [PubMed] [Google Scholar]
- 19.Morgan DL. Focus Groups as Qualitative Research. Second ed. Thousand Oaks (CA): Sage Publications; 1997. [Google Scholar]
- 20.Rosson MB, Carroll JM. Usability engineering: scenario-based development of human-computer interaction. San Francisco: Morgan Kaufmann; 2002. [Google Scholar]
- 21.Israel B, Schulz A, Parker E, et al. Review of community-based research: assessing partnership approaches to improve public health. Annu Rev Public Health. 1998;19:173–202. doi: 10.1146/annurev.publhealth.19.1.173. [DOI] [PubMed] [Google Scholar]
- 22.Higgins DL, Metzler M. Implementing community-based participatory research centers in diverse urban settings. J Urban Health. 2001;78(3):488–94. doi: 10.1093/jurban/78.3.488. [DOI] [PMC free article] [PubMed] [Google Scholar]
- 23.Muller MK. Retrospective on a year of participatory design using the PICTIVE technique. Paper presented at: Proceedings of Human Factors of Computing Systems: CHI '92; 1992; New York. [Google Scholar]
- 24.Schapira MM, Nattinger AB, McHorney CA. Frequency or probability? A qualitative study of risk communication formats used in health care. Med Decis Making. 2001;21:459–67. doi: 10.1177/0272989X0102100604. [DOI] [PubMed] [Google Scholar]
- 25.Royak-Schaler R, Blocker D, Yali A, et al. Breast and colorectal cancer risk communication approaches with low-income African-American and Hispanic women: implications for healthcare providers. J Natl Med Assoc. 2004;96(5):598–608. [PMC free article] [PubMed] [Google Scholar]
- 26.Sandman P, Weinstein ND, Miller P. High risk or low: how location on a ‘risk ladder’ affects perceived risk. Risk Anal. 1994;14:35–45. doi: 10.1111/j.1539-6924.1994.tb00026.x. [DOI] [PubMed] [Google Scholar]