Abstract
We present a pathological image analysis system for the computer-aided prognosis of neuroblastoma, a childhood cancer. The image analysis system automatically classifies Schwannian stromal development of pathological tissues and determines the grade of differentiation. Due to the demanding computational cost of processing large digitized slides, the system was implemented on a cluster of computers with automated load balancing within a multi-resolution framework. In our experiments, the overall accuracies for stromal classification and the grade of differentiation were 96.6% and 95.3%, respectively. Additionally, the multi-resolution framework reduced the run time of the single resolution approach by 53% and 34% on average for stromal classification and grade of differentiation, respectively. For these two cases, parallelization on a 16-node cluster reduced the sequential run time by 92% and 88% on average. Accuracy and efficiency of these techniques are promising for the development a computer-assisted neuroblastoma prognosis system.
Introduction
Neuroblastoma, a childhood cancer, is the most aggressive and unfavorable type of Peripheral Neuroblastic Tumors [1]. Every year, about 650 children are diagnosed with neuroblastoma in the United States. The diagnosis, prognosis, and treatment planning depend heavily on the classification of tumor samples. The neuroblastoma classification system developed by Shimada et al. [2] follows a well-formed decision tree, where each node keeps information about a binary observation (e.g., absent/present) or a comparison with a threshold value (e.g., greater or less than 50%). Traversal of the decision tree, thus, requires the identification and quantification of a sequence of key histological features. We are developing a prototype computerized image analysis system to assist pathologists in tissue classification for the prognosis of neuroblastoma. There is a need to process these images in an efficient way, not only due to the large image sizes (typically, a 50,000 by 50,000 color image per slide and 75 GB of storage space when uncompressed), but also computational complexities of the developed image analysis algorithms. Hence, we are also developing novel computational tools and techniques to facilitate efficient processing of these images.
The neuroblastoma classification system involves three morphological analysis components: 1) characterization of stroma regions, 2) determination of the grade of differentiation, and 3) the relative count of the mitosis-karryorrhexis index. In this work, we are addressing the first two of these components.
Methods
Data Source:
Input images used for this study are haematoxylin and eosin (H&E) stained tissue samples collected with an exempt protocol from the Ohio State University IRB. The samples are digitized using a ScanScope T2 Aperio digitizer at 40x magnification and stored in the red-green-blue (RGB) color format. Each slide is compressed at approximately 1:40 compression ratio in the JPEG format.
Stroma Classification:
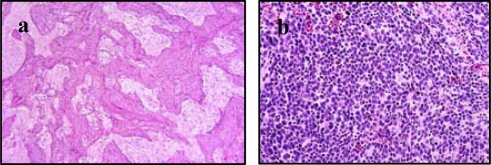
For stroma classification, tissue images are classified into stroma-rich and stroma-poor regions as specified in the Shimada classification system. Figure 1 (a) is an example of a stroma-rich tissue, characterized by the growth of Schwannian and other supporting elements. Stroma-poor tissue (Figure 1(b)) is characterized by diffuse growth of neuroblastic cells surrounded by fibrovascular tissue.
Figure 1.
Example images of (a) stroma-rich and (b) stroma-poor tissue.
We initially implemented an image analysis system for stroma classification using a single-resolution approach, combining second order statistical features with another feature called local binary patterns (LBP) [3]. Second order statistical features are extracted using co-occurrence matrices that define the spatial distribution of pixel intensities [4]. Being invariant to rotation and any local or global intensity change, the LBP is a discriminative and easy-to-implement texture feature developed by Ojala et al. [3] We combined statistical features obtained from the co-occurrence matrix representation with LBP features using the Bhattacharyya distance [3].
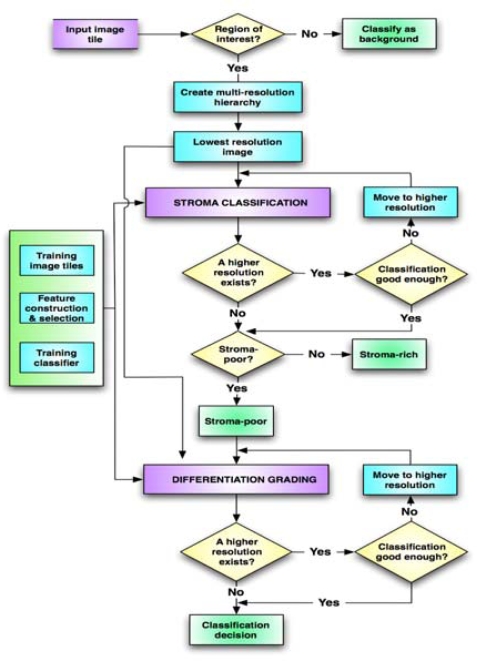
To improve the image processing time, we implemented a multi-resolution approach (the flowchart shown in Figure 2). In this approach, the classification of each image tile starts first with the lowest resolution representation of the image tile obtained using the Gaussian pyramid approach introduced in [5]. If a decision can be made at this resolution, then the analysis stops. Otherwise, a higher resolution version of the image is analyzed. This process mimics how a pathologist adjusts the magnification of the microscope based on the level of detail needed to analyze a particular portion of a slide.
Figure 2.
The flowchart for the developed multi-resolution neuroblastoma image analysis system.
The classification decisions are made based on a machine learning algorithm that operates on features extracted from the image. As the classifier, we use a modified k-nearest neighbor (KNN) algorithm [6] that maintains the flexibility so that decision criteria are much stricter at lower resolutions than at higher resolutions. Typically, in a KNN classifier, training samples are mapped onto a multi-dimensional feature space. Then, for each test sample, the similarity of the test sample to the training samples is computed via the Euclidean distance metric. The label of the class that has more than n similar training samples among the k nearest samples is assigned as the predicted class label for the test sample. In our implementation, we used k = 11 as the number of neighbors; the number of majority samples was set to n = 10 for the lowest resolution, and n was decreased by one at each finer resolution level.
In training the classifier, we constructed a training set consisting of 250 stroma-rich and 250 stroma-poor image tiles (896x896 in size), randomly cropped from two whole neuroblastoma images. After the training process, we applied the proposed method on a separate set of four whole-slide neuroblastoma images to evaluate the classification accuracy.
Grade of Differentiation:
Grade of neuroblastic differentiation, including undifferentiated (UD), poorly-differentiated (PD), and differentiating (D) subtypes, is another criterion used to categorize the neuroblastic tumors. In this work, we also developed an automated classification system that uses the multi-resolution framework to determine the grade of neuroblastic differentiation.
In both training and testing phases, the procedure begins with image decomposition, where each image is decomposed into a bank of down-sampled versions. Starting at the lowest resolution level, the following image analysis steps are carried out: segmentation, feature construction, dimensionality reduction in a feature space using Linear Discriminant Analysis (LDA), the M-ary Bayesian classification and a resolution control decision [7].
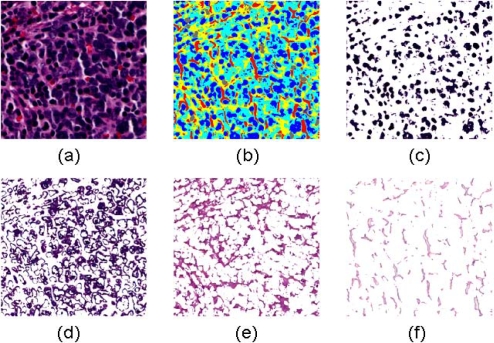
For image segmentation, we proposed a novel approach that makes use of the Fisher-Rao criterion as the kernel of the generic Expectation Maximization algorithm, named as the EMLDA algorithm [8]. In Figure 3, a set of segmentation results for a typical image tile in the undifferentiated class is shown, where four fundamental components including nuclei, cytoplasm, neuropil, and background are segmented.
Figure 3.
The components segmented by EMLDA in a typical image from the undifferentiated class are shown. (a) Original image, (b) Partitioned image shown in color, (c) Nuclei, (d) Cytoplasm, (e) Neuropil, (f) Background.
The decision rule that controls the transition from lower to higher resolution level is established using pre-determined confidence regions associated with the class-conditional probability density functions estimated from the training data. Assuming that the underlying distribution associated with each class in the lower-dimensional feature subspace, reduced by the LDA, is Gaussian, the similarity between the feature point associated with the testing image and that of the training data can be measured using the Mahalanobis distance [6]. If testing feature data is not within a confidence region associated with the class determined by the M-ary Bayesian classifier, i.e., the Mahalanobis distance is greater than a threshold, the same image processing steps are then applied to the image at the next higher resolution.
Cluster Implementation:
The classification systems we proposed for discriminating the grade of neuroblastic differentiation and analysis of Schwannian stromal development achieve satisfactory classification accuracies. Unfortunately, the large sizes of the tissue images when coupled with the complexity of our algorithms require vast amounts of computation, resulting in long execution times. This makes classification of these images on sequential systems an unviable option as processing a single whole slide image typically takes several hours on a state-of-the-art PC. Hence, a powerful software/hardware infrastructure is essential for this particular, large-scale image processing problem to meet its computationally demanding needs.
To achieve practical and acceptable time costs for analyzing whole-slide images, we developed a parallel image processing infrastructure based on the DataCutter framework [9]. The software, developed on a cluster of PCs, has a master-client architecture, and involves multiple master applications and a number of client applications that cooperate with the masters. The master applications are responsible for partitioning the tissue images into fixed size image tiles. At the very beginning of the execution, the masters communicate the generated image tiles to the client applications for further processing. In the current implementation, the assignment of the tiles to the clients is performed in a round-robin fashion to balance the processing loads of the clients. The tiles are cached at the local storages of the clients. Each client runs a local Matlab application, which fetches the cached image tiles from the disk and executes the classification algorithms over the image tiles. The classification results are stored on disks and passed to the master applications after all tiles are processed, where they are merged to generate label maps that show the classification results of entire images.
This parallel software infrastructure is exposed as a Grid service that facilitates sharing of image datasets and algorithms on a common platform among multiple developers [10]. The service provides remote users the functionality to perform common database operations (such as query, retrieve, upload, and delete) on a common data/algorithm repository over the Grid [11]. Moreover, in order to relieve the users from the burden of interacting with the details of job submission, a client GUI is used. This GUI supports remote access to the above-mentioned operations as well as remote job configuration and submission.
Results
Stroma Classification Results:
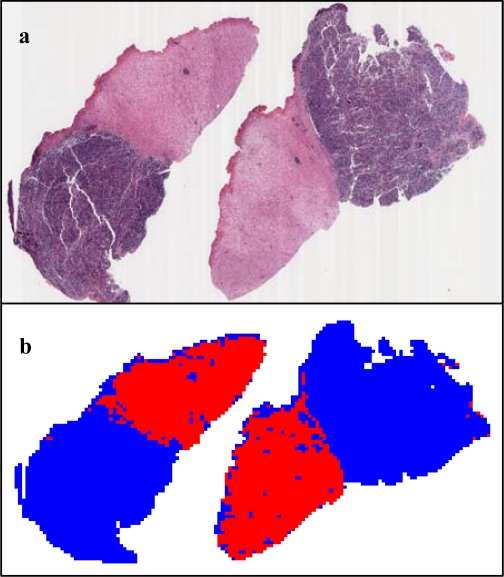
The proposed stroma classification method was tested on four whole-slide neuroblastoma images with a total of 16,732 tiles and achieved a classification accuracy of 96.6±2.3%. Figure 4 shows the classification result for the largest slide of the four testing images. This whole-slide neuroblastoma image, with size 2.8 GB, contains both stroma-rich and stroma-poor tissue and consists of 10,565 tiles of 896x896 pixels.
Figure 4.
(a) H&E stained image containing both stroma-rich and stroma-poor tissue (b) computerized labels for stroma-rich (red) and stroma-poor (blue) regions.
Parallelization is performed on a 16-node Linux cluster, where each node is equipped with dual 2.4 GHz Opteron 250 processors, 8 GB of RAM, and two 250 GB SATA disk drives. With the results of each slide image (such as I1, I2, I3 and I4) reported in one row, Table 1 shows the time costs of all the experiments conducted with different resolution approaches and different numbers of compute nodes.
Table 1.
Computational costs (in minutes) associated with different combinations of resolution and computer cluster setups for stroma classification.
| Single-Res. & 1 node | Single-Res. & 16 nodes | Multi-Res. & 1 node | Multi-Res. & 16 nodes | |
|---|---|---|---|---|
| I1 | 894.9 | 66.1 | 434.2 | 36.4 |
| I2 | 227.6 | 19.8 | 110.3 | 12.1 |
| I3 | 731.7 | 53.0 | 353.4 | 28.3 |
| I4 | 1080.2 | 71.8 | 455.0 | 39.2 |
The resulting multi-resolution framework reduced the run time by 53%, on average, as compared to a single resolution run. The parallelization on a 16-node cluster reduced the sequential run time by 92% on average as compared to the single node computation.
Grade of Differentiation Results:
The inputs to our grading system are 512x512 image tiles cropped from tumor images. This makes processing the data more tractable given the limited computational capability of the hardware. For training purposes, 387 image tiles were extracted at random from three whole-slide images, one from each of the three grading classes. Additionally, a different set of three tumor slides, one from each category classified by an expert pathologist, serves as the testing slides. The resulting computer classification results are reported in Table 2, where the column labels represent the computer recognition percentages and row markers indicate the grade of differentiation diagnosed by the pathologist. Correspondingly, the numbers of analyzed tiles from these three whole-slide images are 9,108, 17,182 and 20,636. The overall classification accuracy is found to be about 95.3%.
Table 2.
Classification results associated with the three tumor slides from UD, PD, and D classes.
| UD (%) | PD (%) | D (%) | |
|---|---|---|---|
| UD | 99.28 | 0.45 | 0.27 |
| PD | 7.98 | 88.46 | 3.55 |
| D | 0.73 | 0.06 | 99.20 |
The multi-resolution approach and the parallelization on a compute cluster considerably improved the computational efficiency, which is important for practical clinical applications. The resulting processing time associated with each testing slide, when computed with the help of the presented computer cluster (using various combinations of multi-/single-resolution approach and multi-(16)/single-node cluster), are shown in Table 3. Experiments show that the multi-resolution framework reduces the run time by 34%, on average, when compared to a single resolution run, (i.e. column 1 vs. 3), and that parallelization on a 16-node cluster reduces the run time by an average of 88%, in contrast to a single-node cluster (i.e., column 1 vs. 2). Additionally, when the multi-resolution approach and multiple nodes (16 in our experiments) are used, the resulting time costs are significantly less than those obtained using either the single-resolution approach or the single compute node.
Table 3.
For the three testing images, the resulting computational costs associated with different combinations of resolution and computer cluster setups are shown (in minutes).
| Single-Res. & 1 node | Single-Res. & 16 nodes | Multi-Res. & 1 node | Multi-Res. & 16 nodes | |
|---|---|---|---|---|
| UD | 2585.7 | 287.0 | 1178.0 | 36.1 |
| PD | 2855.1 | 400.2 | 2228.1 | 70.5 |
| D | 5075.9 | 472.1 | 3676.2 | 266.7 |
Due to the round-robin distribution of image tiles on the client nodes, satisfactory load distributions are naturally achieved on our parallel image processing system in terms of the number of pixels and tiles processed by each client node. Experiments show that the system becomes more efficient in terms of client utilization as the number of masters in the system is increased. However, some load imbalance may be observed in terms of the execution time due to the facts that (1) the tiles classified as background are not processed at all, and (2) the tiles that cannot be classified at low resolutions require further processing at higher resolutions, adding a certain degree of uncertainty for load balancing. We are currently working on a demand-driven approach, where the clients will request the tiles from the master on a demand-driven basis to eliminate this deficiency.
Conclusion
In this paper, we present a computerized neuroblastoma classification system that yields promising classification accuracies both in stromal development and the grade of neuroblastic differentiation. A multi-resolution framework, following a coarse-to-fine hierarchical resolution strategy, is constructed to emulate how pathologists review slides. As a result, the computational efficiency is significantly improved. Furthermore, a parallel computational infrastructure is used to accelerate the execution. When fully developed, this system can help clinical pathologists with their prognostic decisions by providing quantitative information about the stroma content as well as the grade of differentiation. This may help reduce the inter- and intra-reader variability and perception errors associated with human visual evaluation of large numbers of slides. The multi-resolution approach as well as some of the features developed for this work can be tailored to other similar applications without significant effort. In future work, we will investigate different ways of feature extraction, apply new tests using different classifiers on a larger image database, and develop new techniques for other histopathological image analysis applications.
Acknowledgments
The authors would like to thank Hiroyuki Shimada, MD, PhD for providing the images, the ground truth, and his helpful suggestions. This work was supported in part by the National Institutes of Health NIBIB BISTI P20-EB000591, and The National Science Foundation (grants CNS-0426241, CNS-0615155 CNS-0509326).
References
- [1].Shimada H, Chatten J, Newton WA, Jr, Sachs N, Hamoudi AB, Chiba T, Marsden HB, Misugi K. “Histopathologic prognostic factors in neuroblastic tumors: definition of subtypes of ganglioneuroblastoma and an age-linked classification of neuroblastomas,”. J Natl Cancer Inst. 1984 Aug;73:405–16. doi: 10.1093/jnci/73.2.405. [DOI] [PubMed] [Google Scholar]
- [2].Shimada H, Ambros IM, Dehner LP, Hata J, Joshi VV, Roald B, Stram DO, Gerbing RB, Lukens JN, Matthay KK, Castleberry RP. “The International Neuroblastoma Pathology Classification (the Shimada system),”. Cancer. 1999 Jul 15;86:364–72. [PubMed] [Google Scholar]
- [3].Ojala T, Pietikainen M, Maenpaa T. “Multiresolution Gray-Scale and Rotation Invariant Texture Classification with Local Binary Patterns,”. IEEE Trans. on PAMI. 2002;24:17. [Google Scholar]
- [4].Tuceryan M, Jain AK. The Handbook of Pattern Recognition and Computer Vision (2nd Edition) 2 ed. World Scientific Publishing Co; 1998. “Texture Analysis,”; p. 41. [Google Scholar]
- [5].Adelson EH, Anderson CH, Bergen JR, Burt PJ, Ogden J. “Pyramid methods in image processing,”. RCA Engineer. 1984;29:9. [Google Scholar]
- [6].Fukunaga K. Introduction to statistical pattern recognition. Boston, Mass: Academic press; 1990. [Google Scholar]
- [7].Kong J, Shimada H, Boyer K, Saltz JH, Gurcan M. “A new multi-resolution analysis framework for classifying grade of neuroblastic differentiation,”. IEEE Conf. CVPR, 2007, Submitted; 2007. [Google Scholar]
- [8].Kong J, Shimada J, Boyer K, Saltz JH, Gurcan M. “Image analysis for automated assessment of grade of neuroblastic differentiation,”. IEEE International Symposium on Biomedical Imaging 2007; 2007. [Google Scholar]
- [9].Beynon M, Kurc TM, Catalyurek UV, Chang C, Sussman A, Saltz JH. “Distributed Processing of Very Large Datasets with DataCutter,”. Parallel Computing. 2001;27:1457–1478. [Google Scholar]
- [10].Foster I, Kessellman S, Tuecke S. “The Anatomy of the Grid: Enabling Scalable Virtual Organizations,”. International J. Supercomputer Applications. 2001;15 [Google Scholar]
- [11].Cambazoglu B, Sertel O, Kong J, Saltz JH, Gurcan MN, Catalyurek UV. Proceedings of Fifth International Workshop on Challenges of Large Applications in Distributed Environments. Monterey Bay, CA: 2007. “Efficient processing of pathological images using the grid: Computer-aided prognosis of neuroblastoma,”; pp. 35–41. [Google Scholar]


