Abstract
It has been shown that summarizing complex multichannel physiological and discrete data in natural language (text) can lead to better decision-making in the intensive care unit (ICU). As part of the BabyTalk project, we describe a prototype system (BT-45) which can generate such textual summaries automatically. Although these summaries are not yet as good as those generated by human experts, we have demonstrated experimentally that they lead to as good decision-making as can be achieved through presenting the same data graphically.
Introduction
Understanding and interpreting clinical data is an essential part of the task of doctors and other medical professionals. In an intensive care unit (ICU), the data available for a patient typically consists of: (i) continuously monitored physiological variables (such as heart rate) sampled every few seconds and (ii) discrete events (such as equipment settings, results of blood and other laboratory analyses).
It is not easy to interpret such large volumes of data which can amount to over a Mbyte per patient per day, and effective ways of presenting them are needed. A common approach is to present the time series data graphically as ‘trend’ displays. However a clinical trial in a neonatal intensive care unit (NICU) 1 failed to show that the presence of such displays positively influenced outcome measures. A further study 2 showed that junior staff (who are responsible for most of the immediate care of the baby) spend a small fraction (about 5%) of their time looking at such displays.
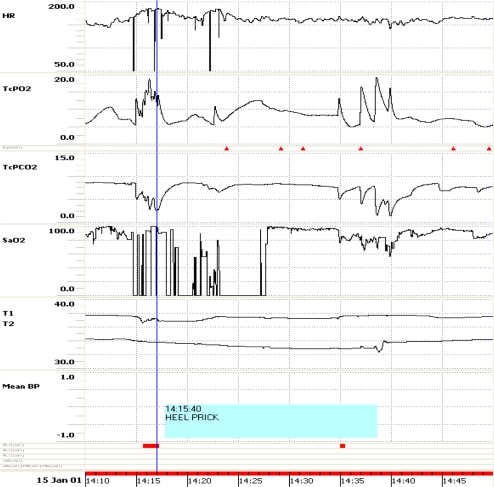
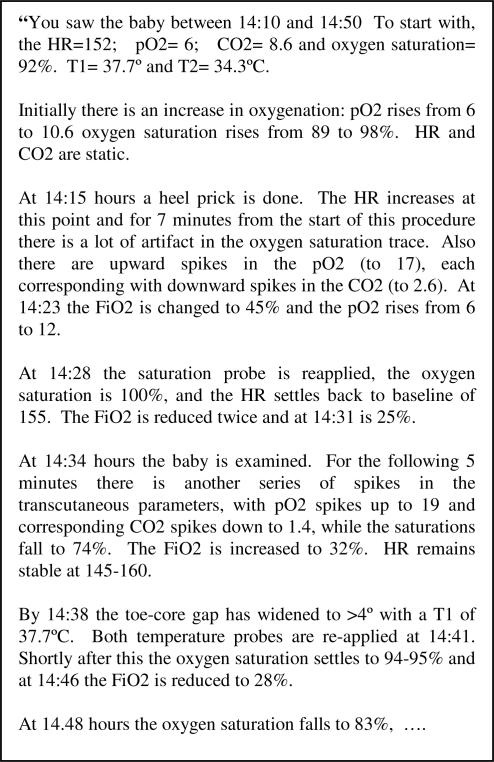
More recently, a carefully controlled off-ward experiment showed that medical professionals, in some circumstances, are more likely to make better treatment decisions if they are given a textual summary of patient data, instead of a graphical one.3 24 nurses and 16 doctors were asked to say what actions(s) they would take for a baby whose history over a period of about 45 minutes was presented either graphically or as text; see Figures 1 and 2.
Figure 1.
Example of a graphical presentation.
Figure 2.
Example of human generated text for the same period as in Figure 1.
Although the texts used in these experiments were written by clinical experts, it is not realistic to expect them to do this on a routine basis. However, it has been shown, albeit in domains where the data is somewhat simpler, that text can be generated automatically from time series. 4
As far as we are aware, there is little other work into how computer programs can be made to produce high-quality natural language text from large volumes of numeric and other non-linguistic medical data 5, 6. A number of techniques have been developed for summarising low volume clinical data e.g. summaries of multiple text-based health reports 7 and personalised patient-information material 8. Perhaps the most successful applications have been tools that (partially) automate the process of writing routine documents, such as the Suregen system 6, which is regularly used by physicians for surgical reports.
More recent is the TAS system 9, which uses generation and personalisation techniques to summarise information in published clinical studies. Rather than summarising patient data, the system aimed to facilitate the detection of relevant published information by physicians for diagnosis.
In the BabyTalk (BT) project we are applying such natural language generation (NLG) techniques to summarize the continuous and discrete data available in the NICU 10. This paper gives an overview of our progress to date. In the next section, we describe the architecture and implementation of our prototype system, BT-45, which summarizes data over 45 minutes. We then describe how we extended the previous experiment to include computer generated text and present our results. We conclude by setting out our plans for the future.
BT-45 Architecture and Implementation
The architecture of the prototype is represented in Figure 3. The first task was to build an Ontology (1) of NICU concepts to describe all the clinical annotations and the inferred events. BT-45 creates a summary of a data period in four main stages. The first stage is Signal Analysis (2) which extracts the main features of the physiological time series. Data Interpretation (3) performs temporal and logical reasoning to infer more abstract medical concepts and relations from the signal features and the clinical observations. From the large number of events generated, Document Planning (4) selects the most important and structures them as a tree of linked events. Finally, Microplanning and Realization (5) translates this tree into coherent text.
Figure 3.
BT-45 Architecture
Input and output data
The input data come from the Neonate database 11. Physiological data were recorded automatically once per second: heart rate (HR), the pressures of oxygen and carbon dioxide in the blood (TcPO2 and TcPCO2), the oxygen saturation (SaO2), the peripheral and central temperatures of the baby (T1 and T2) and the mean blood pressure (MeanBP).
A research nurse was employed to enter the following information with a precision of a few seconds:
equipment settings (incubator, ventilator…);
blood gas and laboratory test results;
drugs administered;
actions taken by the medical staff;
observations of the physical state of the baby.
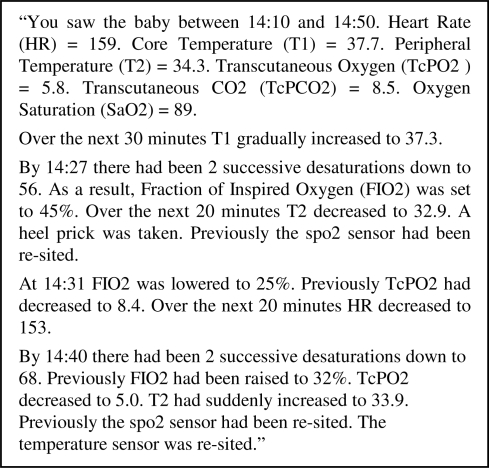
An example of the output of BT-45 for the same data period as shown in Figure 1 is presented in Figure 4.
Figure 4.
Example of computer generated text for the same period as in Figure 1.
1. Ontology
The NICU Ontology was developed using Protégé- 2000 frames 12. This ontology served as a common terminology for the different areas of expertise within the group, and to support reasoning. Concepts from several relevant areas are included, including: (i) medical terms, based on a lexicon acquired during the Neonate Project 11; (ii) signal processing concepts such as signal and artifact; (iii) linguistic concepts such as agent and recipient. This ontology is currently being extended and synchronized with existing knowledge resources (e.g. UMLS).
2. Signal analysis
The signal analysis module aimed at detecting artifacts, patterns, and trends. ICU physiological signals are well know for containing large amount of artifact (a sequence of signal sample values that do not reflect real physiological data). Following initial detection of impossible values using thresholds (e.g. a baby temperature cannot be physiologically below 30°C), an AR (Autoregressive) filter detects transient artifacts and corrects aberrant values. Finally, a reasoning step relates the artifacts between the different channels. For example, as the TcPO2 and TcPCO2 channels are derived from the same probe (the transcutaneous probe), if an artifact appears on one channel, it should also appear on the other.
Short term medical events (e.g. bradycardia, desaturation…) are detected using thresholds adapted to the baby’s gestation and age at the period being analyzed. Other transient patterns (spike and step) are detected using rapid-change detector. Long-term trend detection uses bottom-up segmentation which consists in merging neighboring segments iteratively into larger ones. All inferred events are instantiated using the ontology and the medical importance is computed.
3. Data Abstraction
Data abstraction uses expert rules to find links between events and patterns of events. There are three kinds of link: causes, includes and associates. For example, if a bradycardia is found during an intubation then this intubation is the likely cause of the bradycardia; ‘includes’ is used for events that are always accompanied by other events (e.g.: handbagging is included in intubation), and ‘associates’ is for obvious correlations (e.g.: overlapping spikes in TcPO2 and TcPCO2 are associated). There are two types of pattern: sequence and abstraction. For example, several successive bradycardias would be better reported in the text as sequence of bradycardias rather than individually. Similarly a succession of intubate and extubate events (where several attempts are made to insert the ventilation tube) are abstracted to the higher level operation of intubation. Links and abstracted events and are also instantiated via the ontology.
4. Content determination and document planning
Document planning decides which information should be included in the text, and how this information should be structured (e.g. split into paragraphs). BT-45 does this by identifying a small number of important key events, and generating a paragraph for each of these 7. The paragraph for a key event starts with the event itself, and then mentions other important events which are either explicitly related by causal links to the key event, or which occur at the same time.
For example, in the third paragraph of the example text shown in Figure 4, the key event is the two desaturations (first sentence); an oxygen saturation of 56% is medically very worrying, and hence regarded as an important event. The second sentence of that paragraph (change in FiO2, which is ventilator oxygen level) describes an event which BT-45 believes is causally related to the key event (i.e., BT-45 infers that medical staff changed FiO2 in response to the desaturations). The remaining three sentences list events (change in T2, heel prick, sensor re-siting) which BT-45 believes are potentially relevant, and which occurred at approximately the same time as the events mentioned in the first two sentences.
5. Microplanning and realization
Microplanning and realization convert the tree into the final text. Microplanning maps the nodes (events) and edges (links or temporal ordering) of the tree to semantic structures, via lexicalization rules. These structures are subsequently passed through stages of aggregation, referring expressions generation and temporal planning (for tense features). Finally, realization maps them to syntactic structures and translates them into text, a stage which also includes inflectional morphology and document layout.
Experimental Evaluation
BT-45 was evaluated during an off-ward experiment following the procedure adhered to in the previous experiment 3. Nurses and doctors were asked to make decisions about babies for several data periods (scenarios) presented either graphically or as text using a modified version of the Time Series Workbench 13.
A detailed description of the experiment and the results will be presented elsewhere 14; here we outline the most important features and summarise the main findings.
Twenty-four data periods (scenarios) were selected such that they could be grouped into 8 sets of 3; within a given set of 3, the actions to be taken at the end of the period were the same or very similar. The 8 sets covered a wide range of possible circumstances (including a set where taking no action was correct).
Three data presentations of each scenario were prepared: graphs, human authored text (H text) and computer generated text (C text).
In the graphic presentation, the physiological signals were displayed as time series, with discrete events such as blood gas analysis and intubation also presented symbolically. Only those events referred to in the corresponding H text were shown. The H texts were written by a consultant neonatologist and two experienced neonatal nurses, who independently inspected the data and produced a summary of each scenario, before constructing a single consensus summary. The summaries were written to be descriptive and to contain only as much interpretation as would constitute the basic medical language in use on the unit (e.g. bradycardia). The C texts were generated using BT-45 from a database in which all the physiological signals and discrete events were present. At no point before the experiment was conducted did the BT-45 developers see the H texts.
The participants in the experiment were 35 staff members working at the NICU at the Royal Infirmary of Edinburgh. They were allocated to one of four groups, depending on role and experience in neonatal care: Senior Doctors (n=9), Junior Doctors (n=9), Senior Nurses (n=9), or Junior Nurses (n=8).
Each participant attended 3 sessions consisting of 8 scenarios; in each session a different presentation was used (graphs, H texts or C texts). The order of the scenarios and of the 3 presentations was counterbalanced across participants within each group. Participants were unaware of the provenance of the texts (H or C). For each scenario, they were asked to imagine that the period presented led to the present and that they had to select appropriate action(s) that should be taken. Actions were selected from a set of 18 which was constant throughout the experiment. Each scenario had a 3-minute timeout, both to impose realistic time pressure and to guarantee a maximum length for each session.
The performance of each participant was scored as follows: for each scenario the proportion of appropriate (i.e. beneficial - as determined by clinical experts) actions selected was calculated as was the proportion of inappropriate (i.e. harmful) actions. The score for a given scenario was given by the former minus the latter. The scores for all 8 scenarios for each presentation were averaged for each participant to give one score for each of the 3 presentations.
The overall mean for the graphs was 0.33, for the H texts 0.39 and for the C texts 0.34. ANOVA tests showed that the H texts led to significantly better performance than the graphs (p=0.03), most of the difference coming from the junior nurse group; this confirms the results obtained in the previous experiment 3. The H texts also led to significantly better performance than the C texts (p = 0.03).
There was no observable difference between the graphs and the C texts. Given that BT-45 is the result of only one year's development, we find this to be a very encouraging result, especially since we have shown that if we can emulate H texts, we can expect C texts to lead to better results.
To this end, we have also performed a qualitative analysis of the C texts to evaluate their shortcomings, focusing on scenarios where the H texts led to better decisions 15. The most important differences are related to the narrative structure of the generated texts. This is partly due to the way certain linguistic features are handled. For example, BT-45 does not aggregate multiple related events in order to provide readers with a long-term overview of trends. One of the C texts states the initial peripheral temperature value (T2 = 34), and subsequently describes a downward trend (Over the next 44 minutes T2 decreased to 33.4). The H text aggregates this information, saying T2 drifts down over the 45 minutes from 34 to 33.3C. Another problem has to do with the communication of time, which arises in part from the conflicting constraints that the text is trying to satisfy. On the one hand, document planning orders events in a paragraph based on their importance; on the other, microplanning needs to express them in a way that permits the reader to reconstruct the temporal order of the events, which is not necessarily mirrored by the narrative order. This is evident in the final paragraph of the text in Figure 4 (e.g. the second clause reports an event that occurred before the event reported by the first clause). This kind of conflict occurs several times in this paragraph, giving rise to potential confusion about temporal order, which is resolved by the microplanner somewhat simplistically through the use of adverbials such as previously and tenses such as the past perfect.
Conclusion
Although existing systems can extract individual data items from a clinical database, we believe that the power of a narrative presentation linking related events is crucial in the effective transfer of information. We have demonstrated that the automatic generation of such texts within the ICU is possible and intend to develop a number of systems which will be aimed at specific users. BT-Nurse will generate end-of-shift nursing summaries covering a 12 hour period. BT-Doc will provide summaries ondemand for junior doctors covering several hours, designed to support decision-making. Finally, BTFamily and BT-Clan are being developed to investigate the possibility of supplying tailored information to non-medical readers – the baby's parents and their supporters.
Acknowledgments
We thank all of the nurses and doctors who acted as participants in the BT-45 experiment. This work was supported by UK EPSRC grants EP/D049520 and EP/D05057.
References
- 1.Cunningham S, Deere S, Simon A, Elton RA, McIntosh N. A randomised control trial of computerised physiological trend monitoring in an intensive care unit. Critical Care Medicine. 1998;26(12):2053–60. doi: 10.1097/00003246-199812000-00040. [DOI] [PubMed] [Google Scholar]
- 2.Alberdi E, et al. Expertise and the interpretation of computerised physiological data: Implications for the design of computerised physiological monitoring in neonatal intensive care. International Journal of Human Computer Studies. 2001;55(3):191–216. [Google Scholar]
- 3.Law AS, Freer Y, Hunter JRW, Logie RH, McIntosh N, Quinn J. A comparison of graphical and textual presentations of time series data to support medical decision making in the neonatal intensive care unit. J Clinical Mon and Computing. 2005;19:183–194. doi: 10.1007/s10877-005-0879-3. [DOI] [PubMed] [Google Scholar]
- 4.Reiter E, Sripada S, Hunter J, Yu J, Davy I. Choosing words in computer-generated weather forecasts. Artificial Intelligence. 2005;167:137–169. [Google Scholar]
- 5.Cawsey A, Webber B, Jones R. Natural language generation in health care. Journal of the American Medical Informatics Association. 1995;4:473–482. doi: 10.1136/jamia.1997.0040473. [DOI] [PMC free article] [PubMed] [Google Scholar]
- 6.Hüske-Kraus D. Text generation in clinical medicine – a review. Methods of Information in Medicine. 2003;42:51–60. [PubMed] [Google Scholar]
- 7.Hallett C, Scott D. Structural variation in generated health reports. Proceedings of the 3rd International Workshop on Paraphrasing; Jeju Island, Korea. 2005. [Google Scholar]
- 8.Reiter E, Robertson R, Osman L. Lessons from a failure: Generating tailored smoking cessation letters. Artificial Intelligence. 2003;144:41–58. [Google Scholar]
- 9.Noemie E, McKeown K, Kaufman D, Jordan D. Facilitating physicians' access to information via tailored text summarization. AMIA-05. 2005:226–230. [PMC free article] [PubMed] [Google Scholar]
- 10.Portet F, Reiter E, Hunter J, Sripada S. Proceedings of AIME 2007. Springer LNCS; 2007. Automatic generation of textual summaries from neonatal intensive care data; pp. 227–236. [Google Scholar]
- 11.Hunter JRW, et al. The NEONATE Database. IDAMAP Workshop, AIME-03. 2003:21–24. [Google Scholar]
- 12.http://protege.stanford.edu/overview/protegeframes.html
- 13.http://www.csd.abdn.ac.uk/research/tsnet
- 14.van der Meulen M, et al. 2008. When a graph is poorer than 100 words: A comparison of computerised natural language generation, human generated descriptions and graphical displays in neonatal intensive care, submitted,
- 15.Reiter E, Gatt A, Portet F, van der Meulen M. The importance of narrative and other lessons from an evaluation of an NLG system that summarises clinical data. Proceedings of INLG-2008. 2008:147–155. [Google Scholar]


