Abstract
To date there is no single shared property of the various physical and chemical agents that elicit the β-curve to account for its form, leading to the proposition that hormesis is a consequence of the nonspecificity of adaptive responses. It is argued that adaptive responses to toxic agents may be expected to follow the β-curve. Four kinds of examples are reviewed (enzyme activity, sequestration and repair, and reproductive and homeostatic responses) that corroborate this proposition. The homeostasis example (incorporating homeorhesis) is considered in more detail, using the author’s published hydroid experimental growth data, to show that both the α- and β-curves are satisfactorily explained in this way. Many consider that hormesis is merely due to regulatory overcorrections, but it is proposed that it is a consequence of adaptations of the rate-sensitive growth control mechanism (homeorhesis) to sustained levels of inhibition to which the growth control mechanism adapts. In response to low levels of inhibition, upward adjustment of preferred growth rates confers greater resistance to inhibition, with growth hormesis as a cumulative byproduct.
Keywords: hormesis, dose-response curve, α- and β-curves, adaptive responses, growth control, acquired tolerance
INTRODUCTION
Hormesis means “a stimulatory effect of subinhibitory concentrations of any toxic substance on any organism” (Southam and Ehrlich, 1943). The term has been overtaken in recent years by a more general term, which brings a different perspective to the question, “What is hormesis?” Hormesis is now encompassed within the β-curve (Townsend and Luckey, 1960), and examples are expected to satisfy the quantitative criteria defined by Calabrese and Baldwin (1997). The β-curve is a biphasic concentration-effect curve in which “hormesis” is the stimulatory phase, which is succeeded at higher concentrations by an inhibitory phase.
There is reason to consider first the wider interpretation of hormesis implicit in the adoption of the β-curve. Several authors have noted in recent years the inadequately defined mechanisms to account for hormesis (Appleby, 1998; Forbes, 2000; Morré, 2000; Gentile, 2001; Sutar, 2001). Implicit in the adoption of the β-curve is the assumption that an interpretation of hormesis should encompass the entire biphasic relationship, including the inhibitory phase. Calabrese and Baldwin (2003) have noted recently that researchers have neglected the transition between stimulatory and inhibitory phases of the β-curve.
Ambiguity of the β-Curve
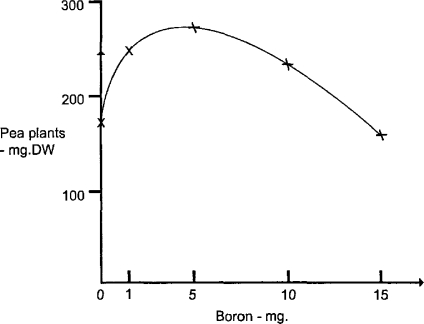
One kind of β-curve involving growth needs to be differentiated from the rest. When considering the Law of Optimal Nutritive Concentration, Bertrand (1962) demonstrated that growth maxima identified the optimal range of micronutrient concentration (Fig. 1) between the low levels that cause deficiency and the high levels that cause toxicity (Mertz, 1981). Luckey and Stone (1960) pointed out the difficulty of differentiating between the stimulation of growth due to a toxicant and the maximization of growth due to optimal micronutrient concentrations. The similarity of these two concentration–effect curves is that at higher concentrations both curves indicate the toxicity of the chemical agent. The difference lies in the fact that the Law of Optimal Nutritive Concentration relates to micronutrients, whereas hormesis is due to xenobiotics, foreign to biological systems. In some instances toxic agents like copper may also be micronutrients, but it becomes clear that at least two mechanisms can produce a β-curve. Examples of hormesis relate primarily to agents that are known for their toxic properties and are not micronutrients.
Figure 1.
Optimal nutritive concentration of boron (mg) for pea plants (mg dry weight) as demonstrated by their growth maximum (after Bertrand, 1962).
Possible Interpretations of Hormesis
A large quantity of data is available that exhibits both hormesis and the β-curve (see reviews by Calabrese and Baldwin, 1998, 2001a, 2001b). By deduction alone, some progress can be made in narrowing the possible interpretations. Such a wide range of chemicals elicit hormesis that we must ask whether there is some effect that hormetic agents share that they should have such similar biological consequences? The agents that elicit hormesis include all the major groups of chemicals, and also some physical agents (e.g., radiation). Yet apparently there exists no single shared property of these agents that can account for their stimulatory effects.
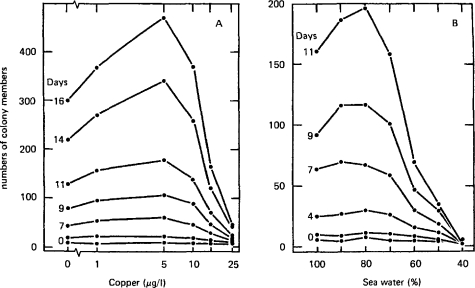
The lack of chemical specificity of agents causing the β-curve is illustrated using data from experiments with copper (Fig. 2A) and reduced salinity (Fig. 2B) (Stebbing, 1981A)—two quite different agents that have nothing chemically in common. In one instance the inhibitory stress is imposed by the dilution of fully saline water and in the other by increasing the concentration of copper. Hormesis is paradoxically caused by lesser dilutions in one case and higher concentrations in the other. This suggests that hormesis is not related to the specific properties of its causal agents, but to some biological response that they each elicit.
Figure 2.
The development of β-curves over time in response to dissimilar agents: (A) the effects of copper (μg/l) and (B) reduced salinity (% seawater by volume) on the colony growth of the hydroid Laomedea flexuosa over time in days (after Stebbing, 1981a).
This leads to the proposition that the generality of hormesis appears to be a function of the nonspecificity of some adaptive biological responses. While there are specific biological responses to particular chemicals, generalized responses are equally important, but are often overlooked. Nonspecific responses to stress are preadaptive in providing the means to counter the effect of a xenobiotic new to the organism because, for example, its response may be primarily to a growth inhibition rather than to a metal. Such a biological interpretation of hormesis is more likely to account for the shared responses to unrelated physical and chemical agents.
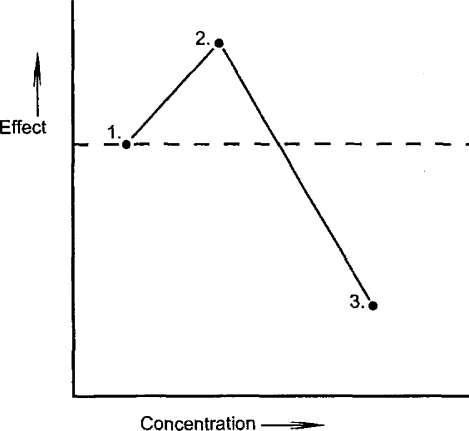
The β-curve is defined by three points (see Fig. 3). The first is the point at which the β-curve originates (i.e., 100% level or growth rate of the controls), representing the lowest concentration that has no detectable biological effect. The second point is that at which stimulation of the adaptive process is greatest (~30–60% greater than the controls). Finally, the third is the point at which the inhibitory effect is greatest, representing the complete inhibition of the process or lethality, as concentrations become toxic. Any curvilinear relationship joining these points will create what we would accept as the β-curve, first described by Townsend and Luckey (1960) and quantitatively defined by Calabrese and Baldwin (1997). The downward arm of the β-curve, as given in hypothetical form by Townsend and Luckey (1960) and shown here (see points 2 and 3 in Figure 3), is reflected in much experimental data (Stebbing, 1982; Calabrese and Baldwin, 2001b), indicating a linear continuum in the response curve. This implies that hormesis, or the stimulatory phase, is continuous with the inhibitory phase; a continuity that should be reflected in any hypothesis to account for the β-curve.
Figure 3.
Hypothetical concentration–effect curve identifying the defining points (1 to 3) that characterize the β-curve. See text for further discussion.
One may go further and argue, a priori, that any adaptive response to toxic agents will be stimulated first on reaching a threshold of detection by the organism (point 1, Fig. 3). The response will reach a maximum (point 2) such that no increase in concentration will elicit any greater response. The descending arm of the β-curve is due to the inhibition of the adaptive response by higher concentrations as their effect becomes more toxic (point 3). Adaptive responses to toxic inhibition must be stimulated by exposure to sublethal levels before then being inhibited as lethal concentrations are reached. On this basis alone it is to be expected that adaptive responses to toxic agents will follow the β-curve.
Examples of Adaptive Responses to Toxic Stress
The extent to which this proposition is true among adaptive responses to various physical and chemical agents can now be examined. What biological systems respond adaptively to toxic stress, and do their concentration–effect relationships follow the β-curve? Four kinds of examples will be used to briefly explore the generality of adaptive responses and the β-curve.
1. Enzyme Activity
Consider those responses related to the sequestration or degradation and excretion of xenobiotic chemicals. For example, the mixed function oxidase system mediates the transformation of many organic compounds, and may be induced by PAHs and PCBs. The activity of transformation enzymes typically increases with substrate concentration, following Michaelis–Menton kinetics, until a maximum saturation point is reached (Fig. 3, point 2). Substrate inhibition follows, which is more rapid if the substrate is toxic (Fig. 3, point 3). Thus, any enzyme system that degrades xenobiotics may be expected to follow the β-curve.
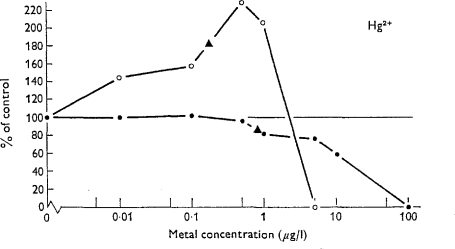
One example is provided by a lysosomal hydrolase in hydroids exposed to metals (Moore and Stebbing, 1976). N-acctyl-β-D-glucosaminidase was used as an indicator of hydrolase activity. Lysosomes have a role in metal sequestration and lysosomal hydrolases are involved in autolysis caused by toxic inhibition of growth. At low concentrations enzyme activity is induced, which increases with metal concentration to a level 50–150% higher than the controls. Thereafter, further increases in metal concentration inhibit both growth and enzyme activity. The example given is for mercury (Fig. 4). Similar biphasic curves were also found in experiments with copper and cadmium (Moore and Stebbing, 1976).
Figure 4.
Concentration–effect curves showing the effect of mercury on the hydroid Laomedea flexuosa. Glucoseaminidase reactivity (○) shows the β-curve and specific growth rate (•) the α-curve. Triangles indicate threshold of significant difference from the controls (from Moore and Stebbing, 1976).
Morré (2000) describes a multifunctional ubiquinol oxidase, with protein disulphide-thiol interchange activity at the cell surface, abbreviated as NOX. This activity correlates with the rate of cell enlargement. Both cell growth and NOX activity are stimulated by low concentrations of a number of chemicals that are inhibitory at higher concentrations, exhibiting the β-curve.
2. Sequestration and Repair
Metallothioneins have a metal-binding function in normal metabolism that detoxifies xenobiotic metals (e.g., Cd and Hg). Low metal concentrations induce metallothionein production, but inevitably, at toxic concentrations, production is inhibited. Heat shock proteins (hsp) are generalized stress proteins that are induced by toxic chemicals, including metals. They have a role as molecular chaperones, binding to partially denatured proteins and helping them to reconfigure and regain their activity (Parsons, 2000). With progressive stress loading, it is to be expected that the production of metallothioneins and hsp is first stimulated by the uptake of metals and then inhibited by them as the level of toxic stress overwhelms the cell, resulting in the β-curve.
Damelin and co-workers (2000) conducted an in vitro study of metal cytotoxicity using McCoy mouse cells in culture. They have shown increased cellular activity at low concentrations and reduced activity at high concentrations, in what the authors describe as a series of “composite curves.” The overall concentration–effect curves for various metals strikingly resemble one another, exhibit hormesis, and approximate the β-curve. Cellular activity coincided with the production of high levels of HSP 70 and metallothionein. These correlated adaptive responses to low metal levels constitute part of the enhanced cellular activity that sequesters metals and repairs damage to proteins. At higher concentrations cell activity and the adaptive responses are inhibited, giving the overall pattern of the β-curve. Such curves and their correlates may well be composites of a number of such curves for different indices and responses of varying sensitivities, as envisaged by Depledge and co-authors (1993).
3. Reproductive Responses
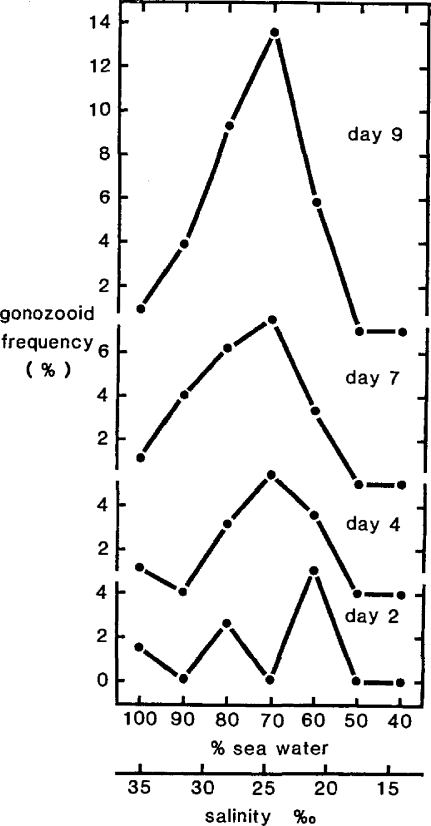
At the organismal level, one example of an adaptive response to stress in hydroids involves a switch from asexual to sexual reproduction that exhibits a biphasic response. Hydroid colonies divert colony growth from feeding modules (hydranths) to reproductive modules (gonozooids) (Stebbing, 1981b). The gonozooids produce sexual planktonic medusae, so more gonozooids in a colony represents a greater investment in the benefits of dispersal and in sexual reproduction. Meiosis results in greater genetic variety, providing increased scope for selection and evolutionary adaptation. Data exhibiting biphasic curves are given from an experiment showing increases in gonozooid frequency in relation to reduced salinity over time (Fig. 5). This adaptive behavior is due to a switch of growth energy from the production of one type of module to another and occurs independently of overall colony growth. The response is nonspecific and is elicited by various stress factors (metals, organometals, polluted environmental water samples), such that the stimulation of gonozooid frequency can be considered a generalized adaptive response to stress. Once again, the response with time comes to resemble closely the β-curve.
Figure 5.
The effects of reduced salinity on the colonial membership of the hydroid Laomedea flexuosa. Successive curves show the development of a biphasic curve in the increased frequency of gonozooids (as % of total colony members) as a generalized response to stress (from Stebbing. 1981c).
4. Homeostatic Responses
There is considerable interest in the proposal that homeostasis is responsible for hormesis (Hickey and Bowers, 1985; Fabrikant, 1987; Calabrese, 1999, 2001; Skov, 1999; Chapman, 2001; Gentile, 2001; Sutar, 2001). Homeostatic mechanisms are typically considered responsible for maintenance of constancy, but emphasis is given here to their active resistance to perturbation due to toxic agents. Homeostasis depends on feedback mechanisms (von Foerster, 1958), which have their theoretical basis in cybernetics (Milsum, 1966). There are three characteristics of such mechanisms that suggests they may account for the β-curve:
Homeostatic mechanisms provide a nonspecific response to toxic inhibition and counter perturbation to controlled processes, thus neutralizing the effects of toxic stress, irrespective of their specific causes. This is because feedback mechanisms sense and respond to perturbation of the process they control and not to the causal agent responsible, which accounts for the generality of homeostatic responses.
Homeostatic adjustment is typically imprecise and delayed by a time lag as information cycles the feedback loop. The response does not neutralize precisely or immediately any deviation from the preferred state or rate, so in reality it is not the perfect neutralization implied earlier. With each cycle of the feedback loop, sensed information and preferenda are compared and the error between them is minimized. Due to delays in the feedback loop, there is repeated undercorrection and overcorrection following perturbation, through a sequence of oscillations of decaying amplitude before, errors are minimized and equilibrium is restored.
Where external forces perturb physiological processes, they are countered by homeostatic responses of the opposite sign, thereby stabilizing controlled processes. Thus, an inhibitory perturbation is countered by a stimulatory response. The stimulation is typically hidden as a neutralizing counter-response, but becomes most evident as relaxation stimulations that follow the sudden removal of an inhibitory load, which is apparent for the duration of the lag in the feedback mechanism (Stebbing, 1981a).
These properties, and the ubiquity of homeostasis in biological systems, make it a likely candidate for interpretation of many instances of hormesis. This interpretation is not new (Stebbing, 1981a), and hormesis and homeostasis have long been linked (Hickey and Bowers, 1985). Hormesis is often referred to as a consequence of some aspect of homeostasis, specifically as overcorrection (Stebbing, 1981a, 1982, 1987) or imbalance (Skov, 1999), as overcompensation (Calabrese, 2000) or as overshoot (Giesy, 2001).
Among the examples of adaptive responses to toxic stress just given, we see in the simplest interpretation responses that are elicited by low levels of toxic agents, which increase with concentration to match the load. But with increasing concentration, the response becomes overloaded and finally inhibited as toxicity increases. All these examples could be said to illustrate homeostasis, using the wider meaning of the term. However, where homeostatic control is represented via feedback mechanism(s), its basic properties can be explored more explicitly to account for both the α- and β-curves.
In the simplest analysis a key principle of homeostasis (von Foerster, 1958) can be adapted to interpret responses and effects of toxic load. Homeostasis with respect to xenobiotic perturbation can be accounted as a toxic effect (E) that is the sum of some inhibition (I) minus the homeostatic counter response (R), such that E = I – R. Where I = R, neutralization of the toxic inhibition is perfect, as at subthreshold concentrations in the α-curve. Where I > R, overload occurs as the capacity to neutralize inhibition is exceeded, resulting in the downward arm of α- and β-curves. Where I < R there will be hormesis due to overcorrection. Once more the β-curve is defined by three points (Fig. 3), where at point 1 the inhibitor and counter-response are in equilibrium (I = R), at point 2 there is stimulation due to overcorrection (I < R), and at point 3 there is inhibition due to overload (I > R). Clearly any counter-response to inhibition is essentially stimulatory, but is not observed as such when stimulation is obscured in neutralizing inhibition and expressed as the sum of I + R (Stebbing, 2000a, 2000b). This leads to an interpretation of the dynamics of growth homeostasis based on work with hydroids and a marine yeast.
Homeostatic Interpretation of the α-Curve
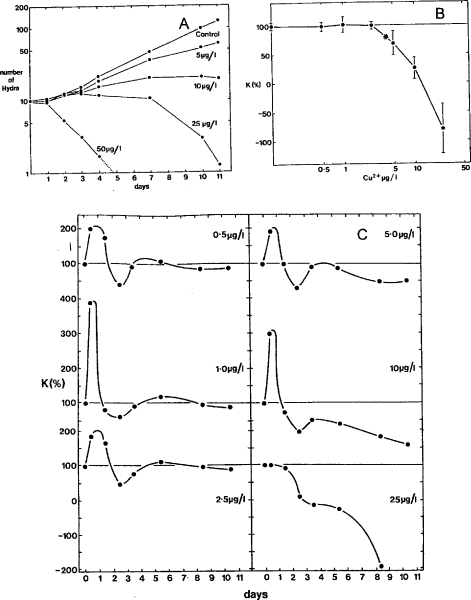
It will be clearer to begin by providing a homeostatic interpretation of the α-curve (concentration–effect curve without hormesis) before proceeding to the β-curve. Control of the growth rate in asexual reproduction by budding of Hydra (Stebbing and Pomroy, 1978) provides experimental data. First, the raw data are shown as cumulative growth curves for Hydra at a range of concentrations of copper (Fig. 6A). All growth is the product of mitosis (Dawkins, 1999), so asexual budding as a unitary product of cell division can be considered a measure of growth. Growth in the unstressed controls is exponential over the duration of the experiment (11 days), so specific growth rates are nearly constant. Cultures of those Hydra at low concentrations grow at much the same rate as the controls, but, with increasing concentration, cumulative growth becomes more depressed and, at the highest concentrations, growth is negative from the outset. These raw cumulative growth data are neither informative about growth as a controlled process nor provide toxicological insight.
Figure 6.
The effects of copper on clonal populations of Hydra littoralis. The data from a single experiment are shown in three forms: (A) cumulative growth curves of populations increasing by asexual budding; (B) concentration of copper (μg/l) in relation to mean specific growth rates for 11 days showing the threshold of growth inhibition (*) of 4.0 μg/l; and (C) specific growth rates of populations (as a percentage of the controls) calculated at intervals in time, to reveal the activity of the control mechanism regulating growth (from Stebbing and Pomroy, 1978).
The same data, as mean specific growth rates, plotted against copper concentration, provide the concentration–effect curve, or the α-curve (Fig. 6B). This is the form of data traditionally adopted by toxicologists to determine threshold concentrations. Here there is a well-defined threshold at 4.0 μg/l, but the α-curve itself provides no indication as to the cause of the onset of inhibition at that concentration.
To reveal the output of a rate-sensitive growth control mechanism requires transformation of these data. The three steps involved have been described in detail elsewhere (Stebbing, 1981a, 1982, 1998). The first step is to calculate specific growth rates [1/N(dN/dt), where N is the number of Hydra] to provide a measure of growth rate that is independent of population size. Such rates should be determined as frequently as the precision of the data allow, providing definition to the temporal oscillations that characterize the output of feedback mechanisms. A minimum of five data points are typically required to define a single cycle. The second is to conduct experiments in which a graduated series of perturbations to the controlled process imposes loads of increasing magnitude on the control system. The third is to filter out the effect of perturbation on specific growth rates by expressing specific rates as a proportion (%) of those of the control cultures. A transformed data set using the same raw data is given (Fig. 6C).
It is immediately apparent that there are interpretative features of the data (Fig. 6C) that were not previously apparent (Fig. 6A and B). It reveals the full range of effects of toxic loadings on the control mechanism. If the levels of loading have been well chosen, the range of behaviors shows the control mechanism restabilizing to low loads through to destabilization due to overload. At subinhibitory concentrations (0.5–2.5 μg/l), there is a response to perturbation, and an overcorrection to inhibition becomes an oscillation, with growth rates stabilizing after little more than one cycle. The control mechanism is able to restore control over a range of concentrations, where no effect is indicated by the concentration–effect curve (Fig. 6B). At higher concentrations, already shown to be inhibitory (Fig. 6B), similar overcorrections (5 and 10 μg/l) are followed by declining growth rates. The initial response indicating recovery is not sustained and overloading of the capacity of the control mechanism leads to inhibition and decline. At the highest concentration (25 μg/l), the control mechanism is overloaded from the outset.
These results demonstrate that the data, presented as cumulative growth data (Fig. 6A) and concentration–effect curves (Fig. 6B), find interpretation in the transformed data that reveal the output of a growth control mechanism (Fig. 6C). Its response to toxic inhibition counters the perturbation at low concentrations. At higher concentrations, the capacity to neutralize perturbation becomes exceeded with increasing concentrations. Overloading of the capacity to counteract by higher levels of growth inhibition (Fig. 6C) coincide with, and account for, the threshold in the concentration–effect curve (Fig. 6B).
The same data expressed in different forms provide links between cumulative growth, the concentration–effect or α-curve, and transformed rate data revealing control system output (Fig. 6). The transformed data (Fig. 6C) show a neutralizing response to inhibition that is essentially stimulatory, but whose timing and magnitude are oscillatory and approximate, leading to equilibrium or overload with time, depending on concentration. The analysis shows that there is an effective adaptive response to neutralize perturbation (Fig. 6C) at subthreshold concentrations (Fig. 6B). There is approximately an order of magnitude in concentration between the lowest concentration that elicits a homeostatic response and the concentration that first causes inhibition, indicating the range of inhibition over which control is maintained. The onset of overload (Fig. 6C) is the reason for the threshold in the concentration–effect curve (Fig. 6B). Inhibition in the α-curve is because the homeostatic capacity of the system to maintain growth rates at that of the controls has been exceeded.
Homeostatic Interpretation of the β-Curve
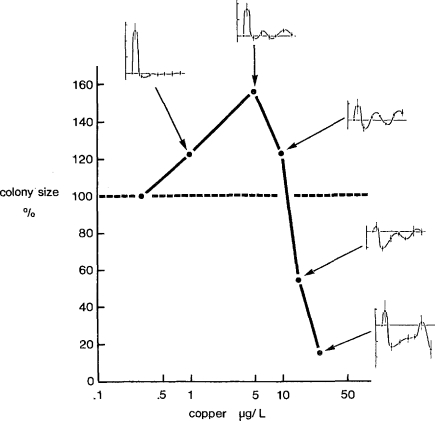
Now we link control behavior of the kind observed in Hydra (Fig. 6C) with the β-curve using data for the colonial hydroid Laomedea (Fig. 7), which is essentially similar to the asexual budding process, but creates a colony rather than a population. Control data transformed in the same way are given for each concentration of copper as an inset, showing the underlying dynamic behavior for each concentration of the β-curve. As with Hydra, the range of concentrations extends from those that caused little perturbation, allowing rapid stabilization (1 μg/l), through to high concentrations that immediately overload the control mechanism (25 μg/l). The integration of the oscillatory rates over time provides the mean sizes of colonies given in the β-curve. The interpretation of the β-curve is similar to that for the α-curve (Fig. 6C), as one of progressive overloading of the control mechanism with increasing concentration of copper. What differs are the stimulatory effects at subinhibitory levels (Fig. 7) that characterize the β-curve, and differentiate it from the α-curve.
Figure 7.
Relationship between copper concentration (μg/l) and size of Laomedea flexuosa colonies after 16 days. Insets of the normalized specific growth rates are given for each concentration over time showing the regulatory behavior responsible for the β-curve. The hormetic concentrations (1, 5, 10 μg/l) for further analysis of the cause of hormesis are used again in Figure 8 (from Stebbing, 1987).
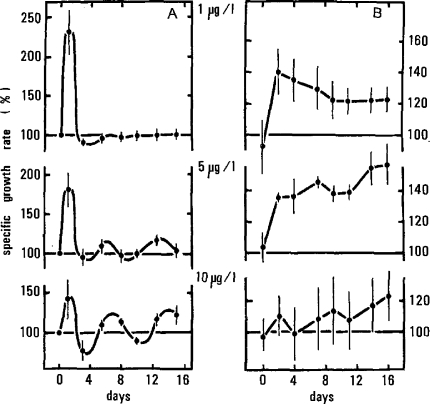
We now take the three concentrations that define the peak of the β-curve and interpret their control behavior (Fig. 8A) to account for the observed hormesis. As with Hydra, overcorrection to inhibition features initially with marked oscillatory fluctuations in growth rate. Note that these initial overcorrections do not constitute hormesis, nor do they give rise to a β-curve. Subsequently there is equilibration that is only completely achieved at the lowest concentration (1 μg/l).
Figure 8.
Regulatory data for Laomedea flexuosa with respect to cumulative increases in colony size. (A) Normalized specific growth rates for hormetic concentrations of copper (1, 5, 10 μg/l) from Figure 7 are used to show the regulatory rate data; (B) data integrated as size (%) result in increases in size over time apparent as colony size in the β-curve shown in Figure 7. (from Stebbing, 1981c).
When the cumulative sizes of the colonies are considered (Fig. 8B), each increases due to the initial overcorrection, but it is the subsequent behavior that determines the final outcome in terms of enhanced colony growth. At 5 μg/l, growth rate oscillates about a mean level that becomes somewhat higher than the controls (∼10%), with the consequence that colony size ultimately becomes 50% larger than the control colonies (Fig. 8B). Over time a small increase in specific rate results in a large increase in colony size (Fig. 7), because this is an exponentially growing system. At 10 μg/l, the level about which rates oscillate also continues to increase until the end of the experiment. The progressive development of the β-curve is shown with the greatest stimulatory effect at the conclusion of the experiment (Fig. 8B). This shows that hormesis is due to an ongoing process of gradually increasing growth rates and not just to the short-lived, if more marked, initial stimulation (Fig. 8A).
The downward arm of the β-curve can be seen to extend linearly from stimulation due to overcorrection and through to inhibition due to overload and the consequential inability to restore the initial equilibrium. Even where the dynamic behavior indicates recovery and the restoration of equilibrium is almost complete (15 μg/l in Fig. 7), significant inhibition occurs. The transition from stimulation to inhibition is generally a linear continuum due to the progressive overloading of the control mechanism. Rather than a step change, there is a gradual passage from a control system under load to an equilibrium eventually restored and, finally, to complete overload.
The capacity of the control mechanism to neutralize the inhibitory effect of toxic metals can be quantified (Stebbing, 1981A), and for copper it spans an order of magnitude from 1 to 10 μg/l; that is, from the lowest concentration that activates the control mechanism, to the concentration at which the system becomes overloaded and inhibition occurs. System capacity is obviously an important index of the ability of the process to resist toxic inhibition.
The generality of the response to toxic inhibition is because the growth control system responds to deviation of the controlled state or rate and not to the specific toxic agent that is responsible. Hence, any inhibitor or perturbation will elicit the same oscillatory behavior and counteraction. It follows that any inhibitor, within the appropriate range of concentrations, will cause hormesis (Fig. 2) and reflect no indication of its cause.
There is one complication in any consideration of control mechanisms responsible for homeostasis. Following Waddington (1977), physiological control is of two kinds. First it may apply to the maintenance of a steady state, such as the temperature of a homoiotherm, when it is referred to as homeostasis. Second, when referring to a rate, which relates to processes such as heart or respiration rate, Waddington gave the term homeorhesis. Thus growth control may be in terms of a state, such as the maintenance of size by regeneration (Goss, 1964), or as a rate in the control of biosynthesis (Newsholme and Start, 1973), or both within nested systems. Hydra controls its growth rate (Fig. 6), but quite separately its population size by density limitation in a nested system (Stebbing and Heath, 1984). This distinction is important, first, because rate data are inevitably much less precise than state data. Sometimes a direct measure of rate is possible (e.g., mitotic indices, vide Fabrikant, 1987), otherwise estimates of rate must be derived from measurements of state at intervals in time. Variability of rate data may increase at least 20-fold with respect to the state data from which they are derived (Stebbing et al., 1984), so raw state data of a high quality are essential if the transformed rate data are to have any value.
In conclusion, it is clear that neither the α-nor the β-curves (Figs. 6B, and 7) themselves offer any obvious physiological interpretation of their form. Each represents some integration of temporal data that obscures the dynamic behavior upon which interpretation depends. Whereas the hormetic range of the β-curve represents the product of overcorrection, or overcompensation (Calabrese, 1999, 2001), it does not demonstrate the overcorrection itself, which is only revealed by the dynamic behavior of the control system output (Figs. 6–8). In the examples given, the data reveal the output of a homeorhetic control mechanism functioning over a range of concentrations. Together they indicate the characteristic output of a feedback mechanism placed under increasing load with each higher concentration, whether exhibiting hormesis due to overcorrection (Figs. 7 and 8) or not (Fig. 6).
Hormesis and Acquired Tolerance
Many consider that hormesis is simply due to an overcorrection, overcompensation, or an overshoot (see previous discussion) of some regulatory or homeostatic response to low levels of inhibition. It now seems likely that hormesis is a consequence of adaptation of the growth control mechanism to sustained low levels of inhibition that confer greater resistance to subsequent exposure to toxic inhibition (Stebbing, 2002).
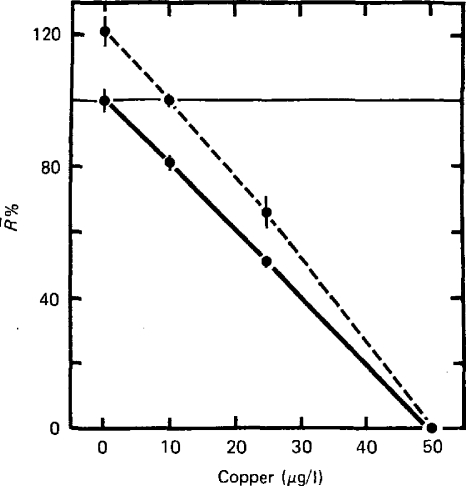
Data are given showing the effect of pre-exposure of hydroids (3 weeks at 10 μg/l Cu2+) on their subsequent sensitivity to copper (Fig. 9). Overall the effect of pre-exposure is to reduce the sensitivity or increase the tolerance of hydroids to copper. An adaptive interpretation would suggest that pre-exposure had made them more resistant due to an increased capacity to counter the effects of toxic inhibition. This capacity can be expressed in terms of the increase in concentration that causes a given inhibition of growth rate by horizontal interpolation from the control curve to that for pre-exposed group. For example, at an 80% growth rate, the control group was exposed to 10 μg/l, but the pre-exposed group required 18 μg/l to produce the same inhibition. Pre-exposure had increased their ability to resist copper by 8 μg/l.
Figure 9.
The effects of pre-exposure to copper for 3 weeks at 10 μg/l (dashed line), in relation to the controls (solid line) on the mean specific growth rate (R%) of the colonial hydroid Laomedea flexuosa over 11 days when exposed to a range of copper concentrations. Increased resistance to subsequent exposure to a range of copper concentrations is shown by the pre-exposed colonies (from Stebbing, 1981a).
If we interpolate vertically between the control and pre-exposed groups at specific concentrations, pre-exposure apparently has the effects of increasing growth rates (Fig. 9). For a given concentration of copper, say 10 μg/l, the growth rates of colonies increase by 20%. Growth is apparently stimulated as a consequence of pre-exposure over a range of concentrations.
As before, experiments involving some integration over time (mean specific growth rate over 11 days) require explanation that can only be found in the output data of a growth control mechanism (Fig. 8). Small increases in the preferred growth rate, when integrated over 11 days, provide larger increases in cumulative biomass (Figs. 2A and 8B). Pre-exposure over three weeks results in significant increases in mean growth rate. The process of adjustment to achieve these effects is seen in the control system output (5 and 10 μg Cu 2+/l; Fig. 8A) as a progressive if slight increase (5–10%) in the level about which rates oscillate, due to a gradual resetting of the preferred growth rate. Over three weeks the process of adjustment to 10 μg/l is complete, as pre-exposed colonies then exposed to 10 μg/l in the subsequent experiment grew at the same rate as the controls (Fig. 9).
In this way it becomes apparent that pre-exposure results in adaptation of the growth control mechanism, such that an increased capacity to resist inhibition due to copper is achieved by adjusting the preferred growth rate to a slightly higher level. This reduces the effect of subsequent exposure to copper over a range of concentrations (Fig. 9). Any such increase in growth rate inevitably has the additional effect of causing hormesis (Fig. 8B). Hormesis is therefore a consequence of the same adaptive regulatory adjustments that confer increased capacity to counteract toxic inhibition.
MODELING AND HYPOTHESIS DEVELOPMENT
Simple control models have been developed to simulate dynamic behaviors that result in the β-curve, reproducing overload to create a threshold effect. Such models have been developed from experimental data using hydroids (Stebbing and Hiby, 1979; Stebbing 1981a) and a marine yeast (Stebbing et al., 1984; Norton and Stebbing, 1986). Neither of these models reached the stage of development capable of simulating acquired tolerance and hormesis (see review, Stebbing, 2000a). Nevertheless, control models offer the basis from which the simulation of hormesis and acquired resistance could be developed, as all homeostatic and homeorhetic systems incorporate feedback.
CONCLUSIONS
The β-curve is the best-defined description of hormesis as a stimulatory effect set in the context of the whole toxicological concentration–effect curve. In this way hormesis can be considered an integral part of the β-curve, rather than attempting to interpret it independently of the inhibitory phase.
Unrelated phenomena exhibit the β-curve, so the curve does not identify its cause, and no single theory can be expected to account for hormesis. This implies that the concept of hormesis has little interpretative value, because there is no unambiguous explanation of its cause. Nevertheless, an analysis of a range of examples suggests that adaptive responses to toxic stress typically exhibit the β-curve (Figs. 2, 4 and 5). One may go further and argue that this is inevitably so, because adaptive responses are stimulated by low levels of toxic agents but are ultimately poisoned by higher concentrations (Fig. 3).
The generality of stimulatory effects by toxic inhibitors is due to the nonspecificity of adaptive responses. Evolution favors the development of responses that counteract a broad spectrum of xenobiotic effects, and confer greater fitness, irrespective of the toxic challenge. Homeostasis is the most general adaptive response that exhibits hormesis, apparently as a consequence of responses that overcorrect to toxic inhibition. Growth is the process that most commonly exhibits hormesis, and a theory is provided based on homeostatic principles to account for it. Inhibitory perturbations are neutralized by a response that is essentially stimulatory, which results in neutralization at low loadings and inhibition when the control system is overloaded.
Like many homeostatic processes, growth regulatory mechanisms are self-adjusting and use information on previous exposure to reset system parameters following the homeostatic truism that the capacity of such systems increases with use and decreases without. Homeostatic and homeorhetic systems have evolved to resist perturbation to the states or processes they control. In this instance the capacity of the system to resist toxic inhibition increases with “training” due to sustained exposure to toxic agents. Resetting preferred growth to a higher rate increases resistance but also stimulates growth. Hormesis is apparently a byproduct of the adaptation by which greater tolerance is acquired. This implies that hormetic concentrations are those most likely to result in acquired tolerance. However, it is not the additional biomass that confers most fitness on the organism, but the enhanced resistance to future toxic inhibition.
Acknowledgments
I am grateful to Professor Michael Moore and to Dr. David Livingstone for helpful discussion and advice. I also give thanks to Plymouth Marine Laboratory for their continuing support through the award of an Honorary Fellowship. I also appreciate the invitation given to me by Professor Ed Calabrese to write this analysis of hormesis and its causes.
REFERENCES
- Appleby AP. The practical implications of hormetic effects of herbicides on plants. BELLE Newslett. 1998;6:23–24. doi: 10.1177/096032719801700511. [DOI] [PubMed] [Google Scholar]
- Bertrand D. Expression mathematique logique de la loi de l’optimum de concentration nutritive. CR Acad Agric Fr. 1962;254:2810–2812. [Google Scholar]
- Calabrese EJ. Evidence that hormesis represents an “overcompensation” response to a disruption in homeostasis. Ecotox Environ safe. 1999;42:135–137. doi: 10.1006/eesa.1998.1729. [DOI] [PubMed] [Google Scholar]
- Calabrese EJ. Overcompensation stimulation: A mechanism for hormetic effects. Crit Rev Toxicol. 2001;31:425–470. doi: 10.1080/20014091111749. [DOI] [PubMed] [Google Scholar]
- Calabrese EJ, Baldwin LA. A quantitatively-based methodology for the evaluation of chemical hormesis. Hum Ecol Risk Assmnt. 1997;3:545–554. [Google Scholar]
- Calabrese EJ, Baldwin LA. Hormesis as a biological hypothesis. Environ Hlth Perspect. 1998;106:1–16. doi: 10.1289/ehp.98106s1357. [DOI] [PMC free article] [PubMed] [Google Scholar]
- Calabrese EJ, Baldwin LA. The frequency of U-shaped dose responses in the toxicological literature. Toxicol Sci. 2001a;62:330–338. doi: 10.1093/toxsci/62.2.330. [DOI] [PubMed] [Google Scholar]
- Calabrese EJ, Baldwin LA.2001bScientific Foundations of Hormesis. Special Issue of Critical Reviews in Toxicology CRC Press; Boca Raton, FL [Google Scholar]
- Calabrese EJ, Baldwin LA. Toxicology rethinks its central belief. Nature. 2003;421:691–692. doi: 10.1038/421691a. [DOI] [PubMed] [Google Scholar]
- Chapman PM. The implications of hormesis to ecotoxicology and ecological risk assessment (ERA) BELLE Newslett. 2001;10(1):2–9. doi: 10.1191/096032701718120337. [DOI] [PubMed] [Google Scholar]
- Damelin LH, Vokes S, Damelin SB, Alexander JJ. Hormesis: A stress response in cells exposed to low metal levels. Hum Exper Toxicol. 2000;19:420–430. doi: 10.1191/096032700678816133. [DOI] [PubMed] [Google Scholar]
- Dawkins R. The Extended Phenotype. Oxford: Oxford University Press; 1999. [Google Scholar]
- Depledge MH, Amaral-Mendes JJ, Daniel B, Halbrook RS, Kloepper-Sams P, Moore MN, Peakall DB. The conceptual basis of the biomarker approach. In: Peakall DB, Shugart LR, editors. Biomarker. Berlin: Springer; 1993. pp. 15–29. [Google Scholar]
- Fabrikant Jl. Adaptation of cell renewal systems under continuous irradiation. Hlth Phys. 1987;52:561–570. doi: 10.1097/00004032-198705000-00006. [DOI] [PubMed] [Google Scholar]
- von Foerster H. Basic concepts of homeostasis. Brookhaven Sym Biol. 1958;10:216–242. [PubMed] [Google Scholar]
- Forbes VE. Is hormesis an evolutionary expectation? Funct Ecol. 2000;14:12–24. [Google Scholar]
- Gentile JH. Commentary: The implications of hormesis to ecotoxicology and ecological risk assessment. BELLE Newslett. 2001;10:12–13. doi: 10.1191/096032701718120364. [DOI] [PubMed] [Google Scholar]
- Giesy JP. Hormesis—Does it have relevance at the population-, community- or ecosystem-levels of organization? BELLE Newslett. 2001;10:14–17. doi: 10.1191/096032701718120373. [DOI] [PubMed] [Google Scholar]
- Goss RJ. Adaptive Growth. London: Logos; 1964. [Google Scholar]
- Hickey RJ, Bowers EJ. Hormesis and homeostasis. In: McAinsh TF, editor. Physics in Medicine and Biology Encyclopedia. Health Physics, Bioengineering and Biophysics. Oxford: Pergamon Press; 1985. [Google Scholar]
- Luckey TD, Stone PC. Hormology in nutrition. Science. 1960;132:1891–1893. doi: 10.1126/science.132.3443.1891. [DOI] [PubMed] [Google Scholar]
- Mertz W. The essential trace elements. Science. 1981;213:1332–1338. doi: 10.1126/science.7022654. [DOI] [PubMed] [Google Scholar]
- Milsum, JH (1966). Biological Control Systems Analysis. New York: McGraw-Hill.
- Moore MN, Stebbing ARD. The quantitative cytochemical effects of three metal ions on a lysosomal hydrolase of a hydroid. J Mar Biol Assoc UK. 1976;56:995–1005. [Google Scholar]
- Morré DJ. Chemical hormesis in cell growth: A molecular target at the cell surface. J Appl Toxicol. 2000;20:157–163. [PubMed] [Google Scholar]
- Newsholme EA, Start C. Regulation in Metabolism. London: Wiley; 1973. [Google Scholar]
- Norton JP, Stebbing ARD. Oscillations in Physiological Systems. London: Institute of Measurement and Control; 1986. Measurement and interpretation of growth rate oscillations in a marine yeast; pp. 61–71. [Google Scholar]
- Parsons P. Hormesis: An adaptive expectation with emphasis on ionizing radiation. J Appl Toxicol. 2000;20:103–112. doi: 10.1002/(sici)1099-1263(200003/04)20:2<103::aid-jat639>3.0.co;2-o. [DOI] [PubMed] [Google Scholar]
- Skov KA. Invited responses to issues associated with the adaptive response: Perspectives from studies in mammalian cells on the response to low radiation doses or to cisplatin. BELLE Newslett. 1999;7:26–30. doi: 10.1191/096032799678840354. [DOI] [PubMed] [Google Scholar]
- Southam CM, Ehrlich J. Effects of extracts of western red cedar heartwood on certain wood-decaying fungi in culture. Phytopathol. 1943;33:5517–5524. [Google Scholar]
- Stebbing ARD. The kinetics of growth control in a colonial hydroid. J Mar Biol Assoc UK. 1981a;61:35–63. [Google Scholar]
- Stebbing ARD. The effects of reduced salinity on colonial growth and membership in a hydroid. J Exp Mar Biol Ecol. 1981b;55:233–241. [Google Scholar]
- Stebbing ARD. Hormesis—Stimulation of colony growth in Campanularia flexuosa (Hydrozoa) by copper, cadmium and other toxicants. Aquat Toxicol. 1981c;1:227–238. [Google Scholar]
- Stebbing ARD. Hormesis—The stimulation of growth by low levels of inhibitors. Sci Tot Environ. 1982;22:213–234. doi: 10.1016/0048-9697(82)90066-3. [DOI] [PubMed] [Google Scholar]
- Stebbing ARD. Growth hormesis—A byproduct of control. Hlth Phys. 1987;52:543–547. doi: 10.1097/00004032-198705000-00003. [DOI] [PubMed] [Google Scholar]
- Stebbing ARD. A theory for growth hormesis. Mut Res. 1998;403:249–258. doi: 10.1016/s0027-5107(98)00014-1. [DOI] [PubMed] [Google Scholar]
- Stebbing ARD. Hormesis: Interpreting the β-curve using control theory. J Appl Toxicol. 2000a;20:93–101. doi: 10.1002/(sici)1099-1263(200003/04)20:2<93::aid-jat640>3.0.co;2-7. [DOI] [PubMed] [Google Scholar]
- Stebbing ARD. Maia hypothesis—Growth control and toxicology. Hum Ecol Risk Assmnt. 2000b;6:301–311. [Google Scholar]
- Stebbing ARD. Increased resistance to copper in hydroids linked to hormesis. Mar Environ Res. 2002;54:805–809. doi: 10.1016/s0141-1136(02)00119-8. [DOI] [PubMed] [Google Scholar]
- Stebbing ARD, Heath GW. Is growth controlled by a hierarchical system? Zool J Linn Soc. 1984;80:345–367. [Google Scholar]
- Stebbing ARD, Hiby L. Cyclical fluctuations in the growth rate of stressed hydroid colonies. In: Naylor E, Hartnoll RG, editors. Cyclic Phenomena in Marine Plants and Animals, Oxford: Pergamon Press; 1979. pp. 165–172. [Google Scholar]
- Stebbing ARD, Pomroy AJ. A sublethal technique for assessing the effects of contaminants using Hydra littoralis. Water Res. 1978;12:631–635. [Google Scholar]
- Stebbing ARD, Norton JP, Brinsley MD. Dynamics of growth control in a marine yeast subject to perturbation. J Gen Microbiol. 1984;130:1799–1808. [Google Scholar]
- Sutar GW. Focus on exposure-response relationships, and complex forms will come naturally. BELLE Newslett. 2001;10:22. doi: 10.1191/096032701718120409. [DOI] [PubMed] [Google Scholar]
- Townsend JF, Luckey TD. Hormoligosis in pharmacology. J Am Med Assoc. 1960;173:44–48. doi: 10.1001/jama.1960.73020190007010. [DOI] [PubMed] [Google Scholar]
- Waddington CH. Tools for Thought. London: Jonathon Cape; 1977. [Google Scholar]


