Abstract
Our attempts to confirm reports of low-dose/hormetic effects in rodent endocrine toxicity studies are reviewed. It is concluded that our present failure to confirm any such effects is due, in large part, to a general lack of understanding of confounding influences and the failure of most investigators to confirm their findings before publication. The major potential confounding factor is suggested to be variability of the parameters under study within control groups, a factor that assumes increased importance when attempting to demonstrate weak low-dose effects. This is illustrated by our studies with bisphenol A in the mouse uterotrophic assay and of finasteride in the Hershberger antiandrogenicity assay. In both of these cases our ability to demonstrate a low-dose effect is dependent on whether concurrent or recent control values are used.
Keywords: low dose, control variability, endocrine disruption, hormesis, antiandrogen, estrogen
DISCUSSION
The available literature on hormetic dose-response effects for chemicals has been reviewed (Calabrese, 2002). These usually involve a stimulatory effect at low doses and an inhibitory effect at high doses, albeit the reverse can sometimes be observed. Few of these reports relate to classical. toxicology, but the prospect that effects may been seen for a chemical below its classically derived “no adverse effect level” (NOAEL) is of obvious interest. Our experiences over the past 6 years when attempting to confirm examples of effects reported for chemicals in rodents exposed at doses below the previously accepted NOAEL value (low-dose effects) are reviewed in the following text.
Initial Attempts to Replicate Low-Dose Effects
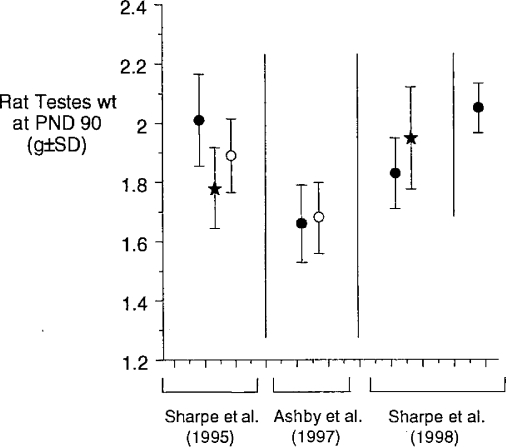
The first example of an apparent low-dose hormetic effect concerned the report that butyl benzyl phthalate (BBP) was capable of reducing rat testes weight at dose levels orders of magnitude below its previously defined reproductive toxicity NOAEL value (Sharpe et al., 1995). We were unable to confirm this example of low-dose endocrine disruption (ED) in two independent repeat experiments (Ashby et al., 1997); neither, subsequently, were Sharpe et al. (1998). Those datasets are shown in Figure 1, the eventual issue being the failure of either group of investigators to understand the differences in control testes weights within laboratories over time and between laboratories (Sharpe et al., 1998). This problem will be developed later herein, but it provided a salutary start to our evaluation of low-dose toxicities of chemicals.
Figure 1.
The low-close effects of BBP (black stars) and octylphenol (OP, open circles) on rat testes. The vertical and horizontal lines segregate the three individual studies discussed.
Low-Dose Effects and Adverse Effects
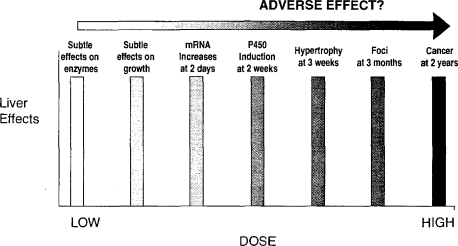
Figure 2 illustrates current difficulties in defining the difference between an adverse effect and a biological response. Most of toxicology is concerned with evaluating the induction of recognized adverse effects such as the chemical induction of cancer. However, there is active consideration of the use of surrogate precursor events to reduce animal usage and to save both time and money. For example, the induction of altered liver foci may represent a short-term alternative to the conduct of a 2-year carcinogenicity bioassay in rodents, and so on, sequentially, across Figure 2. However, the difficulty arises that the effects described on the left-hand side of Figure 2 may bear no functional relationship to cancer, and their use may therefore be inappropriate for its prediction. Furthermore, the events on the right-hand side of Figure 2 may occur at a higher frequency and at lower dose levels than would the classical adverse effect—in this case cancer induction. This issue is not pursued further here, but it alerts to the need to specify the toxicological significance of biological changes, such as in the levels of mRNAs, especially if hormetic dose-response relationships are observed.
Figure 2.
Range of effects that can be induced, and the problem of when to define an effect as adverse.
Nonlinear Dose-Response Relationships in Chemical Endocrine Toxicity
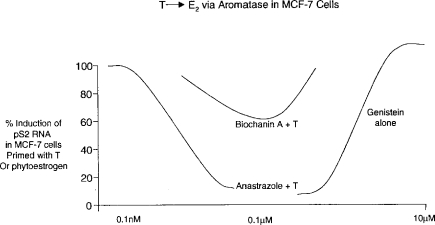
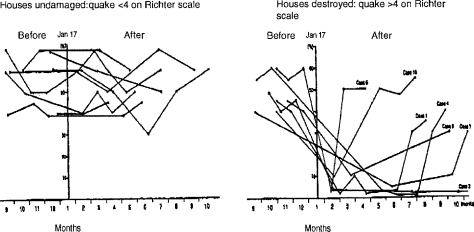
The complexity of endocrine control mechanisms in mammals indicates that nonlinear dose-response relationships should be expected to occur, especially in cases where a chemical is capable of interacting with more than one aspect of endocrine homeostasis. An example of such nonlinear toxicity was recently described by Almstrup et al. (2002; see Figure 3). These investigators demonstrated that stimulation of estrogen-responsive MCF7 cells to divide could be induced by the phytoestrogen genistein and also by testosterone, following its conversion to estradiol via the intrinsic aromatase activity of the cells. Co-administration of the aromatase blocking agent anastrozole countered this activity of testosterone (Figure 3). It was then shown that a range of phytoestrogens, such as biochanin-A, possessed aromatase inhibiting activity at low doses and estrogenic activity at higher doses—the net effect being the production of a hormetic (U-shaped) dose-response curve. Such examples indicate that nonlinear dose-response relationships can be expected to occur with chemical ED, but that significant experimentation is required to establish such effects. Furthermore, the endpoints under study in chemical ED are themselves subject to natural variability—caused, among other unknown factors, by stress. An example of the latter is provided by the loss of sperm motility among survivors of the Kobe earthquake whose dwellings collapsed, as opposed to those whose houses remained intact (Figure 4; Fukada et al., 1996). In fact, control variability probably represents the single greatest current challenge to the study of low-dose ED effects, as discussed in the remainder of this article.
Figure 3.
Illustration of how competing mechanisms may produce nonlinear net effects (based on data of Almstrup et al., 2002). T = testosterone.
Figure 4.
Time course of individual human sperm motility values expressed as % of original values, before and after the Kobe earthquake of Jan 17, 1995. Data based on Fukada et al. (1996).
Concerning Our Failure to Confirm Reported Low-Dose ED Effects of Chemicals
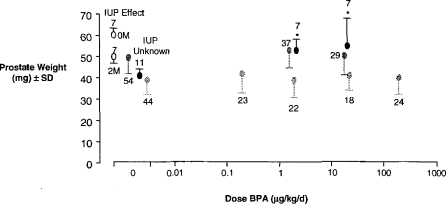
Over the past 6 years we have attempted, without any success, to replicate reports of low-dose ED effects for chemicals. These studies were conducted to define a low-dose effect within our laboratory as a precursor to understanding its molecular mechanism. The data shown in Figure 5 represent the unsuccessful attempts of two groups (Ashby et al., 1999; Cagen et al., 1999) to replicate the trophic effect of extremely low doses of bisphenol A (BPA) on the mouse prostate gland (Nagel et al., 1997). The possible reasons for these disparate findings have been discussed elsewhere (Ashby, 2001). Mindful of the control variability discussed earlier for rat testes weights, it is suggested that the most significant aspect of these studies on BPA is the unaccounted variability of control prostate weights among the several studies—levels of variability that encompass the effects originally claimed for BPA. This control variability is made more interesting given that the observation that initiated concerns over BPA was the demonstration by Nonneman et al. (1992) that intrauterine position affected subsequent prostate weight (Figure 5). Thus, animals adjacent to 2 males in utero (2M) developed lighter prostate glands than those adjacent to 2 females (0M). This observation led Nagel et al. (1997; of the same laboratory as Nonneman et al.) to evaluate the possible effects on prostatic weight of exposure of mice in utero to the weak estrogen BPA. However, the control group for that BPA evaluation showed lower prostate weights than had been reported by Nonneman et al. (1992) and a lower variance. The lower variance is surprising given the lack of knowledge of intrauterine position in the BPA study. Thus, the initially interesting fact is the failure to replicate the original findings for BPA. yet the scientifically most interesting finding is the intrinsic and unaccounted variability in the test parameter—control prostate weights.
Figure 5.
The effect of intrauterine position (IUP, open circles; Nonneman et al., 1992) and BPA on the CF1 mouse prostate gland. Data for BPA were taken from three independent studies: Nagel et al. (1997; black circles), Cagen et al. (1999; light grey circles) and Ashby et al. (1999; dark grey circles). A statistically significant increase in prostate weight was observed by Nagel et al. (1997) and is indicated by*.
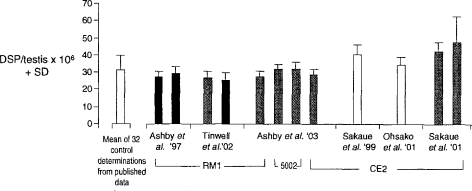
Figure 6 illustrates similar problems encountered when we failed to confirm (Ashby et al., 2003) the finding by Sakaue et al. (2001) that similarly low doses of BPA are able to reduce daily sperm production (DSP) in mature Sprague Dawley rats. The data shown in Figure 6 list control DSP data from both laboratories, each using a range of animal diets and strains of rat, and values taken from 38 studies reported in the literature from other laboratories. Thus, again, the magnitude of the effects reported by Sakaue et al. (2001) for BPA fell within the range of control variability within and between laboratories.
Figure 6.
Comparison of control DSP data. Three strains of rat were used: Holtzman (white columns); AP rats (black columns). and SD rats (grey columns). The hatched column indicates the mean of 32 control datasets taken from the literature. The data shown as Ashby et al. ’03, and those to the right of them, are comparable in terms of age of animal, etc. The other data are shown for interest and do not appear to be significantly different from the data shown as Ashby et al. ’03 despite differences in the age of the animals, etc.
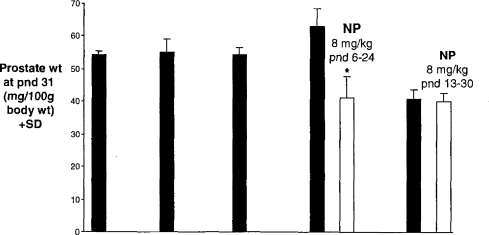
Figure 7 demonstrates an even more marked example of the dangers inherent in interpreting apparent chemically induced effects in the absence of full knowledge of the sources and extent of control variability of the parameter under study. Thus, Lee (1998) reported that relatively low doses of nonylphenol were able to reduce the prostate weight of rats exposed between postnatal day (pnd) 6–24, but not when exposed between pnd 13–30. We were unable to confirm those findings (Odum and Ashby, 2000), but the thing of greater interest was that no account was taken by Lee (1998) of the dramatic difference between the first 4 and the fifth of what should have been 5 identical control group prostate weights (Figure 7). Until the sources of such variability (Figures 5–7) are recognized and controlled it seems to be of lesser interest to be concerned about chemically induced changes within those same control ranges.
Figure 7.
Rat prostate weights of five identical control groups (black columns; Lee, 1998). All rats had similar body weights at pnd 31. Effects were concluded for NP (white columns) in the fourth study, but not in the fifth study.
Uterotrophic Activity of Low Doses of BPA in the Rat
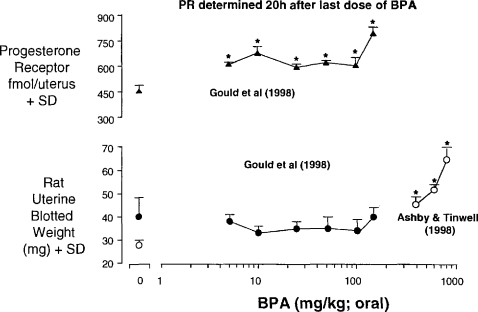
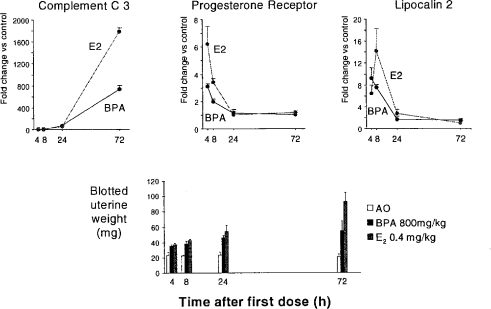
Two reports exist on the uterotrophic activity of BPA. Gould et al. (1998) reported inactivity at doses up to 150 mg/kg/day whereas Ashby and Tinwell (1998) reported activity at higher doses. Both sets of data probably form part of the same dose response, with one laboratory ceasing the testing at lower doses (Figure 8). Gould et al. also reported induction of the progesterone receptor (PR) at all of the doses evaluated, and for which no uterotrophic activity was seen. Gould et al. quantitated PR levels by receptor isolation 20 h after the third of the three daily doses of BPA. These data therefore raised the prospect of estrogen-dependent protein changes (here PR) occurring at dose levels that failed to trigger a phenotypic change in the animals. We have therefore extended the observations made by Gould et al. by using real-time polymerase chain reaction (rtPCR) for evaluation of PR mRNA and the mRNAs for two other estrogen-responsive genes (Complement C3 and lipocalin 2). Time course data for a high dose of BPA and for estradiol are shown in Figure 9. It is clear that there is no optimum time for evaluation of all of the genes, so a time course is being determined for both the uterotrophic effects and the gene expression changes. It is of interest that the 20 h time point chosen by Gould et al. to evaluate PR levels was not optimum—4 h is the optimum time (Figure 9). The dose range of BPA being evaluated (2 μg/kg–800 mg/kg) should reveal whether changes in gene expression can occur at doses below any phenotypic change. As such they will contribute to the discussion of low-dose effects in general and hormesis in particular. The data in Figure 9 are shown here to illustrate the commitment of effort required to establish low-dose effects with confidence when surrogate markers, such as proteins, are used in place of recognized toxicity endpoints.
Figure 8.
Activity of BPA in the immature rat uterotrophic assay.
Figure 9.
Uterotrophic activity of BPA and estradiol (E2) in the immature rat, and related gene expression effects (Odum and Ashby, unpublished 2003).
Uterotrophic Activity of Low Doses of BPA in the Mouse
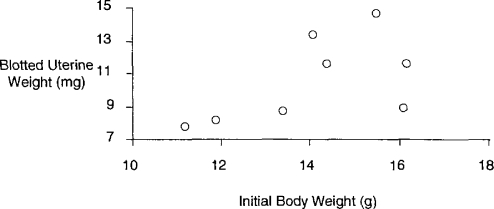
Despite the clear uterotrophic activity of BPA in the rat, great difficulties were encountered when assessing this activity in the mouse (Tinwell et al., 2000). A total of eight experiments were conducted, as shown in Table 1. When all of the data were merged no significant uterotrophic effects were seen (Table 1). However, the few positive responses observed were statistically significant and considered unlikely to have arisen by chance, and the first experiment gave evidence of a possible biphasic response—thus, the many repeat experiments conducted to reach a clear outcome to the studies. However, when the data are rearranged in order of increasing concurrent control uterine weight (Table 2), it becomes clear that BPA gives positive responses when the control weights are low and negative when they are high. In fact, the control values within these eight studies are within an acceptable range, so, formally, all of the responses are of equal biological weight. These observations raise the question of whether the sensitivity of the assay is directly related to the control uterine weights; however, there is no apparent way to regulate these control weights because they are not obviously related to the initial body weights of the test animals (Figure 10). These data therefore echo the mouse prostate data discussed earlier in so much as they suggest the following: some low-dose effects may only be discernable when the parameter under study is at the lower end of the acceptable control range observed between and within experiments.
Table 1.
Activity of BPA (by sc injection) in the immature mouse uterotrophic assay. A total of 600 mice were used in these studies. Data taken from Tinwell et al. (2000)
| Expt. no | Dose level of BPA (μg/kg)
|
|||||||||||||||||
|---|---|---|---|---|---|---|---|---|---|---|---|---|---|---|---|---|---|---|
| 0 | 0.02 | 0.2 | 2.0 | 20 | 200 | 500 | 1000 | 2000 | 5000 | 10,000 | 20,000 | 50,000 | 100,000 | 200,000 | 300,000 | |||
| Mean blotted weight (mg) | 1 | 8.0 | + | − | − | + | ||||||||||||
| 2 | 11.6 | − | − | − | − | − | − | − | + | |||||||||
| 3 | 13.3 | − | − | − | − | − | ||||||||||||
| 4 | 11.6 | − | − | − | − | − | ||||||||||||
| 5 | 14.6 | − | − | − | − | |||||||||||||
| 6 | 7.7 | − | − | + | ||||||||||||||
| 7 | 8.1 | − | − | + | ||||||||||||||
| 8 | 8.7 | − | − | − | + | − | + | + | + | |||||||||
| Overall mean ± SD (n) | 10.2 ±4.4 (110) | 10.0 ± 1.8 (8) | 10.5 ± 2.6 (25) | 12.5 ± 3.4 (46) | 8.9 ± 2.8 (54) | 10.5 ± 4.3 (94) | 9.1 ± 2.1 (12) | 9.6 ± 2.6 (12) | 13.0 ± 5.1 (35) | 11.0 ± 2.0 (12) | 9.6 ± 1.4 (12) | 10.5 ± 1.7 (33) | 10.9 ± 1.4 (12) | 11.3 ± 1.8 (12) | 11.4 ± 2.5 (107) | 12.0 ± 2.9 (16) | ||
Table 2.
Activity of BPA (by sc injection) in the immature mouse uterotrophic assay. A total of 600 mice were used in these studies. Data taken from Tinwell et al. (2000)
| Expt. no | Dose level of BPA (μg/kg)
|
|||||||||||||||||
|---|---|---|---|---|---|---|---|---|---|---|---|---|---|---|---|---|---|---|
| 0 | 0.02 | 0.2 | 2.0 | 20 | 200 | 500 | 1000 | 2000 | 5000 | 10,000 | 20,000 | 50,000 | 100,000 | 200,000 | 300,000 | |||
| Mean blotted weight (mg) | 6 | 7.7 | − | − | + | |||||||||||||
| 7 | 8.1 | − | − | |||||||||||||||
| 8 | 8.7 | − | − | − | + | − | + | + | + | |||||||||
| 1 | 8.9 | + | − | − | + | |||||||||||||
| 2 | 11.6 | − | − | − | − | − | − | − | − | |||||||||
| 4 | 11.6 | − | − | − | − | − | ||||||||||||
| 3 | 13.3 | − | − | − | − | − | ||||||||||||
| 5 | 14.6 | − | − | − | − | |||||||||||||
| Overall mean ± SD (n) | 10.2 ±4.4 (110) | 10.0 ± 1.8 (8) | 10.5 ± 2.6 (25) | 12.5 ± 3.4 (46) | 8.9 ± 2.8 (54) | 10.5 ± 4.3 (94) | 9.1 ± 2.4 (12) | 9.6 ± 2.6 (12) | 13.0 ± 5.1 (35) | 11.0 ± 2.0 (12) | 9.6 ± 1.4 (12) | 10.5 ± 1.4 (12) | 10.9 ± 1.4 (12) | 11.3 ± 1.8 (12) | 11.4 ± 2.5 (107) | 12.0 ± 2.9 (16) | ||
Figure 10.
Mouse control body weight vs. mouse control uterine weight (taken from 8 sc injection studies on BPA, Tinwell et al., 2000).
A Possible Example of Hormesis for Finasteride?
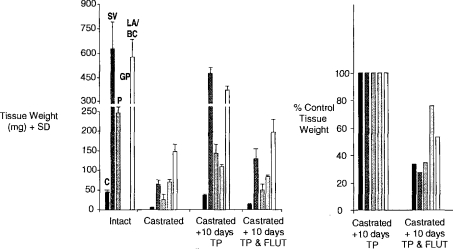
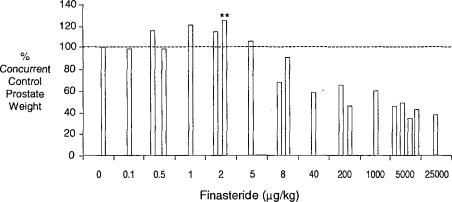
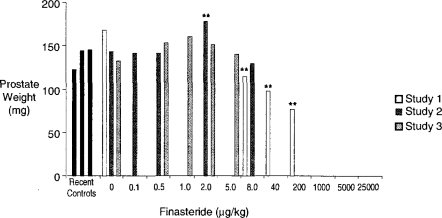
The Hershberger castrated male rat assay (Hershberger et al., 1953; Ashby and Lefevre, 2000) is currently the primary rodent assay for the detection of antiandrogens. The data derived from this assay, and the method of data presentation, are shown in Figure 11 (based on Ashby and Lefevre, 2000; and unpublished data, 2003). Finasteride is an inhibitor of the enzyme that converts testosterone to dihydrotestosterone (5α-reductase), the agent being required for the growth of the androgen-dependent tissues evaluated in the Hershberger assay. The data shown in Figure 12 represent a composite of three experiments conducted on finasteride, each experiment probing lower doses than in the previous experiment. Only the prostate gland is shown, but all of the tissues were sensitive to the antiandrogenic effects of finasteride at doses above 8 μg/kg. At first sight, these data support the existence of a classic inverted-U hormetic dose response induced by finasteride in the prostate gland. However, when the individual experiments are separated and expressed in terms of absolute prostate weight, the picture becomes more clouded (Figure 13). The only statistically significant increase in prostate weight occurred in the second of the three experiments, and that response was similar to the control prostate weight in the first of the three experiments. As with all of the examples discussed, further experimentation will be required to determine with confidence whether or not a hormetic effect has been established in this case. The particular danger is that reporting the second experiment in isolation would have added, perhaps spuriously, to the literature of hormesis. This example illustrates the current need to evaluate how historical control data should influence interpretation of chemical ED test data.
Figure 11.
Tissue weights at termination of the Hershberger assay (FLU = flutamide; TP = testosterone propionate; C = Cowpers gland, SV = seminal vesicles; P = prostate; GP = glans penis; and LA/BC is the levator ani/bulbocavernosus muscle. Tissue weights for intact animals at the end of the experiment are shown, together with those for castrated rats, and castrated rats exposed for 10 days to TP. An antiandrogen such as FLU reduces the TP-induced tissue growth. Data are expressed as % TP control.
Figure 12.
Hershberger assay data of finasteride showing only prostate weight data (expressed as % control; see Figure 11; Ashby et al., unpublished 2003).
Figure 13.
Absolute prostate weights in Hershberger assays on finasteride based on Figure 12; Ashby et al., unpublished 2003).
CONCLUSIONS
The possible induction of hormetic/low-dose effects in the field ED represents an interesting and potentially important area of study. However, experience to date indicates that progress will only be made when greater attention is paid to the confirmation of effects before they are reported in the literature, coupled with acquisition of control databases for the parameters under study linked to an understanding of the experimental influences that affect control variability.
REFERENCES
- Almstrup K, Fernandez MF, Petersen JH, Olea N, Skakkebaek NE, Leffers H. Dual effects of phytoestrogens result in U-shaped dose-response. Environ Hlth Perspect. 2002;110:743–748. doi: 10.1289/ehp.02110743. [DOI] [PMC free article] [PubMed] [Google Scholar]
- Ashby J. Toward resolution of the divergent effects of estrogens on the prostate gland of CF1 mice. Environ Hlth Perspect. 2001;109:A109–A110. doi: 10.1289/ehp.109-a109. [DOI] [PMC free article] [PubMed] [Google Scholar]
- Ashby J, Lefevre PA. Preliminary evaluation of the major protocol variables for the Hershberger castrated male rat assay for the detection of androgens, antiandrogens, and metabolic modulators. Regul Toxicol Pharmacol. 2000;31:92–105. [Google Scholar]
- Ashby J, Tinwell H. Activity of bisphenol-A in immature rat uterotrophic assays. Environ Hlth Perspect. 1998;106:719–720. doi: 10.1289/ehp.98106719. [DOI] [PMC free article] [PubMed] [Google Scholar]
- Ashby J, Tinwell H, Lefevre PA, Odum J, Paton D, Millward SW, Tittensor S, Brooks AN. Normal sexual development of rats exposed to butyl benzyl phthalate from conception to weaning. Regul Toxicol Pharmacol. 1997;26:102–118. doi: 10.1006/rtph.1997.1159. [DOI] [PubMed] [Google Scholar]
- Ashby J, Tinwell H, Haseman J. Lack of effects for low dose levels of bisphenol A (BPA) and diethylstilbestrol (DES) on the prostate gland of CF1 mice exposed in utero. Regul Toxicol Pharmacol. 1999;30:156–166. doi: 10.1006/rtph.1999.1317. [DOI] [PubMed] [Google Scholar]
- Ashby J, Tinwell H, Lefevre PA, Joiner R, Haseman J. The effect on sperm production in adult SD rats exposed by gavage to BPA between postnatal days 91–97. Toxicol Sci. 2003;74:129–138. doi: 10.1093/toxsci/kfg093. [DOI] [PubMed] [Google Scholar]
- Cagen SZ, Waechter JM, Dimond SS, Breslin WJ, Butala JH, Jekat FWm, Joiner RL, Shiotsuka RN, Veenstra GE, Harris LR. Normal reproductive organ development in CF1 mice following prenatal exposure to bisphenol A. Toxicol Sci. 1999;50:36–44. doi: 10.1093/toxsci/50.1.36. [DOI] [PubMed] [Google Scholar]
- Calabrese EJ. Hormesis: Changing view of the dose-response, a personal account of the history and current status. Mutat Res. 2002;511:181–189. doi: 10.1016/s1383-5742(02)00013-3. [DOI] [PubMed] [Google Scholar]
- Fukada M, Fukada K, Shimizu T, Yomura W, Shimizu S. Kobe earthquake and reduced sperm motility. Hum Reprod. 1996;11:1244–1246. doi: 10.1093/oxfordjournals.humrep.a019365. [DOI] [PubMed] [Google Scholar]
- Gould JC, Leonard LS, Maness SC, Wagner BL, Conner K, Zacharewski T, Safe S, McDonnell DP, Gaido KW. Bisphenol A interacts with the estrogen receptor alpha in a manner distinct from estradiol. Mol Cell Endocrinol. 1998;142:203–214. doi: 10.1016/s0303-7207(98)00084-7. [DOI] [PubMed] [Google Scholar]
- Hershberger LG, Shipley EG, Meyer RK. Myotrophic activity of 19-nortestosterone and other steroids determined by the modified levator ani muscle method. Proc Soc Exp Biol Med. 1953;83:175–180. doi: 10.3181/00379727-83-20301. [DOI] [PubMed] [Google Scholar]
- Lee PC. Disruption of male reproductive tract development by administration of the xenoestrogen, nonylphenol, to male newborn rats. Endocrine. 1998;9:105–111. doi: 10.1385/ENDO:9:1:105. [DOI] [PubMed] [Google Scholar]
- Nagel SC, vom Saal F, Thayer KA, Dhar MG, Boechler M, Welshons W. Relative binding affinity-serum modified access (RBA-SMA) assay predicts the relative in vivo bioactivity of the xenoestrogens bisphenol A and octylphenol. Environ Hlth Perspect. 1997;105:70–76. doi: 10.1289/ehp.9710570. [DOI] [PMC free article] [PubMed] [Google Scholar]
- Nonneman DJ, Ganjam VK, Welshons WV, vom Saal FS. Intrauterine position effects on steroid metabolism and steroid receptors of reproductive organs of male mice. Biol Reprod. 1992;47:723–729. doi: 10.1095/biolreprod47.5.723. [DOI] [PubMed] [Google Scholar]
- Odum J, Ashby J. Neonatal exposure of male rats to nonylphenol has no effect on the reproductive tract. Toxicol Sci. 2000;56:400–404. doi: 10.1093/toxsci/56.2.400. [DOI] [PubMed] [Google Scholar]
- Ohsako S, Miyabara Y, Nishimura N, Kurosawa S, Sakaue M, Ishimura R, Sato M, Takeda K, Aoki Y, Sone H, Tohyama C, Yonemoto J. Maternal exposure to a low dose of 2,3,7,8-tetrachlorodibenzo-p-dioxin (TCDD) suppressed the development of reproductive organs in male rats: Dose-dependent increase in mRNA levels of 5α-reductase type 2 in contrast to decrease of androgen receptor in pubertal ventral prostate. Toxicol Sci. 2001;60:132–143. doi: 10.1093/toxsci/60.1.132. [DOI] [PubMed] [Google Scholar]
- Sakaue M, Ohsako S, Ishimura R, Kurosawa S, Kurohmaru M, Hayashi Y, Aoki Y, Yonemoto J, Tohyama C. Preliminary BPA experiment. Abs., p47 A28; Presented at 127th Annual Meeting of Jpn Soc. Vetinerary Sci.; Fujisawa, Japan. 1999. [Google Scholar]
- Sakaue M, Ohsako S, Ishimura R, Kurosawa S, Kurohmaru M, Hayashi Y, Aoki Y, Yonemoto J, Tohyama C. Bisphenol A affects spermatogenesis in the adult rat even at a low dose. J Occup Hlth. 2001;43:185–190. [Google Scholar]
- Sharpe RM, Fisher JS, Millar MM, Jobling S, Sumpter JP. Gestational and lactational exposure of rats to xenoestrogens results in reduced testicular size and sperm production. Environ Hlth Perspect. 1995;103:1136–1143. doi: 10.1289/ehp.951031136. [DOI] [PMC free article] [PubMed] [Google Scholar]
- Sharpe RM, Turner KJ, Sumpter JP. Endocrine disruptors and testis development. Environ Hlth Perspect. 1998;106:A220–A221. doi: 10.1289/ehp.106-1533085. [DOI] [PMC free article] [PubMed] [Google Scholar]
- Tinwell H, Joiner R, Pate I, Ashby J. Uterotrophic activity of Bisphenol A (BPA) in the immature mouse. Reg Toxicol Pharmacol. 2000;32:118–126. doi: 10.1006/rtph.2000.1412. [DOI] [PubMed] [Google Scholar]
- Tinwell H, Haseman J, Lefevre PA, Wallis N, Ashby J. Normal sexual development of two strains of rat exposed to low doses of bisphenol A in utero. Toxicol Sci. 2002;68:339–348. doi: 10.1093/toxsci/68.2.339. [DOI] [PubMed] [Google Scholar]


