Abstract
The study of electrical network systems, integrated with chemical signaling networks, is becoming a common trend in contemporary biology. Classical techniques are limited to the assessment of signals from doublets or triplets of cells at a fixed temporal bin width. At present, full characteristics of the electrical network distribution and dynamics in plant cells and tissues has not been established. Here, a 60-channels multielectrode array (MEA) is applied to study spatiotemporal characteristics of the electrical network activity of the root apex. Both intense spontaneous electrical activities and stimulation-elicited bursts of locally propagating electrical signals have been observed. Propagation of the spikes indicates the existence of excitable traveling waves in plants, similar to those observed in non-nerve electrogenic tissues of animals. Obtained data reveal synchronous electric activities of root cells emerging in a specific root apex region. The dynamic electrochemical activity of root apex cells is proposed to continuously integrate internal and external signaling for developmental adaptations in a changing environment.
Keywords: action potential, neuroid conduction, electrogenic tissues, Multi Electrode Array (MEA)
Electrically excitable cells are present in many multicellular organisms, especially in brains of animals (1). However, they are also present in lower animals such as sponges, which lack central nervous system (2) and in animals having excitable epithelia, which can conduct signals via neuroid conduction (3, 4). Conducted electrical events may serve for translation of environmental parameters and cues, obtained via sensory systems, into biological information and processes. In plants, most cells are electrically excitable and active, releasing and propagating action potentials (APs), which may affect such central physiological processes as photosynthesis and respiration (5). Moreover, electrical signals are believed to play a central role in intercellular and intracellular communication (6, 7) at all levels of evolution from algae (8), to bryophytes (9) and higher plants (10–12).
The first report describing electrical signals in plants was published over 200 years ago (13); after the study of Burdon-Sanderson (14) and Darwin (15, 16) on carnivorous plants, electricity became a very important subject of research in plants so that in the 1920s and 1930s, the analysis of the action potential in Nitella preceded that in the giant axon of the squid (17). Since then, many researchers have made detailed analyses of the electrical activity of single cells by using microelectrodes for intracellular recordings (6). However, such techniques cannot address integrated issues of how large assembly of cells can combine information both spatially and temporally. In fact, it is technically difficult to record from and stimulate more than 3 cells using standard intracellular microelectrodes, and those cells usually die within minutes or, rarely, hours (18). In non-plant systems, optical techniques using voltage-sensitive dyes, although showing good spatial resolution, suffer from low signal-to-noise ratio (19).
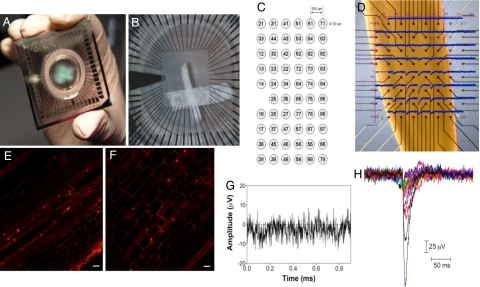
The MEA technology has been intensively used in neuroscience for spike recording in brain slices (20), dissociated neuronal cultures (21), retinas (22), cardiac myocytes (23) and generally in any electrogenic animal tissues. However, it has never been used in plants. Since the first description of the MEA technology, 35 years ago by Thomas et al. (24), the tools, materials and protocols for MEA use in cell and tissue assays have been continually improved (25–28). The MEA set-up is used as a noninvasive method for monitoring spontaneous and evoked activity as a change in the electrical potential of the intercellular space surrounding the cell at up to 60 sites in the tissue (see for example 29 for an exhaustive survey of the technique). Using longitudinal or transverse slices of the root apex of maize and an array of 60 microelectrodes (Fig. 1 A–C), we describe here the initiation and propagation of spontaneous and chemically-elicited electrical activity and the spatiotemporal characteristics of the electrical network of the root apex.
Fig. 1.
General characteristics of the MultiElectrode-Array system (MEA. (A) Overview of a 60 electrodes MEA device. External dimensions are 5 × 5 cm. (B) Longitudinal section of root apex fixed onto the MEA using adhesive water permeable and water resistant tape. (C) Matrix of the array of microelectrodes reporting the number of each single channel. (D) Magnified view of the recording site with the single traces superimposed (interelectrode distance 200 μm). (E and F) Confocal images of maize root cells prestained with propidium iodide (5 μg/mL) for 10 min. Scale bar, 50 μm, before (E) and after (F) a recording session. (G) Background noise of the MEA system. (H) Recordings of spontaneous spikes. Fifteen traces are superimposed to illustrate the typical shape and size. Data were digitized at 20 KHz.
Results
General Characteristics of Spontaneous Activity.
We recorded electrical responses of 218 different primary roots of maize in distinct experiments conducted across 50 recording sessions. Multiple experiments can be conducted in a single recording session. An example of the responses recorded from one root apex is illustrated in Fig. 1D. As depicted in the figure, not all of the 60 microelectrodes were in contact with the root and, at a given time, not all of the regions of the root apex showed electrical activity. The possible injury of the root cells was routinely assessed at the end of each measurement using the fluorescent exclusion dye propidium iodide. The cationic dye does not cross intact membranes but it links to cell wall components, staining the contours of living root cells both before and after (Fig. 1 E and F, respectively) the MEA recording.
Extracellularly recorded spikes are usually embedded in biological and thermal noise of ≈10–20 μV peak-to-peak (Fig. 1G), and they can be detected by using a threshold-based algorithm. The threshold used in the data presented here was calculated as a multiple (n = 5) of the basal noise. The signal-to-noise (S/N) ratio, defined as the peak-to-peak voltage value of the largest recorded signal divided by the mean peak-to-peak voltage value in the absence of any spike, is a useful measure of the quality of the recording (30). The S/N ratio on different channels and different recording sessions ranged from 6 to 15 with an average S/N ratio over all sessions of 8.7 ± 1.4.
To determine the characteristics of single individual spikes, their shape, durations and amplitudes were measured in replicated trials. Fig. 1H shows a representative recording of 15 spontaneous signals detected by the MEA from a 2-day-old root of maize. The signals are aligned at their maximum negative deflections. The amplitude recorded in all of the experiments ranged approximately from 30 to 400 μV. Amplitude depends very much on the distance of the electrodes from the site of generation of the signal. As a result, it is not easy to fully reconstruct the exact amplitude of a single spike (31) and the data recorded must be regarded more for their time characteristics (time of appearance and duration) than for the absolute value of the amplitude.
In general, in different experiments, the duration of the detected spikes has been estimated to be ≈36–40 ms (Fig. S1). It is also worth noting that, because of noise, the duration seems to be smaller for the spikes of small amplitude. In fact, the amplitude of the tail of the smaller signals was of the same order as the noise amplitude. In particular, the duration of the spikes turned out to be proportional to their amplitude (Fig. S1). This linear dependence suggests that these electrical events have a fixed temporal duration determined by the physiological features of the cell membrane.
To test whether intact root tips (neither excised from the plants, nor sliced as required for MEA) exhibit electrical signals of the same nature of those recorded with the MEA, we used conventional microelectrodes inserted into cortical cells of the transition zone. The results demonstrate a spontaneous electrical activity characterized by spikes with the same shape, duration and rate of appearance (i.e., frequency), as those recorded with the MEAs (Fig. S2 A and B).
Synchronization and Propagation of the Spikes.
The electrical signals detected at any single site in the extracellular space must be regarded as the sum of contributions coming from all of the current sources in contact with each electrode and within the recording horizon of the electrode (32, 33). In maize root, the cells under study can be considered large with respect to the electrode, and homogeneous in morphology (34). A previous study demonstrated that a 30-μm electrode covers a detection area of no more than 100 μm in diameter (35). Therefore, by using an IED (interelectrode distance) of 500 μm, it is reasonable to assume that the electrical signals generated by a single root cell (diameter of 80–100 μm on average) will be detected by just 1 electrode.
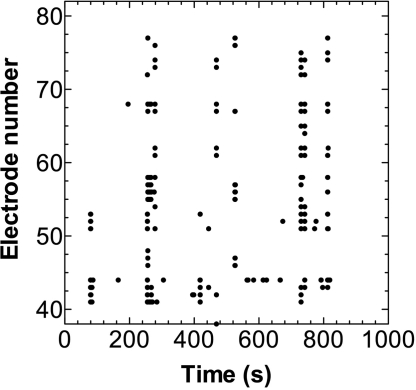
The spikes in the maize root apex followed a specific pattern of activity with spikes that developed spontaneously on many electrodes at the same time forming periods of synchronized activity, separated by intervals of many seconds of no activity (Fig. 2). This appears to be the first observation of synchronized electrical activity in plants.
Fig. 2.
Representative raster plot of the spontaneous activity recorded from different active electrodes in maize root cells during a 15-min experiment.
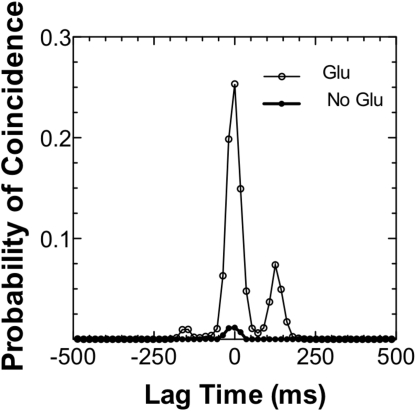
To characterize the occurrence of this phenomenon, we calculated the coincidence probability between spikes trains measured at different groups of electrodes (36, 37). In Fig. 3, the distribution of coincidence probabilities P for different values of τ is shown. The highest peak at τ = 0 is evidence of the high amount of synchronized events within the temporal bin Δt = 18 ms, which was chosen to be smaller than the average spike duration (≈40 ms) and larger than the propagation time (1.3 ± 1.2 ms). Because the peak at τ = 0 is highest in comparison with other τ's, we can reasonably state that the synchronization is a well-established phenomenon in root cells. Interestingly, treating the roots with lglutamate (1 mM) led to a strong increase in the number of synchronized events compared with those recorded in the standard solution containing just CaCl2 (Fig. 3).
Fig. 3.
Distribution of the coincidence probabilities measured between spikes trains obtained from electrodes A and B. The x axis represents the temporal shift τ = ± nΔt between APs trains A and B for Δt = 18 msec. The probability at each τ reports APs coincidences found in the temporal range Δt throughout the spike trains of length 800 s.
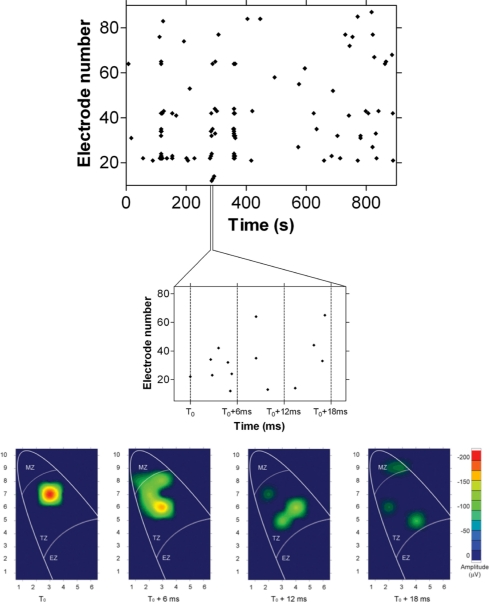
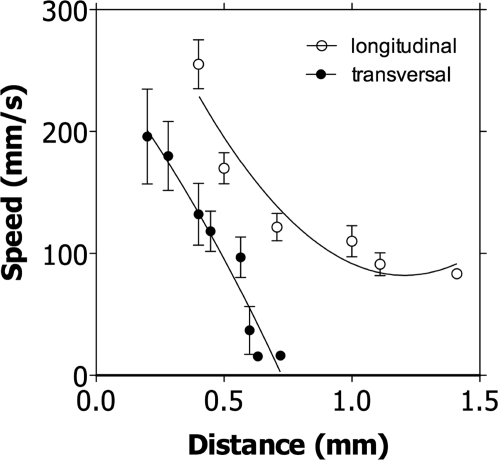
Looking at higher time resolution the electrical events grouped together in each single “burst” of activity revealed that the “synchronized” events are composed of a quite complex spatiotemporal pattern (Fig. 4). In fact, when the data were binned at finer temporal resolution it became clear that the electrical signals did not appear on all electrodes at exactly the same time (Fig. 4 Middle and Bottom); instead some spikes occurred before others. This spatiotemporal evolution suggests the hypothesis of a center of excitation from which spikes develop and propagate across the cells, repeating the same pattern in every frame. Higher-temporal-resolution analysis of each frame allowed the visualization of a spread of the impulse across the root apex (Fig. 4 Bottom). Both in the transversal and in the longitudinal direction the velocity of the spikes decreased with the propagation of the signal away from the center of excitation (Fig. 5). This decrease was much more pronounced in the transversal direction.
Fig. 4.
Activity within synchronized periods. Raster plot of spontaneous activity (Top) shows correlated periods containing spatiotemporal patterns (Middle) and a burst in the original coordinates of the multielectrode array (Bottom). Burst is defined as sequences of synchronous activity that were preceded and terminated by a bin width of Δt = 1.2 s with no activity. A high-temporal-resolution map of the spatial propagation of a single impulse generated at the time 0 is shown (Bottom). A wide spread of the signal is evident.
Fig. 5.
Velocity of spreading electrical events in longitudinal and transverse sections (taken at the level of the transition zone) of the root apex. At increasing distance away from the Center of propagation, the velocity of the AP decreases. Data are means ± SD, n = 56.
Effects of Calcium and Glutamate.
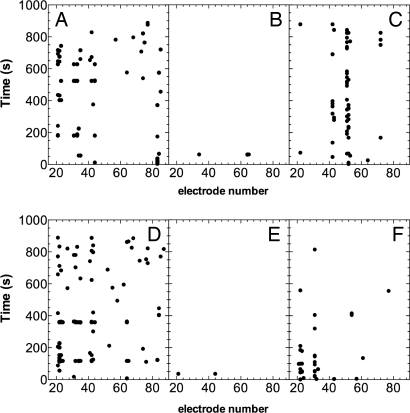
As expected, the presence of calcium was critical. In solutions deprived of calcium, we were unable to detect any signal. Increasing external calcium concentration from 3 to 5 mM caused a significant (P < 0.01) increase in the rate of appearance of the spikes (from 3.0 ± 0.4 spikes per second at 3 mM to 4.4 ± 0.7 spikes per second at 5 mM). The results are summarized in Table 1. Spikes were almost totally inhibited, at any external Ca2+ concentration, by incubating the root for 2 h in presence of 1 mM gadolinium, a commonly used blocker of plasma membrane Ca2+ channels (Fig. 6 A and B). The detection of signals after overnight recovery of the root (the root was gently stirred in working solution) revealed a restoration of the electrical network activity (Fig. 6C).
Table 1.
Kinetic parameters (rate of appearance and amplitude) of spikes in the root apex of maize in response to different pharmacological treatments
| Treatment | Rate, spikes per minute | Amplitude, μV |
|---|---|---|
| Ca2+ 3 mM | 3.0 ± 0.4 | −51.50 ± 5.2 |
| Ca2+ 5 mM | 4.41 ± 0.7 | −54.8 ± 6.3 |
| Gd3+ | 0.2 ± 0.07 | −66.7 ± 7.2 |
| Gd3+ recovery | 3.6 ± 0.5 | −97.7 ± 11.2 |
| Glu 0.5 mM | 9.32 ± 0.4 | −53.1 ± 6.0 |
| Glu 1 mM | 26.96 ± 1.9 | −102.7 ± 12.3 |
| Glu 2 mM | 31.32 ± 2.1 | −61.3 ± 7.8 |
| DNQX | 0.13 ± 0.05 | −41.7 ± 5.2 |
| DNQX recovery | 3.12 ± 0.3 | −46.9 ± 5.0 |
Results reported as means ± SD, n = 15.
Fig. 6.
Raster plot of spontaneous activity recorded from 60 electrodes (linear order) in maize root under the following conditions: (A) CaCl2 5 mM. (B) CaCl2 plus GdCl3 1 mM. (C) Restored electrical activity after washing out of Gd3+ and overnight recovery. (D) Glutamate 1 mM + CaCl2 5 mM. (E) Glutamate 1 mM + CaCl2 5 mM plus DNQX 2.5 mM. (F) Restored electrical activity after washing out of DNQX and overnight recovery.
Recent evidence supports the hypothesis that extracellular lglutamate acts as a signaling molecule in plants (38), especially in roots (39, 40), by inducing a depolarization due, at least partially, to the passage of Ca2+ across the plasma membrane (41, 42). Genetic evidence also suggests that GLRs (Glutamate Like Receptors) are essential for organization and functioning of primary root apices (43). Application of 0.5 mM L-glutamate to a solution containing 5 mM CaCl2, enhanced significantly (P < 0.001) the rate of appearance of the spikes from 4.4 ± 0.7 to 9.3 ± 0.4 min−1; the effect at higher glutamate concentrations (1 and 2 mM) was even more marked as the rates increased to 26.7 ± 1.9 and 31.3 ± 2.1 min−1, respectively (Table 1). Furthermore, the L-glutamate treatment significantly enhanced the appearance of synchronized events (Fig. 6) even though the rate of appearance of the spikes, after the administration of L-glutamate, was not time-steady. In fact, after a first excitatory effect lasting ≈5 min, the rate declined to a level close to the one measured in the presence of CaCl2 alone (Fig. S3). In all of the tested roots, the L-glutamate-evoked increase in activity was significantly (P < 0.001) attenuated to 0.13 ± 0.07 spikes per minute (Table 1 and Fig. 6 D and E) by the receptor antagonist DNQX (incubation 2 h; DNQX 2.5 mM). Here, again it was possible to restore the electrical activity of the root after overnight recovery (Fig. 6F)
Localization of Activity in the Root Apex.
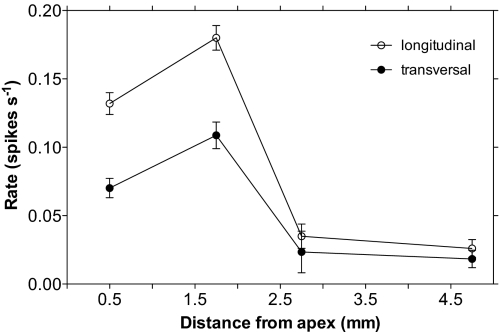
Because the geometry of MEA allows simultaneous recording from a root region of 5 × 3 mm, each experiment provided data from a quite large area of the root apex, including meristem, transition zone, and elongation region. In each experiment performed, whatever the nature of the treatment, the most active root part was revealed to be the transition zone. This region, irrespective of whether analyzed in transverse or longitudinal sections, showed a higher electrical activity than the neighboring root apex zones (Fig. 7 and Fig. S4). Moreover, a higher collective activity of groups of cells, i.e., synchronization, can be observed in the same region of the root apex (see Movie S1).
Fig. 7.
Spatial localization of the electrical activity in longitudinal and transversal section of the root apex. Data are presented as means ± SD, n = 43.
Discussion
The main insight gained in this study relates to the widespread potential for generation and conduction of spikes in the cells of a plant root apex. To investigate the complex behavior of the electrical network in the root apex we used in plants, a MultiElectrode Array approach.
Neuroid Conduction in Plants.
Electrical events in plants are normally associated with an external stimulation (5, 7, 11). In the present study we demonstrate that a great number of spontaneously generated electrical signals exist in cells of the root apex. The duration (≈40 ms) and velocity of conduction up to 20 cm·s−1, appear to be well in the range needed for an efficient transmission of the signals on local basis and not far from the conduction velocities detected in nerve cells of invertebrates such as hydromedusae or siphonophores (35–50 cm·s−1) (44) or hemichordate worms (17–40 cm·s−1) (45). In plants different authors published different speeds of propagation (ranging from 0.2 cm·s−1 to 130 m·s−1) (11, 46, 47) even for the same species (see for example different propagation velocities in tomato in refs. 11 and 46).
The plasmodemata are a possible structural pathway for the propagation of the spikes in the cells of the root apex (48). This possibility is supported by the slower velocity of propagation of the signals traveling transversally in the root (Fig. 6). Thus, it is well known that there are many more plasmodesmata crossing transverse walls than longitudinal walls in all of the region of the root apex of maize (49). Furthermore, electrical coupling via plasmodesmata has been demonstrated in many species (50, 51) and can reasonably supposed to be a ubiquitous characteristic in the plant world.
To our knowledge, the only published article reporting electrical events spontaneously generated in roots was published by Hejnowicz et al. (52). In their article, a basipetal propagation of the signals for short distances (1.3 mm) and with a conduction velocity of 3–9 mm·s−1 was reported. Consistently, in the present article spontaneous spikes appeared to be transmitted over a limited distance (Fig. 5) with decreasing velocity (Fig. 6). This behavior resembles strictly the one of spikes transmitted via neuroid conduction in lower animals (53, 54). The neuroid conduction, defined as the propagation of electrical events in the membranes of non-nerve and non-muscle cells (68), has been demonstrated in many invertebrates (es. hydrozoans and tunicate) and in the young stages of amphibians and lungfish (55). Even in carnivorous or sensitive plants such as Dionea and Mimosa the spreading of the electrical signal has been described as neuroid conduction (56). Based on the results of the present study, we propose that such kind of electrical transmission is a general characteristic of the root apex of plants. In fact, the characteristics of the spikes recorded fulfill all of the requirement normally associated with neuroid conduction: (i) they propagate in an all-or-none basis (ii) in non-nerve tissues (iii) going from cell to cell and, finally, (iv) decline rapidly in amplitude and velocity because of the flow of the current in all directions (compared with the 1-directional conduction of nerves).
Spatiotemporal Dynamics of the Electrical Activity.
The generation of spikes showed a well definite model of action with the production of many events developing spontaneously in many electrodes at the same time, forming periods of synchronized activity, followed by periods of inactivity that can last several seconds (Fig. 3). This behavior is well known in cortical structures of animals where is believed to be involved in information transmission and storage (for a detailed discussion, see for example refs. 21 and 57). We are unaware of other reports of synchronization of spikes in plants. Of course, it is untimely and beyond the aim of the present work, to propose a role for synchronization in plant. However, it is tempting to speculate about the possibility that a synchronized electrical activity in roots may sometimes serve purposes such as coordination in cellular activity. In fact, membranes have often been postulated to be a central component of cellular oscillators (58), and oscillations in membrane transport have been demonstrated to be ubiquitous in the plant kingdom (59, 60). Interestingly, oscillations in membrane activity are almost exclusively detected in the root apex, which is also the region of the greatest electrical activity and synchronization (Fig. 7), and only rarely in the basal root zones (61–63).
The stimulation with glutamate greatly enhanced the degree of synchronization, as detected by applying spike coincidence analysis (Fig. 4) and was almost completely inhibited by application of DNQX. The overall performance, showing a strong analogy with animals, supports the existence in plants of genuine glutamate receptors. Twenty genes in the arabidopsis genome have been identified that encode subunits of glutamate-like receptors (GLRs) (64). Interestingly, they are mostly expressed in roots (65). In the complex and not yet fully understood mechanisms of Ca2+ signaling, L-glutamate receptors are possible candidates for an influx pathway (66). Many studies have been conducted in plant cells that support that idea (65, 66, 67). In arabidopsis, L-glutamate triggers large and fast changes in cytosolic Ca2+ (41, 68). The rise in Ca2+ triggered by L-glutamate is accompanied by a large, transient membrane depolarization that is due at least in part to Ca2+ influx across the plasma membrane (41, 69).
Our finding that cells in the transition zone show synchronized oscillations agrees with other data suggesting that this region of the growing root apex is some kind of sensory zone specialized for integration of diverse sensory input information that enable the growing apex to continuously monitor diverse environmental parameters and to mount appropriate adaptive output responses (70). Importantly in this respect, root apex cells corresponding to the transition zone (84) were reported to be very effective in driving calcium waves induced by mechanical stimuli (71). Growing roots are continuously monitoring and integrating a vast amount of information about their abiotic and biotic environment (72, 73) and are very sensitive to many factors, including hormones (74), aluminum stress (75), salinity (76), anoxia (77), water availability (78) and, of course, gravity. The fact that the electrical activity is mostly observed in the transition zone of the root apex, points to a possible physiological role of synchronized electrical activity in this region. A fine-tuning of the physiological and metabolic process in this very dynamic region could be controlled by such synchronized electrical activity.
Materials and Methods
The experimental methods are detail in SI Materials and Methods. Briefly, longitudinal and transversal slices from the primary root tip of maize seedlings were cut at 350-μm thickness and were stored submerged for 2 h in CaCl2 5 mM (pH 6.5) at room temperature (22 °C) before recording. For recording, samples were gently transferred on multielectrode array (Fig. 1 A and B) with interelectrode distance of 500 μm or 200 μm and electrode diameter of 30 μm (Multichannelsystems). The electrodes were coated with porous titanium nitride to minimize the impedance and to allows recording of spikes at a high signal-to-noise ratio. The array covered ≈80% of the meristematic and transition zone of the root apex (see Fig. 1D). Data were acquired at a sampling rate of 20 KHz and processed by using routines written in MATLAB.
Supplementary Material
Acknowledgments.
This work was supported by the Ente Cassa di Risparmio di Firenze (S. Mancuso) and a Marie Curie Intra-European Fellowship within the 6th European Community Framework Program (to M.C.).
Footnotes
The authors declare no conflict of interest.
This article is a PNAS Direct Submission.
This article contains supporting information online at www.pnas.org/cgi/content/full/0804640106/DCSupplemental.
References
- 1.Greenspan RJ. An Introduction to Nervous Systems. Cold Spring Harbor, NY: Cold Spring Harbor Laboratory; 2007. [Google Scholar]
- 2.Leys SP, Mackie GO. Electric recording from a glass sponge. Nature. 1997;387:29–30. [Google Scholar]
- 3.Josephson RK, Schwab WE. Electric properties of an excitable epithelium. J Gen Physiol. 1979;74:213–236. doi: 10.1085/jgp.74.2.213. [DOI] [PMC free article] [PubMed] [Google Scholar]
- 4.Miljkovic-Licina M, Gauchat D., Galliot B. Neuronal evolution: Analysis of regulatory genes in a first-evolved nervous system, the hydra nervous system. BioSystems. 2004;76:75–87. doi: 10.1016/j.biosystems.2004.05.030. [DOI] [PubMed] [Google Scholar]
- 5.Fromm J., Lautner S. Electrical signals and their physiological significance in plants. Plant Cell Environm. 2007;30:249–257. doi: 10.1111/j.1365-3040.2006.01614.x. [DOI] [PubMed] [Google Scholar]
- 6.Davies E. New functions for electrical signals in plants. New Phytol. 2004;161:607–610. doi: 10.1111/j.1469-8137.2003.01018.x. [DOI] [PubMed] [Google Scholar]
- 7.Felle H, Zimmermann MR. Systemic signalling in barley through action potentials. Planta. 2007;226:203–214. doi: 10.1007/s00425-006-0458-y. [DOI] [PubMed] [Google Scholar]
- 8.Beilby M. Action potential in charophytes. Int Rev Cytol. 2007;257:43–82. doi: 10.1016/S0074-7696(07)57002-6. [DOI] [PubMed] [Google Scholar]
- 9.Favre N, et al. Action potentials elicited in the liverwort Conocephalum conicum (Hepaticae) with different stimuli. Arch Sci. 1999;52:175–185. [Google Scholar]
- 10.Pickard BG. Action potential in higher plants. J Bot Rev. 1973;39:172–201. [Google Scholar]
- 11.Wildon DC, et al. Electrical signalling and systemic proteinase inhibitor induction in the wounded plant. Nature. 1992;360:62–65. [Google Scholar]
- 12.Mancuso S. Hydraulic and electrical transmission of wound-induced signals in Vitis vinifera. Aust J Plant Physiol. 1999;26:55–61. [Google Scholar]
- 13.Bertholon ML. De l'Electricité des Végétaux: Ouvrage dans lequel on traite de l'electricite de l'atmosphere sur les plantes, de ses effets sur l'economie des vegetaux, de leurs vertus medicaux. Paris: P.F. Didotjeune; 1783. [Google Scholar]
- 14.Burdon-Sanderson J. Note on the electrical phenomena which accompany stimulation of a leaf of Dionaea muscipula. Proc R Soc London. 1873;21:495–496. [Google Scholar]
- 15.Darwin C. Insectivorous Plants. London: Murray; 1875. [Google Scholar]
- 16.Darwin C. Power of Movements in Plants. London: Murray; 1880. assisted by Darwin F. [Google Scholar]
- 17.Blinks LR. The direct current resistance of Nitella. J Gen Physiol. 1930;13:495–508. doi: 10.1085/jgp.13.4.495. [DOI] [PMC free article] [PubMed] [Google Scholar]
- 18.Volkov AG. Plant Electrophysiology: Theory and Methods. Berlin: Volkov, Springer; 2006. [Google Scholar]
- 19.Kerr JND, Denk W. Imaging in vivo: Watching the brain in action. Nat Rev Neurosci. 2008;9:195–203. doi: 10.1038/nrn2338. [DOI] [PubMed] [Google Scholar]
- 20.Hampson RE, Simeral JD, Deadwyler SA. Distribution of spatial and nonspatial information in dorsal hippocampus. Nature. 1999;402:610–614. doi: 10.1038/45154. [DOI] [PubMed] [Google Scholar]
- 21.Madhavan R, Chao ZC, Potter SM. Plasticity of recurring spatiotemporal activity patterns in cortical networks. Phys Biol. 2007;4:181–193. doi: 10.1088/1478-3975/4/3/005. [DOI] [PMC free article] [PubMed] [Google Scholar]
- 22.Torborg CL, Hansen HA, Feller MB. High frequency, synchronized bursting drives eye-specific segregation of retinogeniculate projections. Nat Neurosci. 2004;8:72–78. doi: 10.1038/nn1376. [DOI] [PMC free article] [PubMed] [Google Scholar]
- 23.Friedman PA. Novel mapping techniques for cardiac electrophysiology. Heart. 2002;87:575–582. doi: 10.1136/heart.87.6.575. [DOI] [PMC free article] [PubMed] [Google Scholar]
- 24.Thomas CA, Springer PA, Loeb GE, Berwald-Netter Y, Okun LM. A miniature microelectrode array to monitor the bioelectric activity of cultured cells. Exp Cell Res. 1972;74:6–66. doi: 10.1016/0014-4827(72)90481-8. [DOI] [PubMed] [Google Scholar]
- 25.Stett A, et al. Biological application of microelectrode arrays in drug discovery and basic research. Anal Bioanal Chem. 2003;377:486–495. doi: 10.1007/s00216-003-2149-x. [DOI] [PubMed] [Google Scholar]
- 26.Segev R, Shapira Y, Benveniste M, Ben-Jacob E. Observation and modeling of synchronized bursting in two-dimensional neuronal networks. Phys Rev E. 2001;64 doi: 10.1103/PhysRevE.64.011920. 011920. [DOI] [PubMed] [Google Scholar]
- 27.Gramowski A, Jugelt K, Weiss DG, Gross GW. Substance identification by quantitative characterization of oscillatory activity in marine spinal cord networks on microelectrode arrays. Eur J Neurosci. 2004;19:2815–2825. doi: 10.1111/j.0953-816X.2004.03373.x. [DOI] [PubMed] [Google Scholar]
- 28.Gross GW, Harsch A, Rhoades BK, Gopel W. Odor, drug and toxin analysis with neuronal networks in vitro: Extracellular array recording of network responses. Bios Bioelec. 1997;12:373–393. doi: 10.1016/s0956-5663(97)00012-2. [DOI] [PubMed] [Google Scholar]
- 29.Jimbo Y, Kasai N, Torimitsu K, Tateno T. Frontiers in Biochip Technology. New York: Springer; 2006. pp. 88–98. [Google Scholar]
- 30.Rousche PJ, Petersen RS, Battiston S, Giannotta S, Diamond ME. Examination of the spatial and temporal distribution of sensory cortical activity using a 100-electrode array. J Neurosci Meth. 1999;90:57–66. doi: 10.1016/s0165-0270(99)00061-8. [DOI] [PubMed] [Google Scholar]
- 31.Henze DA, et al. Intracellular features predicted by extracellular recordings in the hippocampus in vivo. J Neurophysiol. 2000;84:390–400. doi: 10.1152/jn.2000.84.1.390. [DOI] [PubMed] [Google Scholar]
- 32.Egert U, Heck D, Aertsen A. 2-Dimensional monitoring of spiking networks in acute brain slices. Exp Brain Res. 2002;14:2268–2274. doi: 10.1007/s00221-001-0932-5. [DOI] [PubMed] [Google Scholar]
- 33.Halbach MD, Egert U, Hescheler J, Banach K. Estimation of action potential changes from field potential recordings in multi-cellular mouse cardiac myocyte cultures. Cell Physiol Biochem. 2003;13:271–284. doi: 10.1159/000074542. [DOI] [PubMed] [Google Scholar]
- 34.Baluška F, Kubica S, Hauskrecht M. Postmitotic “isodiametric” cell growth in the maize root apex. Planta. 1990;181:269–274. doi: 10.1007/BF00195876. [DOI] [PubMed] [Google Scholar]
- 35.Lin Y, Chen C, Chen L, Zeng S, Luo Q. The analysis of electrode-recording horizon. Conf Proc IEEE Eng Med Biol Soc. 2005;7:7345–7348. doi: 10.1109/IEMBS.2005.1616208. [DOI] [PubMed] [Google Scholar]
- 36.Grün S, Diesmann M, Grammont F, Riehle A, Aertsen A. Detecting unitary events without discretization of time. J Neurosci Meth. 1999;93:67–79. doi: 10.1016/s0165-0270(99)00126-0. [DOI] [PubMed] [Google Scholar]
- 37.Roy SA, Alloway KD. Coincidence detection or temporal integration? What the neurons in somatosensory cortex are doing. J Neurosci. 2001;21:2462–2473. doi: 10.1523/JNEUROSCI.21-07-02462.2001. [DOI] [PMC free article] [PubMed] [Google Scholar]
- 38.Dubos C, Huggins D, Grant GH, Knight MR, Campbell MM. A role for glycine in the gating of plant NMDA-like receptors. Plant J. 2003;35:800–810. doi: 10.1046/j.1365-313x.2003.01849.x. [DOI] [PubMed] [Google Scholar]
- 39.Walch-Liu P, Liu LH, Remans T, Tester M, Forde BG. Evidence that lglutamate can act as an exogenous signal to modulate root growth and branching in Arabidopsis thaliana. Plant Cell Physiol. 2006;47:1045–1057. doi: 10.1093/pcp/pcj075. [DOI] [PubMed] [Google Scholar]
- 40.Forde BG, Lea PJ. Glutamate in plants: Metabolism, regulation, and signalling. J Exp Bot. 2007;58:2339–2358. doi: 10.1093/jxb/erm121. [DOI] [PubMed] [Google Scholar]
- 41.Dennison KL, Spalding EP. Glutamate-gated calcium fluxes in Arabidopsis. Plant Physiol. 2000;124:1511–1514. doi: 10.1104/pp.124.4.1511. [DOI] [PMC free article] [PubMed] [Google Scholar]
- 42.Qi Z, Stephens NR, Spalding EP. Calcium entry mediated by GLR3.3, an Arabidopsis glutamate receptor with a broad agonist profile. Plant Physiol. 2006;142:963–971. doi: 10.1104/pp.106.088989. [DOI] [PMC free article] [PubMed] [Google Scholar]
- 43.Li LB, et al. Regulation of astrocytic glutamate transporter expression by Akt: Evidence for a selective transcriptional effect on the GLT-1/EAAT2 subtype. J Neurochem. 2006;97:759–771. doi: 10.1111/j.1471-4159.2006.03743.x. [DOI] [PubMed] [Google Scholar]
- 44.Mackie GO, Passano LM. Epithelial conduction in hydromedusae. J Gen Physiol. 1968;52:600–621. doi: 10.1085/jgp.52.4.600. [DOI] [PMC free article] [PubMed] [Google Scholar]
- 45.Pickens PE. Conduction along the ventral nerve cord of a hemichordate worm. J Exp Biol. 1970;53:515–528. [Google Scholar]
- 46.Stankovic B, Davies E. Both action potentials and variation potentials induce proteinase inhibitor gene expression in tomato. FEBS Lett. 1996;390:275–279. doi: 10.1016/0014-5793(96)00672-2. [DOI] [PubMed] [Google Scholar]
- 47.Stahlbergh R, Clealand RE, Van Volkenburgh E. In: Communication in Plants: Neuronal Aspects of Plant Life. Baluska F, Mancuso S, editors. Berlin: Springer; 2006. pp. 291–308. [Google Scholar]
- 48.Overall RL, Gunning BES. Intercellular communication in Azolla roots: II. Electrical coupling. Protoplasma. 1982;111:151–160. [Google Scholar]
- 49.Juniper BE, Barlow PW. The distribution of plasmodesmata in the root tip of maize. Planta. 1969;89:352–360. doi: 10.1007/BF00387235. [DOI] [PubMed] [Google Scholar]
- 50.Spanswick RM. Evidence for an electrogenic ion pump in Nitella translucens. I. The effects of pH, K+, Na+, light and temperature on the membrane potential and resistance. Biochim Biophys Acta. 1972;288:73–89. doi: 10.1016/0005-2736(72)90224-6. [DOI] [PubMed] [Google Scholar]
- 51.Zawadzki T, Dziubiśka H, Davies E. Characteristics of action potentials generated spontaneously in Helianthus annuus. Physiol Plant. 1995;93:291–297. [Google Scholar]
- 52.Hejnowicz Z, Krause E, Glebicki K, Sievers A. Propagated fluctuations of the electric potential in the apoplasm of Lepidium sativum L. roots. Planta. 1991;186(1):127–134. doi: 10.1007/BF00201508. [DOI] [PubMed] [Google Scholar]
- 53.Mackie GO. Epithelial conduction: Recent findings, old questions, and where do we go from here? Hydrobiologia. 2004;530:73–80. [Google Scholar]
- 54.Parker GH. The Elementary Nervous System. Philadelphia: Lippincott; 1919. p. 229. [Google Scholar]
- 55.Bone Q. Gelatinous animals and physiology. J Mar Biol Ass UK. 2005;85:641–653. [Google Scholar]
- 56.Mackie GO. Neuroid conduction and the evolution of conducting tissues. Q Rev Biol. 1970;45:319–332. doi: 10.1086/406645. [DOI] [PubMed] [Google Scholar]
- 57.Engel AK, Fries P, Singer W. Dynamic predictions: Oscillations and synchrony in top-down processing. Nat Rev Neurosci. 2001;2:704–716. doi: 10.1038/35094565. [DOI] [PubMed] [Google Scholar]
- 58.Gradmann D, Buschmann P. Oscillatory interactions between voltage gated electroenzymes. J Exp Bot. 1997;48:399–404. doi: 10.1093/jxb/48.Special_Issue.399. [DOI] [PubMed] [Google Scholar]
- 59.Shabala S, et al. Oscillations in plant membrane transport: Model predictions, experimental validation, and physiological implications. J Exp Bot. 2006;57:171–184. doi: 10.1093/jxb/erj022. [DOI] [PubMed] [Google Scholar]
- 60.Mancuso S, Shabala S. Rhythms in plants—Phenomenology, Mechanisms and Adaptive Significance. Berlin: Springer; 2007. [Google Scholar]
- 61.Shabala S, Newman IA, Morris J. Oscillations in H and Ca2+ ion fluxes around the elongation region of corn roots and effects of external pH. Plant Physiol. 1997;113:111–118. doi: 10.1104/pp.113.1.111. [DOI] [PMC free article] [PubMed] [Google Scholar]
- 62.Mancuso S, Papeschi G, Marras AM. A polarographic, oxygen-selective, vibrating-microelectrode system for the spatial and temporal characterisation of transmembrane oxygen fluxes in plants. Planta. 2000;211:384–389. doi: 10.1007/s004250000296. [DOI] [PubMed] [Google Scholar]
- 63.Shabala S. Physiological implications of ultradian oscillations in plant roots. Plant Soil. 2003;255:217–226. [Google Scholar]
- 64.Lam H-M, et al. Glutamate receptor genes in plants. Nature. 1998;396:125–126. doi: 10.1038/24066. [DOI] [PubMed] [Google Scholar]
- 65.Chiu JC, et al. Phylogenetic and expression analysis of the glutamate receptor-like gene family in Arabidopsis thaliana. Mol Biol Evol. 2002;19:1066–1082. doi: 10.1093/oxfordjournals.molbev.a004165. [DOI] [PubMed] [Google Scholar]
- 66.Lacombe B, et al. The identity of plant glutamate receptors. Science. 2001;292:1486–1487. doi: 10.1126/science.292.5521.1486b. [DOI] [PubMed] [Google Scholar]
- 67.Davenport R. Glutamate receptors in plants. Ann Bot. 2002;90:549–557. doi: 10.1093/aob/mcf228. [DOI] [PMC free article] [PubMed] [Google Scholar]
- 68.Meyerhoff O, D , et al. AtGLR3.4, a glutamate receptor channellike gene is sensitive to touch and cold. Planta. 2005;222:418–427. doi: 10.1007/s00425-005-1551-3. [DOI] [PubMed] [Google Scholar]
- 69.Demidchik V, Essah P, Tester M. Glutamate activates cation currents in the plasma membrane of Arabidopsis root cells. Planta. 2004;219:167–175. doi: 10.1007/s00425-004-1207-8. [DOI] [PubMed] [Google Scholar]
- 70.Baluška F, Volkmann D, Barlow PW. Specialized zones of development in roots: View from the cellular level. Plant Physiol. 1996;112:3–4. doi: 10.1104/pp.112.1.3. [DOI] [PMC free article] [PubMed] [Google Scholar]
- 71.Fasano JM, Massa GD, Gilroy S. Ionic signaling in plant responses to gravity and touch. J Plant Growth Regul. 2002;21:71–88. doi: 10.1007/s003440010049. [DOI] [PubMed] [Google Scholar]
- 72.Bais HP, Park SW, Weir TL, Callaway RM, Vivanco JM. How plants communicate using the underground information superhighway. Trends Plants Sci. 2004;9:26–32. doi: 10.1016/j.tplants.2003.11.008. [DOI] [PubMed] [Google Scholar]
- 73.Baluška F, Mancuso S, Volkmann D. Communication in Plants: Neuronal Aspects of Plant Life. Berlin: Springer; 2006. [Google Scholar]
- 74.Ludidi N, et al. A recombinant plant natriuretic peptide causes rapid and spatially differentiated K+, Na+ and H+ flux changes in Arabidopsis thaliana roots. Plant Cell Physiol. 2004;45:1093–1098. doi: 10.1093/pcp/pch113. [DOI] [PubMed] [Google Scholar]
- 75.Ryan PR, DiTomaso JM, Kochian LV. Aluminium toxicity in roots: An investigation of spatial sensitivity and the role of the root cap. J Exp Bot. 1993;44:437–446. [Google Scholar]
- 76.Chen Z, et al. Screening plants for salt tolerance by measuring K+ flux: A case study for barley. Plant Cell Environ. 2005;28:1230–1246. [Google Scholar]
- 77.Mancuso S, Marras AM. Adaptative response of Vitis root to anoxia. Plant Cell Physiol. 2006;47:401–409. doi: 10.1093/pcp/pcj007. [DOI] [PubMed] [Google Scholar]
- 78.Eapen D, Barroso ML, Ponce G, Campos ME, Cassab GI. Hydrotropism: Root growth responses to water. Trends Plants Sci. 2005;10:44–50. doi: 10.1016/j.tplants.2004.11.004. [DOI] [PubMed] [Google Scholar]
Associated Data
This section collects any data citations, data availability statements, or supplementary materials included in this article.


