

Abstract
Recent evidence suggests that the transcriptional coactivator peroxisome proliferator activated receptor γ coactivator 1α (PGC-1α) is involved in the pathology of Huntington’s Disease (HD). While animals lacking PGC-1α express lower levels of genes involved in antioxidant defense and oxidative phosphorylation in the brain, little is known about other targets for PGC-1α in neuronal cells and whether there are ways to pharmacologically target PGC-1α in neurons. Here, PGC-1α overexpression in SH-SY5Y neuroblastoma cells upregulated expression of genes involved in mitochondrial function, glucose transport, fatty acid metabolism, and synaptic function. Overexpression also decreased vulnerability to hydrogen peroxide-induced cell death and caspase 3 activation. Treatment of cells with the histone deacetylase inhibitors (HDACi’s) trichostatin A and valproic acid upregulated PGC-1α and glucose transporter 4 (GLUT4). These results suggest that PGC-1α regulates multiple pathways in neurons and that HDACi’s may be good candidates to target PGC-1α and GLUT4 in HD and other neurological disorders.
Keywords: Metabolism, neuron, mitochondria, antioxidant defense, glucose transport, mitochondrial fusion, apoptosis, neuroblastoma
INTRODUCTION
There is abundant evidence of disruptions in neuronal metabolism and mitochondrial respiration in Huntington’s Disease (HD; [1]). Recent reports have revealed that the metabolic transcriptional regulator peroxisome proliferator activated receptor γ coactivator 1α (PGC-1α) and multiple PGC-1α-target genes are downregulated in the striatum of patients with HD and in mouse models of HD [2; 3]). It has been proposed that mutant huntingtin represses the expression of PGC-1α by binding to its promoter; overexpression of the transcription factors CREB and TAF4 are able to reverse mutant huntingtin-mediated PGC-1α downregulation [2]. Accordingly, PGC-1α has been suggested as a potential therapeutic target in HD [4].
The analysis of gene expression and neuroanatomy in PGC-1α knockout mice has revealed critical information about the function of PGC-1α in the brain. Adult mice lacking PGC-1α exhibit behavioral abnormalities, progressive vacuolization in various brain regions, sensitivity to oxidative stress-induced neuronal death, and decreased expression of genes involved in antioxidant defense and oxidative phosphorylation [5; 6; 7]. However, studies from our own lab led us to question whether PGC-1α regulates additional pathways in neurons. PGC-1α can bind and coactivate numerous transcription factors expressed by neurons (including CREB, MEF-2, estrogen receptor, thyroid receptor, and retinoid receptors), and PGC-1α can regulate the expression of genes involved in glucose transport and fatty acid metabolism in non-neuronal tissues, such as glucose transporter 4 (GLUT4) and carnitine palmitoyl transferase (CPT-1α), respectively [8; 9].
With the observation of decreased PGC-1α expression in HD, it is important to identify approaches to modulate PGC-1α function, with the goal of improving neurological function. Interestingly, PGC-1α can be regulated by the activity of histone deacetylases (HDACs) in muscle [10], raising the possibility that HDAC inhibitors currently used for the treatment of neurological and mental disorders may regulate the expression of PGC-1α and PGC-1α target genes in the brain. HDAC inhibitors have been proposed to be a good potential therapeutic agent in the treatment of polyglutamine disorders, including HD [11], and HDAC inhibitors have been successful in improving symptoms and cell survival in drosophila and mouse models of HD [12; 13; 14; 15; 16].
In this study, we sought to identify gene targets for PGC-1α by overexpressing PGC-1α in SH-SY5Y neuroblastoma cells, and we investigated the influence of the HDAC inhibitors valproic acid (VPA) and trichostatin A (TSA) on PGC-1α and PGC-1α-responsive gene expression.
METHODS
Cell culture
SH-SY5Y neuroblastoma cells were cultured in DMEM with high glucose and Glutamax (Invitrogen, Carlsbad, CA), and passages 18–30 were used for experiments. For experiments, cells were allowed to reach 40–70% confluency and were treated with either valproic acid (VPA; 1–20 mM) or trichostatin A (TSA; 100–800 μM) for 16–18 hours.
Adenoviral transfection
PGC-1α adenovirus was provided by Bruce M. Spiegelman (Dana Farber Cancer Research Center, Harvard University, [17; 18]) and was purified and amplified at the University of Michigan Cancer Center Vector Core (director, Thomas Lanigan; [19]). The PGC-1α adenovirus contained the gene for green fluorescent protein (GFP) in tandem with the PGC-1α gene. The optimal multiplicity of infection (MOI) was determined to be 10:1 to 20:1, based on expression analysis and evidence of cell death at higher concentrations.
Quantitative RT-PCR
RNA was isolated and reverse transcribed using published procedures [19]. Taqman PCR was performed with mastermix (Applied Biosystems) and primer/probe sets as follows: PGC-1α (Hs00173304_m1), glucose transporter 4 (GLUT4; Hs00168966_m1), mitochondrial transcription factor A (TFAM; Hs00273372_s1), cytochrome c oxidase, subunit IV (COXIV; Hs00266371_m1), nuclear respiratory factor 1 (NRF-1; Hs00192316_m1), manganese superoxide dismutase (MnSOD; Hs00167309_m1), carnitine palmitoyl transferase 1α (CPT-1α; Hs00157079_m1), mitofusin 1 (Mfn1; Hs00250475_m1), mitofusin 2 (Mfn2; Hs00208382_m1), cyclin D1 (Hs00277039), cyclin-dependent kinase 4 (cdk4; Hs00364847_m1), tyrosine hydroxylase (Hs00165941_m1), acetylcholinesterase (AChE; Hs00241307_m1), synaptophysin (Hs00300531_m1), and reelin (Hs00192449_m1). Reactions were performed using the Stratagene MX3000P with an initial ramp time of 2 minutes at 50°C and 10 minutes at 95°C, and 40 subsequent cycles of 15 seconds at 95°C and 1 minute at 60°C. As a negative control for the RT reaction, reverse transcriptase was omitted in the reaction mix. For negative controls for the PCR reaction, either the primer sets or the cDNA were omitted from the reactions. Relative concentrations of cDNA were calculated with comparison to a standard curve made with dilutions (1:5, 1:10, 1:20) of cDNA from the sample with the highest dose (or longest exposure) in that particular experiment (calibrator method). Values were normalized to 18s rRNA content and expressed as fold control, +/− standard error.
Western Blot Analysis
Cells were treated with adenovirus for indicated times, rinsed in cold PBS, and collected in 200 μl RIPA buffer for Western blot analysis, as previously described [19]. Protein content was determined using bovine serum albumin as a standard (Pierce Biotechnology Incorporated, Rockford, IL). Primary antibodies included rabbit anti-PGC-1α [19; 20], mouse anti-β actin (Millipore, MAB1501R), rabbit anti-GLUT4 (AbCam, ab654); sheep anti-manganese superoxide dismutase (MnSOD; Calbiochem, 574596), mouse anti-GFP (Millipore, MAB2510), mouse anti-synaptophysin and rabbit anti-synapsin (Sigma, S5768, S193), and rabbit anti-cleaved caspase 3 (Cell Signaling, 9661). Horseradish peroxidase-conjugated secondary antibodies were purchased from Jackson Immunoresearch (West Grove, PA).
Immunocytochemistry
Cells (105) were plated on poly-D-lysine-coated coverslips in 24-well plates and treated with adenovirus. After 48 hours, cells were fixed in warmed paraformaldehyde (4% in PBS, pH 7.4) and washed with PBS before storing at 4°C overnight. Cells were blocked in PBS with 10% donkey serum (Jackson Immunoresearch) for one hour and then treated with 10 mM citrate buffer for 30 minutes at 37°C before incubation overnight with rabbit anti-mouse PGC-1α (1:10,000) and one hour at room temperature with Alexa fluor 568 donkey anti-rabbit IgG (1:2000; Molecular Probes, Eugene, OR). Coverslips were mounted onto slides with antifade mounting media (Molecular Probes). To rule out non-specific binding of the secondary antibody and autofluorescence, primary antibodies were replaced with species-matched non-specific IgG (Vector Labs, Burlingame, MA).
MTT Cell Viability Assay
Toxicity of hydrogen peroxide (H2O2) was evaluated with the MTT assay. Cells were plated in 96-well plates (104 per well), allowed to reach 60–70% confluency, and transfected with PGC-1α for 2 days (see below). Cells were then exposed to H2O2 for 24 hours. 3-(4,5-Dimethylthiazol-2-yl)-2,5-diphenyltetrazolium bromide (MTT; 1 mg/ml in RPMI without phenol red; Sigma) was added to each well for a final concentration of 0.1 mg/ml. Cells were incubated with MTT for 3 hours and then dissolved with isopropanol. The resulting absorbance was read at 562 nm, with a reference wavelength of 630nm.
Statistical Analysis
Western blotting and quantitative RT-PCR data were expressed as mean +/− standard error. Significant differences among groups were determined using one-way analysis of variance (ANOVA). Post-hoc analyses to determine significant differences between individual conditions were performed using a 2-tailed T-test, assuming unequal variances. Statistical significance was set at p = 0.05.
RESULTS
To identify potential transcriptional targets for PGC-1α in neuroblastoma cells, we transfected SH-SY5Y cells with a virus containing the genes for either green fluorescent protein (GFP) or GFP and mouse PGC-1α (in tandem) and then measured mRNA and protein expression of metabolic and neuronal genes. Transfection was confirmed with immunocytochemistry (Figure 1A–D), RT-PCR (not shown), and Western blotting (Figure 1E). While there was little specific staining for PGC-1α in cells transfected with GFP alone (Fig. 1B), PGC-1α protein was concentrated in the nucleus of cells transfected with PGC-1α (Fig. 1D).
Figure 1. PGC-1α-induced upregulation of protein expression in neuroblastoma cells.

A–D. Neuroblastoma cells were transfected with an adenoviral construct for PGC-1α and GFP (see Methods) for 48 hours, and cells were fixed for immunofluorescence using a PGC-1α-specific antibody. Cells transfected with GFP alone (A–B) showed little specific staining for PGC-1α (B); cells transfected with PGC-1α (C–D) exhibited strong immunoreactivity for PGC-1α in the nucleus. E. Control cells (C) and GFP-transfected cells (G) expressed little PGC-1α, while cells transfected with PGC-1α (P; MOI of 10:1 or 20:1), showed high levels of PGC-1α, GLUT4, MnSOD, and synaptophysin expression. No change was seen in the synaptic protein synapsin.
Cells were exposed to adenovirus for 48 hours or 96 hours and collected for RT-PCR and Western blotting, respectively. Based on previous reports of PGC-1α-induced gene expression in non-neuronal tissues, we chose sets of genes involved in oxidative phosphorylation, mitochondrial homeostasis, and proliferation/differentiation. Also, in light of the data showing localization of PGC-1α to neurons in development, we measured the expression of two genes involved in synaptic plasticity, synaptophysin and reelin. PGC-1α overexpression resulted in a significant increase in the mRNA expression (Table 1) of glucose transporter 4 (GLUT4), mitochondrial transcription factor A (TFAM), cytochrome c oxidase, subunit IV (COXIV), Manganese superoxide dismutase (MnSOD), carnitine palmitoyl transferase 1α (CPT-1α), mitofusin 2 (Mfn2), and synaptophysin. Interestingly, PGC-1α overexpression had no effect on proliferation-related genes (cyclin D1 and cyclin dependent kinase 4) or differentiation-related genes (acetylcholinesterase and tyrosine hydroxylase). Furthermore, the only gene downregulated by PGC-1α was reelin. PGC-1α overexpression also had no effect of the mRNA levels of CuZnSOD, catalase, thioredoxin, glutathione peroxidase, NADHdh, or uncoupling protein 2 (not shown). PGC-1α-induced upregulation of GLUT4, MnSOD, and synaptophysin was confirmed by Western blot (Figure 1E); there were no changes in the expression of the synaptic protein synapsin.
Table 1.
Gene expression in SH-SY5Y cells transfected with PGC-1α or treated with the histone deacetylase inhibitors valproic acid (VPA) or trichostatin A (TSA).
| Gene(mRNA) | PGC-1 AdV | VPA (10mM) | TSA (400nM) | |
|---|---|---|---|---|
| PGC-1α | 6.6 +/− 1 * | 4.2 +/− 0.4 ** | ||
| PGC-1α-Related Genes | GLUT4 | 8.4 +/− 0.8 ** | 4.4 +/− 0.7 ** | 3.5 +/− 0.6 ** |
| TFAM | 2.2 +/− 0.4 * | 1.4 +/− 0.2 | 1.8 +/− 0.5 | |
| COXIV | 2.6 +/− 0.5 * | 1.0 +/− 0.2 | 0.7 +/− 0.2 | |
| NRF-1 | 1.1 +/− 0.1 | 0.7 +/− 0.1 | 0.6 +/− 0.2 | |
| MnSOD | 10.1 +/− 0.4 ** | 1.4 +/− 0.3 | 1.1 +/− 0.5 | |
| CPT-1α | 5.0 +/− 0.5 ** | 2.3 +/− 0.2 ** | 0.9 +/− 0.2 | |
| Mfn1 | 1.2 +/− 0.1 | 1.9 +/− 0.6 | 1.4 +/− 0.3 | |
| Mfn2 | 3.8 +/− 0.5 ** | 1.2 +/− 0.2 | 0.7 +/− 0.1 | |
| Proliferation/Differentiation | Cyclin D1 | 0.9 +/− 0.2 | 0.5 +/− 0.1 | 0.3 +/− 0.2 * |
| Cdk4 | 1.0 +/− 0.1 | 0.9 +/− 0.2 | 0.5 +/− 0.1 | |
| Tyrosine | ||||
| Hydroxylase | 0.8 +/− 0.1 | 2.9 +/− 0.5 * | 4.5 +/− 0.2 ** | |
| Acetylcholinesterase | 1.1 +/− 0.2 | 9.5 +/− 1 ** | 4.1 +/− 0.1 ** | |
| Synaptophysin | 2.6 +/− 0.3 ** | 3.4 +/− 0.4 * | 1.5 +/− 0.6 | |
| Reelin | 0.6 +/− 0.1* | 1.4 +/− 0.2 | 1.0 +/− 0.1 | |
Values are expressed as fold GFP control (for PGC-1α) or fold untreated control (VPA, TSA), +/− standard error. For PGC-1α, n=4 per group; for VPA/TSA, a representative set of samples was selected from the 4 experiments depicted in Figure 3C (n=3/group).
p < 0.05,
p < 0.01.
The highest level of gene expression was observed for the antioxidant enzyme MnSOD. In line with these results, St. Pierre et al. (2006)[6] demonstrated that PGC-1α can protect SH-SY5Ys from hydrogen peroxide-mediated cell death. Because of the importance of apoptotic cell death in neurodegenerative disorders, we investigated whether PGC-1α overexpression specifically affected vulnerability to hydrogen peroxide-induced apoptosis. PGC-1α overexpression increased cell viability with 24 hours exposure to H2O2, as measured by the MTT assay (Figure 2A). To determine whether PGC-1 α influenced caspase 3 activation, cells were exposed to hydrogen peroxide for 6 hours and then collected for Western blotting for activated caspase 3 (Figure 2B). The intensity of activated caspase 3 (17, 19 kD) increased with increasing dose of H2O2 in cells transfected with either GFP or GFP-PGC-1α (Figure 2A); however, caspase activation was less pronounced in cells overexpressing PGC-1α (Figure 2B), suggesting that PGC-1α is also able to protect cells from apoptotic cell death.
Figure 2. PGC-1α protects neuroblastoma cells from hydrogen peroxide-induced cell death.

A. Neuroblastoma cells were plated on 96-well plates and exposed to different doses of hydrogen peroxide (H2O2) for 24 hours, and cell viability was estimated using the MTT viability assay. Values are expressed as percent control (of same condition). Greater cell survival was observed in cells transfected with PGC-1α (n=3/group/dose; p < 0.05). B. Neuroblastoma cells were transfected with GFP or PGC-1α and then collected for Western blot to evaluate caspase 3 activation. H2O2-induced caspase 3 cleavage was attenuated in cells transfected with PGC-1α. (n=3/dose/group; *p < 0.05).
Based on reports in the literature indicating that inhibitors of histone deacetylases (HDACs) can influence PGC-1α expression in cardiac and skeletal muscle, we tested whether valproic acid or trichostatin A (TSA) could induce the expression of PGC-1α and potential targets of PGC-1α. The optimal concentrations of VPA and TSA were initially determined by cell viability and histone H3 acetylation (confirmed by Western blot); exposure of cells to 5–10 mM VPA and 400–800 nM TSA caused histone H3 acetylation (16 hours, 48 hours, not shown). Due to the fact that HDACi’s cause cell death and/or differentiation in cancer cells, we also evaluated HDACi-induced regulation of genes involved in proliferation and differentiation (Table 1). Cell death was noted after 48 hours exposure at higher doses of VPA and TSA (10–20 mM and 400–800 nM, respectively), so at all doses, we evaluated expression of PGC-1α and PGC-1α-responsive genes after 16 hours drug exposure, before cell death occurred (Table 1). Both VPA and TSA caused an increase in PGC-1α mRNA expression (Figure 3A, B). Data from four replicate experiments (Figure 3C) shows that VPA (10 mM) and TSA (400 nM) upregulated PGC-1α, GLUT4 (Figure 3C), and acetylcholinesterase, a marker of differentiation.
Figure 3. Histone deacetylase inhibitors stimulate PGC-1α and PGC-1α-responsive gene expression.
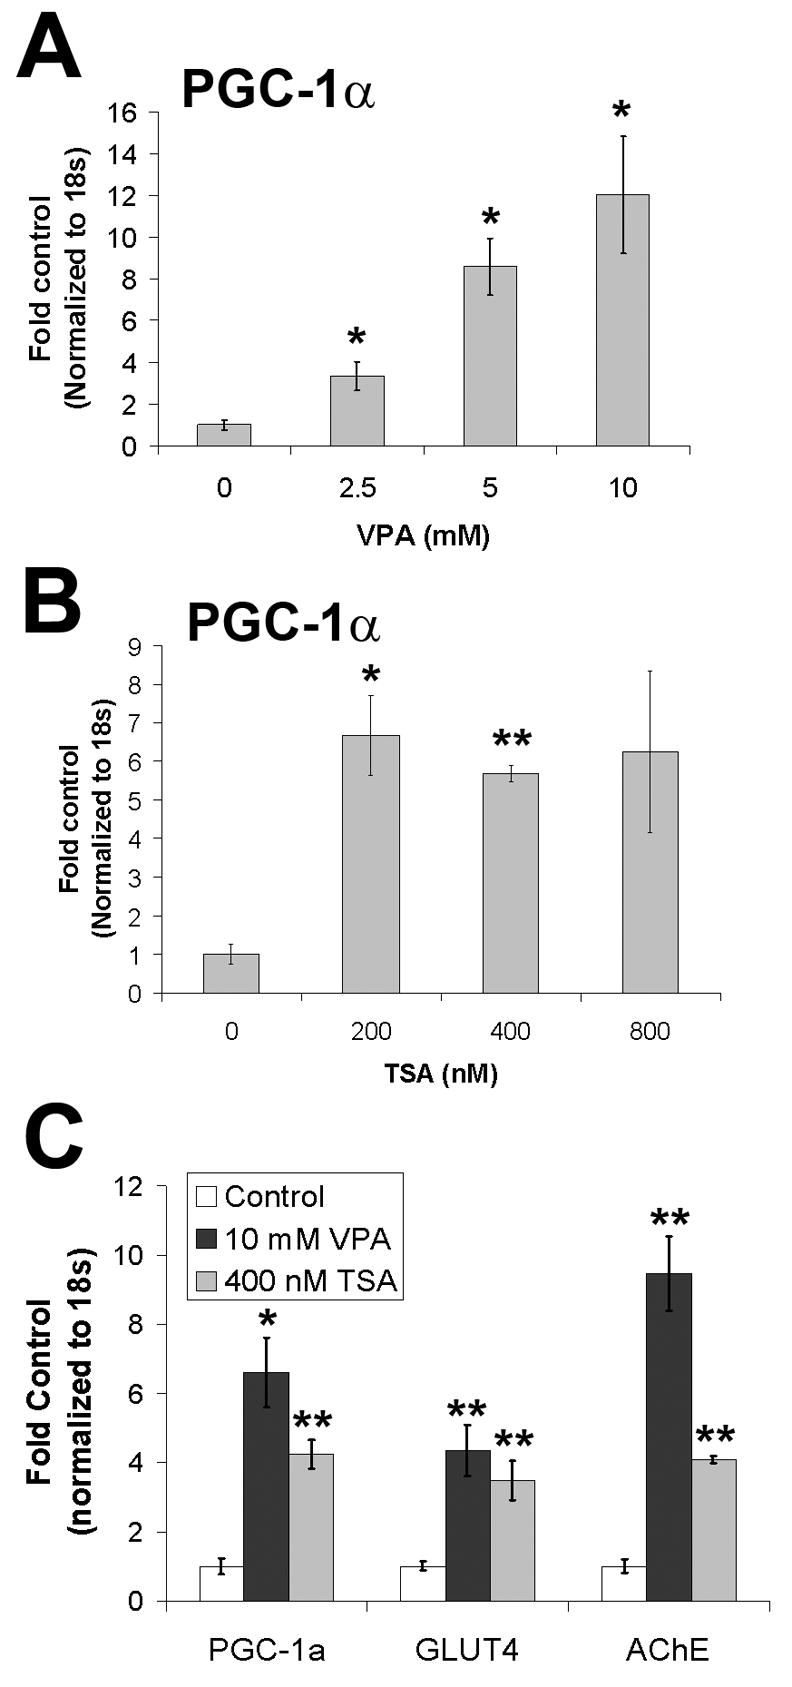
A. Valproic acid (16 hours treatment; sodium valproate, VPA) upregulated PGC-1α expression in a dose-dependent fashion (n=3/group; *p < 0.05). B.Trichostatin A (TSA) induced PGC-1α expression (n=3/group; *p < 0.05, **p < 0.01). No changes in PGC-1α expression were observed at lower doses of TSA (50, 100 nM; not shown). C. VPA and TSA induced expression of glucose transporter 4 (GLUT4) and a marker of differentiation (acetylcholinesterase; AChE) (N=4, n=3/group; *p < 0.05; **p < 0.01).
To compare gene expression profiles in PGC-1α overexpressing and VPA/TSA-treated cells, we then tested samples from one representative experiment for the same panel of genes measured in cells overexpressing PGC-1α (Table 1). While TSA downregulated the expression of the proliferation marker cyclin D1 and upregulated the expression of tyrosine hydroxylase, TSA did not influence the expression of any other PGC-1α-target genes besides GLUT4 (Figure 3C). However, similar to PGC-1α overexpression, VPA upregulated GLUT4, CPT-1α, and synaptophysin.
DISCUSSION
In this report, we demonstrate that PGC-1α overexpression in the SH-SY5Y neuroblastoma cell line increases the expression of genes involved in glucose transport, fatty acid oxidation, oxidative phosphorylation, and mitochondrial fusion. Furthermore, we show that PGC-1α overexpression increases the expression of the synaptic gene synaptophysin. We extended the results of St. Pierre et al. (2006)[6] to demonstrate that PGC-1α overexpression can attenuate H2O2-induced caspase 3 activation, suggesting that PGC-1α can protect cells from apoptosis. Of note, overexpression of proteins involved in mitochondrial fusion can protect cells from apoptosis [21], so it is possible that in addition to the antioxidant effects of PGC-1α (via upregulation of MnSOD), the increase in mitofusin expression contributes to the acute anti-apoptotic effect of PGC-1α.
While it is important to recognize that neuroblastoma cells behave differently than neurons in vivo, it is possible that the PGC-1α targets identified in this study are relevant for study of PGC-1α in the brain. St. Pierre et al. (2006)[6] observed a ~35% reduction in MnSOD in brain from PGC-1α null mice, and preliminary experiments have shown that GLUT4 may also be reduced in PGC-1α null animals (unpublished data, RMC). Previously, we localized PGC-1α to GABAergic neurons in the developing and mature rat brain [20]; it is possible that PGC-1α and HDAC inhibitors regulate targets genes specifically in GABAergic neurons. Cell-specific studies are required to resolve this issue.
Interestingly, GLUT4 expression was increased by the histone deacetylase inhibitors valproic acid and trichostatin A and by PGC-1α overexpression alone. Previous studies have demonstrated that histone deacetylases are involved in the repression of PGC-1α and GLUT4 expression in myocytes [10]; our data suggest that a similar regulatory pathway may be functional in neurons. Accordingly, we found that MEF2 and PGC-1α are present in the same neuronal populations in rat brain [20], and preliminary experiments have shown that valproic acid can increase PGC-1α and GLUT4 expression in mature primary hippocampal and cortical neurons (not shown, RMC). Supporting the idea that PGC-1α is regulated by HDACs in brain, Weaver et al. [22] identified PGC-1α as a target of TSA in brain by microarray. However, the set of PGC-1α-responsive genes activated will depend on the drug; the weak HDACi (VPA) had different effects on gene expression than the strong HDACi (TSA). Unlike TSA, VPA induced the expression of synaptophysin and CPT-1α, suggesting that VPA may have metabolic effects independent of its action as an HDACi [23].
In light of these data, it is attractive to speculate that the ameliorative effects of HDAC inhibitors in mouse models of HD involve regulation of PGC-1α and PGC-1α-responsive pathways. A boost in glucose transport, fatty acid oxidation, and mitochondrial fusion may be able to counteract some effects of mutant huntingtin on metabolism; however, if the critical transcriptional machinery is not in place to allow HDACi-induced induction of PGC-1α (mutant huntingtin could interfere with the induction of PGC-1α), HDACi treatment may not be able to rescue the affected neuronal populations. In this case, it would be more productive to target individual transcription factors or mutant huntingtin itself to boost neuronal metabolism.
Acknowledgments
This work was supported by F32 NS049863 from NINDS (RMC), K01 MH077955-01 (RMC), NIH NS42056, the Office of Research Development (Medical Research Service), the Department of Veterans Affairs, and the Juvenile Diabetes Research Foundation Center for the Study of Complications in Diabetes (JWR). Fluorescence microscopy was performed at the Morphology and Image Analysis Core of the Michigan Diabetes Research and Training Center (NIH5P60 DK20572).
Footnotes
Publisher's Disclaimer: This is a PDF file of an unedited manuscript that has been accepted for publication. As a service to our customers we are providing this early version of the manuscript. The manuscript will undergo copyediting, typesetting, and review of the resulting proof before it is published in its final citable form. Please note that during the production process errors may be discovered which could affect the content, and all legal disclaimers that apply to the journal pertain.
References
- 1.Browne SE, Beal MF. The energetics of Huntington’s disease. Neurochem Res. 2004;29:531–46. doi: 10.1023/b:nere.0000014824.04728.dd. [DOI] [PubMed] [Google Scholar]
- 2.Cui L, Jeong H, Borovecki F, Parkhurst CN, Tanese N, Krainc D. Transcriptional repression of PGC-1alpha by mutant huntingtin leads to mitochondrial dysfunction and neurodegeneration. Cell. 2006;127:59–69. doi: 10.1016/j.cell.2006.09.015. [DOI] [PubMed] [Google Scholar]
- 3.Weydt P, Pineda VV, Torrence AE, Libby RT, Satterfield TF, Lazarowski ER, Gilbert ML, Morton GJ, Bammler TK, Strand AD, Cui L, Beyer RP, Easley CN, Smith AC, Krainc D, Luquet S, Sweet IR, Schwartz MW, La Spada AR. Thermoregulatory and metabolic defects in Huntington’s disease transgenic mice implicate PGC-1alpha in Huntington’s disease neurodegeneration. Cell Metab. 2006;4:349–62. doi: 10.1016/j.cmet.2006.10.004. [DOI] [PubMed] [Google Scholar]
- 4.McGill JK, Beal MF. PGC-1alpha, a new therapeutic target in Huntington’s disease? Cell. 2006;127:465–8. doi: 10.1016/j.cell.2006.10.023. [DOI] [PubMed] [Google Scholar]
- 5.Leone TC, Lehman JJ, Finck BN, Schaeffer PJ, Wende AR, Boudina S, Courtois M, Wozniak DF, Sambandam N, Bernal-Mizrachi C, Chen Z, Holloszy JO, Medeiros DM, Schmidt RE, Saffitz JE, Abel ED, Semenkovich CF, Kelly DP. PGC-1alpha deficiency causes multi-system energy metabolic derangements: muscle dysfunction, abnormal weight control and hepatic steatosis. PLoS Biol. 2005;3:e101. doi: 10.1371/journal.pbio.0030101. [DOI] [PMC free article] [PubMed] [Google Scholar]
- 6.St-Pierre J, Drori S, Uldry M, Silvaggi JM, Rhee J, Jager S, Handschin C, Zheng K, Lin J, Yang W, Simon DK, Bachoo R, Spiegelman BM. Suppression of Reactive Oxygen Species and Neurodegeneration by the PGC-1 Transcriptional Coactivators. Cell. 2006;127:397–408. doi: 10.1016/j.cell.2006.09.024. [DOI] [PubMed] [Google Scholar]
- 7.Lin J, Wu PH, Tarr PT, Lindenberg KS, St-Pierre J, Zhang CY, Mootha VK, Jager S, Vianna CR, Reznick RM, Cui L, Manieri M, Donovan MX, Wu Z, Cooper MP, Fan MC, Rohas LM, Zavacki AM, Cinti S, Shulman GI, Lowell BB, Krainc D, Spiegelman BM. Defects in adaptive energy metabolism with CNS-linked hyperactivity in PGC-1alpha null mice. Cell. 2004;119:121–35. doi: 10.1016/j.cell.2004.09.013. [DOI] [PubMed] [Google Scholar]
- 8.Michael LF, Wu Z, Cheatham RB, Puigserver P, Adelmant G, Lehman JJ, Kelly DP, Spiegelman BM. Restoration of insulin-sensitive glucose transporter (GLUT4) gene expression in muscle cells by the transcriptional coactivator PGC-1. Proc Natl Acad Sci U S A. 2001;98:3820–5. doi: 10.1073/pnas.061035098. Epub 2001 Mar 13. [DOI] [PMC free article] [PubMed] [Google Scholar]
- 9.Louet JF, Hayhurst G, Gonzalez FJ, Girard J, Decaux JF. The coactivator PGC-1 is involved in the regulation of the liver carnitine palmitoyltransferase I gene expression by cAMP in combination with HNF4 alpha and cAMP-response element-binding protein (CREB) J Biol Chem. 2002;277:37991–8000. doi: 10.1074/jbc.M205087200. Epub 2002 Jul 9. [DOI] [PubMed] [Google Scholar]
- 10.Czubryt MP, McAnally J, Fishman GI, Olson EN. Regulation of peroxisome proliferator-activated receptor gamma coactivator 1 alpha (PGC-1 alpha ) and mitochondrial function by MEF2 and HDAC5. Proc Natl Acad Sci U S A. 2003;100:1711–6. doi: 10.1073/pnas.0337639100. [DOI] [PMC free article] [PubMed] [Google Scholar]
- 11.Butler R, Bates GP. Histone deacetylase inhibitors as therapeutics for polyglutamine disorders. Nat Rev Neurosci. 2006;7:784–96. doi: 10.1038/nrn1989. [DOI] [PubMed] [Google Scholar]
- 12.Steffan JS, Bodai L, Pallos J, Poelman M, McCampbell A, Apostol BL, Kazantsev A, Schmidt E, Zhu YZ, Greenwald M, Kurokawa R, Housman DE, Jackson GR, Marsh JL, Thompson LM. Histone deacetylase inhibitors arrest polyglutamine-dependent neurodegeneration in Drosophila. Nature. 2001;413:739–43. doi: 10.1038/35099568. [DOI] [PubMed] [Google Scholar]
- 13.McCampbell A, Taye AA, Whitty L, Penney E, Steffan JS, Fischbeck KH. Histone deacetylase inhibitors reduce polyglutamine toxicity. Proc Natl Acad Sci U S A. 2001;98:15179–84. doi: 10.1073/pnas.261400698. [DOI] [PMC free article] [PubMed] [Google Scholar]
- 14.Hockly E, Richon VM, Woodman B, Smith DL, Zhou X, Rosa E, Sathasivam K, Ghazi-Noori S, Mahal A, Lowden PA, Steffan JS, Marsh JL, Thompson LM, Lewis CM, Marks PA, Bates GP. Suberoylanilide hydroxamic acid, a histone deacetylase inhibitor, ameliorates motor deficits in a mouse model of Huntington’s disease. Proc Natl Acad Sci U S A. 2003;100:2041–6. doi: 10.1073/pnas.0437870100. [DOI] [PMC free article] [PubMed] [Google Scholar]
- 15.Ferrante RJ, Kubilus JK, Lee J, Ryu H, Beesen A, Zucker B, Smith K, Kowall NW, Ratan RR, Luthi-Carter R, Hersch SM. Histone deacetylase inhibition by sodium butyrate chemotherapy ameliorates the neurodegenerative phenotype in Huntington’s disease mice. J Neurosci. 2003;23:9418–27. doi: 10.1523/JNEUROSCI.23-28-09418.2003. [DOI] [PMC free article] [PubMed] [Google Scholar]
- 16.Gardian G, Browne SE, Choi DK, Klivenyi P, Gregorio J, Kubilus JK, Ryu H, Langley B, Ratan RR, Ferrante RJ, Beal MF. Neuroprotective effects of phenylbutyrate in the N171-82Q transgenic mouse model of Huntington’s disease. J Biol Chem. 2005;280:556–63. doi: 10.1074/jbc.M410210200. [DOI] [PubMed] [Google Scholar]
- 17.Lehman JJ, Barger PM, Kovacs A, Saffitz JE, Medeiros DM, Kelly DP. Peroxisome proliferator-activated receptor gamma coactivator-1 promotes cardiac mitochondrial biogenesis. J Clin Invest. 2000;106:847–56. doi: 10.1172/JCI10268. [DOI] [PMC free article] [PubMed] [Google Scholar]
- 18.Lin J, Tarr PT, Yang R, Rhee J, Puigserver P, Newgard CB, Spiegelman BM. PGC-1beta in the regulation of hepatic glucose and energy metabolism. J Biol Chem. 2003;278:30843–8. doi: 10.1074/jbc.M303643200. [DOI] [PubMed] [Google Scholar]
- 19.Cowell RM, Blake KR, Inoue T, Russell JW. Regulation of PGC-1alpha and PGC-1alpha-responsive genes with forskolin-induced Schwann cell differentiation. Neurosci Lett. 2008;439:269–74. doi: 10.1016/j.neulet.2008.04.104. Epub 2008 May 16. [DOI] [PMC free article] [PubMed] [Google Scholar]
- 20.Cowell RM, Blake KR, Russell JW. Localization of the transcriptional coactivator PGC-1alpha to GABAergic neurons during maturation of the rat brain. J Comp Neurol. 2007;502:1–18. doi: 10.1002/cne.21211. [DOI] [PubMed] [Google Scholar]
- 21.Suen DF, Norris KL, Youle RJ. Mitochondrial dynamics and apoptosis. Genes Dev. 2008;22:1577–90. doi: 10.1101/gad.1658508. [DOI] [PMC free article] [PubMed] [Google Scholar]
- 22.Weaver IC, Meaney MJ, Szyf M. Maternal care effects on the hippocampal transcriptome and anxiety-mediated behaviors in the offspring that are reversible in adulthood. Proc Natl Acad Sci U S A. 2006;103:3480–5. doi: 10.1073/pnas.0507526103. Epub 2006 Feb 16. [DOI] [PMC free article] [PubMed] [Google Scholar]
- 23.Rosenberg G. The mechanisms of action of valproate in neuropsychiatric disorders: can we see the forest for the trees? Cell Mol Life Sci. 2007;64:2090–103. doi: 10.1007/s00018-007-7079-x. [DOI] [PMC free article] [PubMed] [Google Scholar]
- 24.Kukidome D, Nishikawa T, Sonoda K, Imoto K, Fujisawa K, Yano M, Motoshima H, Taguchi T, Matsumura T, Araki E. Activation of AMP-activated protein kinase reduces hyperglycemia-induced mitochondrial reactive oxygen species production and promotes mitochondrial biogenesis in human umbilical vein endothelial cells. Diabetes. 2006;55:120–7. [PubMed] [Google Scholar]
- 25.St-Pierre J, Lin J, Krauss S, Tarr PT, Yang R, Newgard CB, Spiegelman BM. Bioenergetic analysis of peroxisome proliferator-activated receptor gamma coactivators 1alpha and 1beta (PGC-1alpha and PGC-1beta) in muscle cells. J Biol Chem. 2003;278:26597–603. doi: 10.1074/jbc.M301850200. [DOI] [PubMed] [Google Scholar]
- 26.Valle I, Alvarez-Barrientos A, Arza E, Lamas S, Monsalve M. PGC-1alpha regulates the mitochondrial antioxidant defense system in vascular endothelial cells. Cardiovasc Res. 2005;66:562–73. doi: 10.1016/j.cardiores.2005.01.026. [DOI] [PubMed] [Google Scholar]