

Structured Summary
Objective
Multiple diagnostic modalities may be needed to establish the source of excessive androgen production in women. The role of selective venous catheterization in this process has not been established fully.
Design
A study of hyperandrogenemic subjects and literature review.
Patients
Four hyperandrogenemic women and an additional 132 previously reported cases with available testing data and a pathologic diagnosis were evaluated.
Measurements
Serum androgens, diagnostic imaging, and ovarian venous effluent sampling. Criteria to distinguish ovarian tumours from other ovarian conditions and to localize the lesion(s) were evaluated.
Results
Basal peripheral testosterone levels ≥4.51 nmol/L (≥130 ng/dL) discriminated ovarian tumours from benign causes of hyperandrogenism (sensitivity: 93.8%, 95%CI: 85.0–98.2%; specificity: 77.8%, 95%CI: 66.4–86.7%). Single lesions produced higher ipsilateral testosterone concentrations (612.6±162.0 nmol/L; 17,653±4,670 ng/dL) compared to contralateral values (testosterone: 26.4±5.2 nmol/L; 761±150 ng/dL). In women with peripheral testosterone ≥4.51 nmol/L, a right-to-left (R:L) ovarian testosterone ratio ≥1.44 correctly identified all 18 women with right-sided tumours and misclassified 2 with bilateral lesions; 12 of 14 women with left-sided or bilateral lesions had a lower R:L value. When this criterion was combined with a left-to- right (L:R) ovarian testosterone effluent ratio of > 15 to identify left sided tumours, overall 66% of women were correctly categorized.
Conclusions
Peripheral testosterone concentrations identified ovarian androgen-producing tumours, and venous sampling could correctly localize 66% of these, suggesting a role for sampling when imaging studies are not revealing.
Keywords: selective venous sampling, effluent sampling, hyperandrogenism, ovarian tumours, hirsutism
INTRODUCTION
Hyperandrogenism is common in women, with most cases attributed to polycystic ovary syndrome (PCOS). Nevertheless, it is important to identify and remove the rare androgen-secreting tumours. While clinical history and baseline serum androgens (testosterone, androstenedione, and DHEAS) may increase clinical suspicion, the localization of virilizing tumours may require several diagnostic modalities, including dynamic ovarian and adrenal assessment, and diagnostic imaging.1 However, the interpretation of testing results may be difficult and imaging modalities, such as magnetic resonance (MR), computed tomography (CT) and ultrasound (US), might not identify ovarian lesions.2
Selective venous catheterization has been employed to aid in the diagnosis and localization of androgen-secreting ovarian and adrenal tumours. However, its utility is not well established. Opponents point out the difficulties encountered in catheterizing the appropriate venous drainage and in interpreting the results.3, 4 Proponents suggest criteria for which surgical therapy should be employed based on effluent androgen concentrations.5–7
To assess further the utility of selective ovarian effluent sampling in diagnosing and localizing androgen-secreting tumours, we examined our experience and reviewed the existing literature.
PATIENTS and METHODS
Case series
Between 2000 and 2007, 4 hirsute Caucasian women were referred to the National Institutes of Health (NIH) for assessment of potential androgen-secreting ovarian or adrenal tumours. Each was studied under an Institutional Review Board-approved protocol after giving informed consent. Each patient underwent transvaginal US using a 4–9 MHz transvaginal probe with colour Doppler. MR imaging was performed using contrast enhanced T1- and T2-weighted SE images with a 6 mm slice thickness. Contrasted CT imaging of the chest, abdomen and pelvis was also performed. Ovarian volume was determined using the prolate ellipsoid formula (π/6 × longitudinal × anteroposterior × transverse diameters) with normal menopausal ovarian volume by ultrasound ranging from 0.03–2.9 cm3.8 The normal range for post-menarcheal girls was 1.2–13.2 cm3.9 Baseline (and in some cases stimulated) endocrine assessments were performed. Ovarian and adrenal venous catheterization and venous effluent sampling followed. Hormonal profiles were evaluated according to the case presentation and some women underwent provocative testing of peripheral and effluent venous samples using human chorionic gonadotropin (hCG) and ACTH. In those cases, due to the lack of evidence, a standardized hCG dose was not used. Finally, in the absence of normative data, various temporal sampling protocols were used following provocative stimulation.
Case 1
Upon admission at the NIH, a 71 year-old woman was noted to have temporal scalp hair thinning and terminal hair on her chin, arms, and abdomen. The pelvic exam was normal. MR imaging and transvaginal US confirmed a normal pelvis; however, CT imaging suggested a 2.5 cm lesion adjacent to the right ovary. Table 1 presents the baseline laboratory evaluation.
Table 1.
Peripheral laboratory characteristics of 4 patients with unknown source of hyperandrogenism
| Patient/Test Details | Age (yr) | Test | Baseline | hCG Stimulation | ACTH Stimulation | Dex. Suppression | ||||
|---|---|---|---|---|---|---|---|---|---|---|
| Baseline | 24 hrs | 48 hrs | ||||||||
| Case 1 | 71 | T (nmol/L) | 7.50 | ** | ** | 3.96 | 3.21 | 6.03 | ||
| Free T (nmol/L) | 1.20 | ** | ** | ** | ** | ** | ||||
| hCG: None | DHEA (nmol/L) | 1155.5 | ** | ** | ** | ** | ** | |||
| ACTH: None | LH (IU/L) | 41 | ** | ** | ** | ** | ** | |||
| Dex: 0.5 mg q 6 hrs (#) | FSH (IU/L) | 71 | ** | ** | ** | ** | ** | |||
| E2 (pmol/L) | 168.9 | ** | ** | 123.3 | 136.9 | 263.6 | ||||
| F (nmol/L) | 389.0 | ** | ** | 405.6 | 46.9 | 38.6 | ||||
| TSH (mIU/L) | 1.32 | ** | ** | ** | ** | ** | ||||
| Inhibin A (ng/L) | <16 | ** | ** | ** | ** | ** | ||||
| Inhibin B (ng/L) | <10 | ** | ** | ** | ** | ** | ||||
| 4 hrs post | Baseline | 4 hrs post | Baseline | 48 hrs | ||||||
| Case 2 | 62 | T (nmol/L) | 18.04 | 36.71 | 38.44 | 30.99 | 30.40 | 30.36 | ||
| Free T (nmol/L) | 6.32 | 12.46 | 17.28 | 10.41 | 14.26 | 9.72 | ||||
| hCG: 2,000 IU | A4 (nmol/L) | 6.28 | 8.4 | 7.0 | 8.4 | 6.3 | 9.4 | |||
| ACTH: 250 mcg | DHEA (nmol/L) | 1075.7 | ** | ** | ** | ** | ** | |||
| Dex: 0.5 mg q 6 hrs (#) | DHEAS (µmol/L) | 2.08 | 2.08 | ** | ** | ** | ** | |||
| 17-OH P (nmol/L) | 1.74 | ** | ** | ** | ** | ** | ||||
| LH (IU/L) | 2 | ** | ** | ** | ** | ** | ||||
| E2 (pmol/L) | 205.6 | 205.6 | 28.6 | 260.6 | ** | ** | ||||
| P4 (nmol/L) | ** | 2.54 | ** | ** | ** | ** | ||||
| F (nmol/L) | 364.2 | ** | ** | ** | ** | |||||
| Cholesterol (mg/dL) | ** | ** | 0.07 | 0.33 | ** | |||||
| Inhibin B (ng/L) | <7 | ** | ** | ** | ** | |||||
| Baseline | 48 hrs | |||||||||
| Case 3 | 12 | T (nmol/L) | 5.48 | ** | ** | 1.46 | 1.46 | |||
| A4 (nmol/L) | 19.54 | ** | ** | 8.0 | 6.6 | |||||
| hCG: None | DHEA (nmol/L) | ** | ** | ** | 1943.2 | 624.6 | ||||
| ACTH: None | DHEAS (µmol/L) | ** | ** | ** | 3.16 | 1.08 | ||||
| Dex: 0.5 mg q 6 hrs (#) | LH (IU/L) | 10 | ** | ** | ** | ** | ||||
| E2 (pmol/L) | 194.6 | ** | ** | 121.1 | ** | |||||
| F (nmol/L) | ** | ** | ** | 929.8 | <27.6 | |||||
| 24 hrs post | 48 hrs post | Baseline | 4 hrs post | Baseline | 24 hrs | 48 hrs | ||||
| Case 4 | 80 | T (nmol/L) | 19.47 | 27.76 | 31.89 | 18.15 | 14.57 | ** | 15.09 | 16.41 |
| Free T (nmol/L) | 0.41 | 0.47 | 0.57 | .29 | 0.20 | ** | 0.20 | 0.25 | ||
| hCG: 2,000 IU | A4 (nmol/L) | 10.57 | 18.3 | 15.8 | 7.8 | 6.7 | ** | 5.7 | 7.2 | |
| ACTH: 250 mcg | DHEA (nmol/L) | 347.0 | 589.9 | 381.7 | <173.5 | <173.5 | ** | <173.5 | 312.3 | |
| Dex: 0.5 mg q 6 hrs (#) | DHEAS (µmol/L) | 0.46 | 0.59 | 0.92 | 0.62 | 0.592 | ** | <0.41 | <0.46 | |
| 17-OH P (ng/dL) | 4.17 | 8.61 | 6.00 | 2.43 | 2.34 | ** | 2.88 | 5.07 | ||
| LH (IU/L) | 35 | ** | ** | ** | ** | ** | ** | ** | ||
| F (nmol/L) | 466.3 | 320.0 | 264.9 | 333.8 | 607.0 | ** | <27.6 | <27.6 | ||
| Cholesterol(mmol/L) | 3.08 | ** | ** | ** | ** | ** | ** | ** | ||
not performed
steroids were assessed 6 hours following the last dose of the 2 mg two-day DEX suppression test (48 hrs)
normative peripheral values: Androstendione (A4): 11–12 years: 1.4–3.5 nmol/L; post-menopausal: <6.3 nmol/L; AFP: < 9.0 µg/L; CEA: 0 – 2.5 µg/L; DHEA: 11–12 years: <1735.0 nmol/L; post-menopausal: <1735.0 nmol/L; DHEAS: 0.95 – 11.6 µmol/L; Estradiol (E2): post-menopausal <73.4 pmol/L; Cortisol (F): 138.0 – 689.8 nmol/L; hCG: <0.9 IU/L; Inhibin B: 11–12 years: <16–186 ng/L; post-menopausal: <16 ng/L; LH: post-menopausal: 15 – 59 IU/L; Progesterone (P4): post-menopausal: <0.64 – 3.18 nmol/L; 17-OH Progesterone (17-OH P): post-menopausal: <1.53 nmol/L; Testosterone (T): 11–12 years: 0–2.74 nmol/L; post-menopausal: 0.69–2.78 nmol/L; Free Testosterone (Free T): 0–0.08 nmol/L; TSH: 0.40 – 4.00 mIU/L.
Due to imaging uncertainty, venous catheterization was performed. Both ovarian veins and the left adrenal vein were catheterized easily; however, right adrenal venous catheter placement was difficult. Baseline and hCG stimulated testosterone, estradiol, and cortisol levels were obtained (Table 2). Due to the elevated right and left ovarian effluent testosterone concentrations after hCG stimulation, a bilateral salpingoophorectomy was performed. Firm ovaries measuring 2.4 cm3 on the right and 1.5 cm3 on the left were noted at surgery, while the remainder of the pelvis was normal. Histopathology revealed bilateral ovarian hyperthecosis. Post-operatively, the peripheral testosterone concentration normalized (1.84 nmol/L; 53 ng/dL).
Table 2.
Case results of bilateral ovarian and adrenal effluent sampling.
| Patient/Testing Details | Source | hCG stimulation | ACTH stimulation | ||||||
|---|---|---|---|---|---|---|---|---|---|
| 0 min. | 10 min. | 20 min. | 40 min. | 0 min. | 15 min. | 30 min. | |||
| Case 1 | R. ovary | T (nmol/L) | 14.12 | 11.80 | 6.21 | 13.50 | ** | ** | ** |
| E2 (pmol/L) | 392.80 | 370.77 | 345.07 | 275.33 | ** | ** | ** | ||
| Age: 71 years-old | F (nmol/L) | 124.16 | 104.84 | 82.77 | 573.87 | ** | ** | ** | |
| Final Diagnosis: | L. ovary | T (nmol/L) | 3.23 | 2.88 | 2.78 | 8.22 | ** | ** | ** |
| Ovarian hyperthecosis | E2 (pmol/L) | 234.94 | 286.34 | 198.23 | 315.71 | ** | ** | ** | |
| F (nmol/L) | 107.60 | 93.81 | 88.29 | 275.90 | ** | ** | ** | ||
| hCG Dosage: 10,000IU | Peripheral | T (nmol/L) | 3.96 | 3.96 | 4.06 | 4.79 | ** | ** | ** |
| ACTH Dosage: None | E2 (pmol/L) | 220.26 | 282.67 | 334.06 | 385.46 | ** | ** | ** | |
| F (nmol/L) | 146.23 | 118.64 | 93.81 | 104.84 | ** | ** | ** | ||
| R. adrenal vein | T (nmol/L) | 9.02 | ** | ** | ** | ** | ** | ** | |
| E2 (pmol/L) | 146.84 | ** | ** | ** | ** | ** | ** | ||
| F (nmol/L) | 416.61 | ** | ** | ** | ** | ** | ** | ||
| L. adrenal vein | T (nmol/L) | 6.04 | ** | ** | ** | ** | ** | ** | |
| E2 (pmol/L) | 220.26 | ** | ** | ** | ** | ** | ** | ||
| F (nmol/L) | 300.73 | ** | ** | ** | ** | ** | ** | ||
| Peripheral | T (nmol/L) | 4.09 | ** | ** | ** | ** | ** | ** | |
| E2 (pmol/L) | 297.35 | ** | ** | ** | ** | ** | ** | ||
| F (nmol/L) | 171.06 | ** | ** | ** | ** | ** | ** | ||
| Case 2 | 0 min. | 10 min. | 20 min. | 30 min. | 0 min. | 15 min. | 30 min. | ||
| R. ovary vein | T (nmol/L) | 15.06 | 13.64 | 13.39 | 12.39 | ** | ** | ** | |
| Age: 62 years-old | L. ovary vein | T (nmol/L) | 11.00 | 17.25 | 10.38 | 23.04 | ** | ** | ** |
| Final Diagnosis: | Peripheral vein | T (nmol/L) | 12.77 | 9.37 | 10.20 | 16.59 | ** | ** | ** |
| Left ovarian hilar cell tumour | R. adrenal vein | T (nmol/L) | ** | ** | ** | ** | 12.42 | 24.33 | 31.23 |
| F (nmol/L) | ** | ** | ** | ** | ** | 246.0 | 404.0 | ||
| hCG Dosage: 5,000IU | L. adrenal vein | T (nmol/L) | ** | ** | ** | ** | 11.97 | 24.53 | 25.50 |
| ACTH Dosage: 250 mcg | F (nmol/L) | ** | ** | ** | ** | ** | 265.0 | 230.0 | |
| Peripheral vein | T (nmol/L) | ** | ** | ** | ** | 12.15 | 11.97 | 11.76 | |
| F (nmol/L) | ** | ** | ** | ** | ** | 333.84 | 383.50 | ||
| Case 3 | 0 min. | 10 min. | 20 min. | 30 min. | 0 min. | 15 min. | 30 min. | ||
| R. ovary | T (nmol/L) | 20.72 | ** | ** | ** | ** | ** | ** | |
| Age: 12 years-old | A4 (nmol/L) | 20.6 | ** | ** | ** | ** | ** | ** | |
| Final Diagnosis: | AFP (µg/L) | 1.9 | ** | ** | ** | ** | ** | ** | |
| Ovarian hyperthecosis | CEA (µg/L) | 0.5 | ** | ** | ** | ** | ** | ** | |
| hCG (IU/L) | <0.5 | ** | ** | ** | ** | ** | ** | ||
| hCG Dosage: None | L. ovary | T (nmol/L) | 5.41 | ** | ** | ** | ** | ** | ** |
| ACTH Dosage: None | AFP (µg/L) | 1.8 | ** | ** | ** | ** | ** | ** | |
| CEA (µg/L) | 0.7 | ** | ** | ** | ** | ** | ** | ||
| hCG (IU/L) | 0.6 | ** | ** | ** | ** | ** | ** | ||
| Peripheral | T (nmol/L) | 5.21 | ** | ** | ** | ** | ** | ** | |
| A4 (nmol/L) | 17.5 | ** | ** | ** | ** | ** | ** | ||
| AFP (µg/L) | 1.7 | ** | ** | ** | ** | ** | ** | ||
| CEA (µg/L) | 0.6 | ** | ** | ** | ** | ** | ** | ||
| hCG (IU/L) | <0.5 | ** | ** | ** | ** | ** | ** | ||
| Case 4 | 0 min. | 10 min. | 20 min. | 30 min. | 0 min. | 10 min. | 15 min. | ||
| R. ovary vein | T (nmol/L) | ** | ** | ** | ** | 36.78 | ** | 91.96 | |
| Age: 80 years-old | E2 (pmol/L) | ** | ** | ** | ** | 190.89 | ** | 220.63 | |
| Final Diagnosis: | L. ovary vein | T (nmol/L) | ** | ** | ** | ** | 28.70 | ** | 27.45 |
| Left ovarian hilar cell tumour | E2 (pmol/L) | ** | ** | ** | ** | 191.63 | ** | 157.85 | |
| R. adrenal vein | T (nmol/L) | ** | ** | ** | ** | 30.36 | 32.62 | 26.65 | |
| hCG Dosage: None | F (nmol/L) | ** | ** | ** | ** | 350.39 | 582.0 | 415.0 | |
| ACTH Dosage: 250 mcg | L. renal vein | T (nmol/L) | ** | ** | ** | ** | 25.47 | 26.13 | 25.85 |
| F (nmol/L) | ** | ** | ** | ** | 212.44 | 444.20 | 482.83 | ||
| Peripheral vein | T (nmol/L) | ** | ** | ** | ** | 18.15 | 26.20 | 26.27 | |
| F (nmol/L) | ** | ** | ** | ** | 270.38 | 391.78 | 413.85 | ||
not performed
normative peripheral values: Androstendione (A4): 11–12 years: 1.4–3.5 nmol/L; post-menopausal: <6.3 nmol/L; AFP: < 9.0 µg/L; CEA: 0 – 2.5 µg/L; Estradiol (E2): post-menopausal <73.4 pmol/L; hCG: <0.9 IU/L. Testosterone (T): 11–12 years: 0–2.74 nmol/L; post-menopausal: 0.69–2.78 nmol/L.
Case 2
An otherwise healthy 62 year-old woman was referred for increasing balding and hirsutism on the upper lip, chin, areola and inner thighs over the last 5–10 years. She reported a deepening voice, aggressive behaviour, and increasing libido. The referring clinic identified an elevated testosterone (27.76–31.23 nmol/L; 800–900 ng/dL) with normal androstenedione, 17-α hydroxyprogesterone, DHEA, and 24-hour urinary free cortisol and 17-ketosteroids.
At the NIH, a physical examination confirmed the above findings; the pelvic examination was normal except for a surgically absent uterus. Laboratory evaluation was performed (Table 1). Transvaginal US, abdominal and pelvic CT and MR imaging were normal. Dexamethasone (Dex) (0.5 mg every 6 hours for 48 hours) administration did not change testosterone values, but cortisol declined to <30.35 nmol/L (1.1 µg/dL). Selective ovarian and adrenal venous sampling was performed 24 hours after the last dose of Dex using hCG and ACTH (Table 2).
Based on the ovarian effluent testosterone, no evidence of an adrenal androgen source, and menopausal status, both ovaries were resected. They were enlarged without masses (left 9.2 cm3; right 8.1 cm3). Pathologic evaluation revealed mild stromal hyperplasia in the right ovary and a left ovarian hilar cell tumour (1.5×1.0×1.0 cm) with strong inhibin staining. The post-operative testosterone normalized (0.94 nmol/L (27 ng/dL)).
Case 3
A 12 year-old girl presented at 2 weeks of age due to clitoromegaly. There was no family history of congenital adrenal hyperplasia. An ACTH stimulation test at that time and abdominal and pelvic MR imaging at 3 months of age were reportedly normal. Breast development, pubic hair, and clitoral elongation (1.5 cm) ensued by 12 months of age; an ACTH stimulation test was again normal (DHEA: <517.0 nmol/L (149 ng/dL); testosterone: 0.42 nmol/L (12 ng/dL)).
At age 5 years she had Tanner stage III breasts and pubic hair, a 10.5 cm annual growth rate and a bone age of 11 years. Ultrasound showed enlarged ovaries (right 13.1 cm3; left 13.2 cm3) with multiple cysts. There was a normal 60 min response to combined ACTH/GnRH stimulation (testosterone: 0.45 nmol/L (13 ng/dL); estradiol: 36.7 pmol/L (10 pg/dL); DHEAS: <17.4 nmol/L (<5 ng/dL); cortisol: 1020.8 nmol/L (37 µg/dL); undetectable LH and FSH).
The patient was referred to the NIH at age 12. She had clitoromegaly, Tanner IV breasts, and an enlarged lower jaw, hands, and feet, but no café-au-lait spots. Serum IGF-1 was normal and growth hormone suppressed during an oral glucose tolerance test. Cortisol and DHEA but not testosterone suppressed after Dex (Table 1). A 7 mm left adrenal nodule and a 1.6 cm right ovarian simple cyst were noted on radiographic imaging. Ovarian tumour markers (hCG, alpha-fetoprotein (AFP), and carcinoembryonic antigen (CEA)), were normal. Ovarian and adrenal venous sampling was performed (Table 2). The right ovarian effluent testosterone was four-fold higher than the left and peripheral values. Based on these results and a right ovarian nodule at surgery, the right ovary was removed. Pathologic evaluation revealed a polycystic ovary with hyperthecosis. The post-operative testosterone normalized (1.60 nmol/L; 46 ng/dL).
Case 4
An 80-year-old woman was referred for male pattern baldness and a 5-year history of progressive hirsutism and a deepening voice. Refractory labile hypertension was noted. An initial serum testosterone exceeded 20.82 nmol/L (600 ng/dL). An evaluation suggesting a left adrenal source of testosterone led to resection of a histologically normal left gland. Testosterone remained elevated (10.41 nmol/L (300 ng/dL) and 17.35–31.23 nmol/L (500–900 ng/dL)).
Physical examination at the NIH confirmed balding and terminal hair on the back, chest, arms, and abdomen (Ferriman-Gallwey score=18). There was no clitoromegaly or adnexal mass. The patient was normotensive on atenolol and nifedipine. Transvaginal pelvic US demonstrated a normal uterus but failed to visualize ovaries. Abdominal and pelvic CT showed normal adrenal glands and a normal pelvis. MR imaging was not performed due to a metallic implant. Baseline and dynamic peripheral blood sampling was obtained (Table 1). After receiving hCG (2,000 IU), testosterone increased from 19.47 nmol/L (561 ng/dL) to 31.89 nmol/L (919 ng/dL) by 48 hours.
At venous sampling the right ovarian testosterone was increased (91.96 nmol/L; 2,650 ng/dL) compared to peripheral values (26.27 nmol/L; 757 ng/dL) 15 minutes after ACTH 250 mcg. At surgery, the right ovary appeared normal, while the left ovary had a 1 cm dark cystic lesion. Because of the abnormal-appearing left ovary, and the venous step-up from the right ovary, a bilateral oophorectomy was performed. The final pathology identified a left ovarian hilar cell tumour and a normal right ovary. Testosterone normalized (<0.24 nmol/L; <7 ng/dL).
Prediction modelling
Literature Review and Statistical Analysis
PubMed, Ovid, Scopus, ISI Web of Knowledge, and the Cochrane Library were searched without language restrictions in March 2008 to identify additional reports of ovarian venous sampling to diagnose and localize sites of androgen production. Studies reporting individual peripheral and ovarian effluent sampling results and pathologically confirmed diagnoses were included in a database with the NIH cases. Because of limited data regarding hCG and ACTH stimulation and/or dexamethasone suppression protocols, only unstimulated effluent values were evaluated further.
The first outcome considered for analysis was the distinction between ovarian tumours and other ovarian conditions that were responsible for hirsutism. To this end, patients were categorized as having or not having an ovarian tumour. Ovarian tumours (cases) included the following diagnoses: Sertoli-Leydig/Leydig cell tumour (n=28), lipid cell tumour (n=19), hilar cell tumour (n=12), granulosa cell tumour (n=1), Brenner tumour (n=1), gynandroblastoma (n=1), gonadal stromal tumour (n=1), papillary serous cystadenoma with functional stroma (n=1), and undifferentiated steroid-producing tumour (n=1). Non-cases (no tumour) diagnoses included idiopathic hirsutism (n=32), PCOS (n=26), hyperthecosis (n=10), and luteinised theca cysts (n=4).
Predictors of ovarian tumour presence were evaluated using t-test and unadjusted unconditional logistic regression (SAS 9.1; SAS Institute; Cary, NC). Hormonal factors were first considered independently; each factor was compared between cases and non-cases. Combinations of factors were then considered when data were available from ≥30 individuals. These multiple factor prediction models were generated using multivariable backward selection; score criteria were utilized to identify the best fitting models.
Receiver operating characteristic (ROC) curves, which plot sensitivity against 1 – specificity across all possible cut-off points were generated for the best fitting models. Diagnostic cut-off points were estimated, giving equal weight to sensitivity and specificity. These cut-off points were determined using Youden’s index, the c-statistic representing the total predictive ability, and p-values from logistic regression models. Alternative models optimizing sensitivity or specificity were considered. Finally, models with interaction terms to mirror a multi-step “rule-in, rule-out” process were evaluated.
A second outcome was the ability of venous effluent sampling to predict tumour location. Mean venous effluent levels were determined for tumour sidedness (right, left, both, unknown) and were analyzed using ANOVA models. For all analyses, statistical significance was inferred if p<0.05. Confidence intervals were calculated for proportions using binomial exact methods. Positive (PPV) and negative (NPV) predictive values were calculated for diagnostic cut-off points.
Results
We identified 132 subjects with hirsutism undergoing selective ovarian venous sampling from the literature. Each subject had at least some effluent values and a final diagnosis involving an ovarian source of hyperandrogenism.2–7, 10–42 With our four patients, there were 136 total subjects with hyperandrogenism attributed to ovarian causes.
Diagnosis of Tumour
Diagnostic models were generated for individual hormones including peripheral and effluent testosterone, androstenedione and cortisol (Table 3). Peripheral testosterone discriminated cases (i.e. tumour, n=65) from non-cases (n=71) with a sensitivity of 93.8% (95%CI: 85.0 – 98.2%) and specificity of 77.8% (95%CI: 66.4 – 86.7%) (optimal cut-off point testosterone ≥4.51 nmol/L (≥130 ng/dL); p<0.001). Strong predictive ability also was observed for the highest right or left ovarian venous testosterone level (p = 0.01), albeit with lower specificity than with peripheral values (Table 3). Both peripheral and venous effluent measures for androstenedione provided poorer discriminatory ability and were not statistically significant.
Table 3.
Bivariate relations between tumours and predictors—results from logistic regression models and receiver operating characteristic curve analysis
| Factor | Equal weights to Sensitivity and Specificity | Specificity = 100% | Sensitivity = 100% | ||||||||
|---|---|---|---|---|---|---|---|---|---|---|---|
| source | hormone | n | Optimal cut-point | Sensitivity | Specificity | c statistic | p-value* | Cut-point | Sensitivity at cut-point | Cut-point | Specificity at cut-point |
| nmol/L | nmol/L | nmol/L | |||||||||
| Peripheral | T | 136 | 4.51 | 93.8% | 77.8% | 0.91 | <0.001 | 23.94 | 24.6% | 1.70 | 19.4% |
| Ovarian, Right | T | 72 | 26.96 | 67.4% | 73.1% | 0.77 | 0.07 | 505.79 | 21.7% | 4.13 | 7.7% |
| Ovarian, Left | T | 99 | 7.32 | 91.5% | 48.1% | 0.69 | 0.3 | 727.90 | 6.4% | 2.26 | 17.3% |
| Ovarian Maximum | T | 110 | 14.82 | 92.9% | 57.4% | 0.82 | 0.01 | 554.33 | 21.4% | 4.51 | 29.6% |
| Ovarian Average | T | 110 | 15.72 | 83.9% | 64.8% | 0.81 | 0.02 | 1003.35 | 14.3% | 3.99 | 25.9% |
| Adrenal, Right | T | 47 | 5.86 | 87.0% | 70.8% | 0.79 | 0.21 | 39.42 | 4.3% | 3.09 | 50.0% |
| Adrenal, Left | T | 78 | 7.04 | 71.4% | 70.0% | 0.73 | 0.14 | 45.21 | 3.6% | 2.19 | 14.0% |
| Peripheral | A | 89 | 21.08 | 15.0% | 98.0% | 0.53 | 0.11 | 22.41 | 15.0% | 0.45 | 0.0% |
| Ovarian, Right | A | 44 | 2522.43 | 8.3% | 100.0% | 0.33 | 0.51 | 2522.43 | 8.3% | 2.93 | 0.0% |
| Ovarian, Left | A | 71 | 20.80 | 70.4% | 63.6% | 0.67 | 0.75 | 0.98 | 0.0% | 2083.25 | 0.0% |
| Ovarian Maximum | A | 81 | 1028.61 | 8.8% | 97.9% | 0.43 | 0.27 | 1877.97 | 8.8% | 2.83 | 4.3% |
| Ovarian Average | A | 81 | 628.93 | 11.8% | 97.9% | 0.41 | 0.30 | 1218.81 | 8.8% | 2.83 | 4.3% |
| Adrenal, Right | A | 30 | 33.68 | 75.0% | 38.9% | 0.50 | 0.51 | 5.17 | 8.3% | 101.70 | 5.6% |
| Adrenal, Left | A | 61 | 21.85 | 66.7% | 67.4% | 0.66 | 0.16 | 2.83 | 6.7% | 136.21 | 8.7% |
| Peripheral | F | 53 | 270.38 | 87.0% | 70.0% | 0.83 | 0.002 | 662.2 | 13.0% | 118.6 | 13.3% |
| Ovarian, Right | F | <30 | ~ | ~ | ~ | ~ | ~ | ~ | ~ | ~ | ~ |
| Ovarian, Left | F | 39 | 386.26 | 53.8% | 92.3% | 0.75 | 0.02 | 496.6 | 46.2% | 99.3 | 0.0% |
| Ovarian Maximum | F | 44 | 496.62 | 64.3% | 100.0% | 0.80 | 0.004 | 524.2 | 57.1% | 99.3 | 0.0% |
| Ovarian Average | F | ~ | ~ | ~ | ~ | ~ | ~ | ~ | ~ | ~ | ~ |
| Adrenal, Right | F | <30 | ~ | ~ | ~ | ~ | ~ | ~ | ~ | ~ | ~ |
| Adrenal, Left | F | 47 | 7424.47 | 18.2% | 100.0% | 0.54 | 0.20 | 7424.5 | 18.2% | 146.2 | 5.6% |
from logistic regression models of ovarian tumours on hormone levels
Models determined by backward selection to be among the best-fitting models using one, two, or three hormonal factors were evaluated using the 39 women with available data on all factors (Table 4). When assessing each factor individually, testosterone (cut-off point ≥4.51 nmol/L; ≥130 ng/dL) was the best discriminating factor (c-statistic: 0.943; 6 false classifications). Models including additional factors illustrated only slight improvements in overall classification. The best fitting model considered peripheral testosterone ≥4.51 nmol/L (≥130 ng/dL), peripheral cortisol ≥281.4 nmol/L (≥10.2 µg/dL) and the interaction term of the two variables (Table 4, Model D) (sensitivity: 100%; 95%CI: 76.8 – 100.0%; specificity: 96.4%; 95%CI: 81.0 – 99.9%). Table 5 shows case status (tumour or no tumour), peripheral cortisol and androstenedione, and maximum ovarian venous testosterone and cortisol on the 17 women in this group with peripheral testosterone ≥4.51 nmol/L (≥130 ng/dL).
Table 4.
Results from multivariable prediction models of tumours—cut-points, model fit statistics, and receiver operating characteristic curve statistics among individuals in the study population with complete data on all considered factors (n=39).
| Factors(#) | Model | Factors in model | Cut-point | c-statistic | Correctly predicted | Sensitivity (95% CI) | Specificity (95% CI) | False Positives | False Negatives |
|---|---|---|---|---|---|---|---|---|---|
| 0.943 | 85.7 % | 78.6 % | 88.9 % | 3 | 3 | ||||
| 1 | A | 1. Peripheral T (nmol/L) | 4.51 | (49.2–95.3%) | (70.8–97.6%) | ||||
| 2 | B | 1. Peripheral T (nmol/L) | 4.51 | 0.950 | 92.7 % | 92.9 % (66.1–99.8%) |
92.6 % (75.7–99.1%) |
2 | 1 |
| 2. Peripheral F (nmol/L) | 455.24 | ||||||||
| 3 | C | 1. Peripheral T (nmol/L) | 4.51 | 0.959 | 92.7 % | 92.9 % (66.1–99.8%) |
92.6 % (75.7–99.1%) |
2 | 1 |
| 2. Peripheral F (nmol/L) | 455.24 | ||||||||
| 3. Peripheral A (nmol/L) | 14.48 | ||||||||
| 2+* | D | 1. Peripheral T ≥4.51 nmol/L | ~ | 0.982 | 97.6 % | 100 % (76.8–100.0%) |
96.4 % (81.0–99.9%) |
0 | 1 |
| 2. Peripheral F >281.42 nmol/L | ~ | ||||||||
| 3. Interaction |
best-fit model
Table 5.
Data for case (tumour presence) status and levels of measured factors on all women with peripheral testosterone ≥4.51 nmol/L (≥130 ng/dL) among individuals in the study sample with complete data on all considered factors (n = 17)
| Tumour | Peripheral F nmol/L | Peripheral A4 nmol/L | Ovarian T - Max nmol/L | Ovarian F – Max nmol/L |
|---|---|---|---|---|
| No | 226.24 | 4.89 | 106.88 | 220.72 |
| No | 248.31 | 13.96 | 170.03 | 386.26 |
| No | 264.86 | 8.55 | 5.59 | 215.20 |
| Yes | 281.42 | 11.69 | 24.07 | 521.45 |
| Yes | 289.70 | 5.62 | 24.29 | 99.32 |
| Yes | 303.49 | 51.65 | 85.71 | 689.75 |
| Yes | 311.77 | 18.85 | 28.11 | 201.41 |
| Yes | 413.85 | 10.12 | 560.47 | 184.85 |
| Yes | 435.92 | 10.05 | 15.96 | 309.01 |
| Yes | 471.79 | 32.46 | 44.49 | 4670.99 |
| Yes | 480.07 | 18.15 | 57.60 | 6069.80 |
| Yes | 496.62 | 85.75 | 113.82 | 1053.94 |
| Yes | 579.39 | 7.33 | 16.31 | 579.39 |
| Yes | 579.39 | 6.28 | 22.21 | 358.67 |
| No | 609.74 | 16.37 | 32.34 | 474.55 |
| Yes | 662.16 | 3.49 | 17.35 | 634.57 |
| Yes | 717.34 | 4.54 | 16.31 | 496.62 |
Localization of Tumour
Finally, we considered whether venous effluent sampling results predicted the location of the lesion. Unilateral lesions were associated with higher ipsilateral compared to contralateral ovarian effluent concentrations of testosterone {mean ±SE: ipsilateral: 612.56±162.05 nmol/L (17,653±4,670 ng/dL); contralateral: 26.41±5.21 nmol/L (761±150 ng/dL)} and androstenedione {(mean ±SE: ipsilateral: 514.1±254.8 nmol/L (14,732±7,302 ng/dL); contralateral: 44.8±23.4 nmol/L (1,283±670 ng/dL)}. However, the differences between the two sides were not statistically different, as the high mean values were driven by a small number of extremely high values {(testosterone: 5th percentile = 4.51 nmol/L (130 ng/dL); median = 70.09 nmol/L (2,020 ng/dL); 95th percentile = 3338.14 nmol/L (96,200 ng/dL)} (Figure 1).
Figure 1.
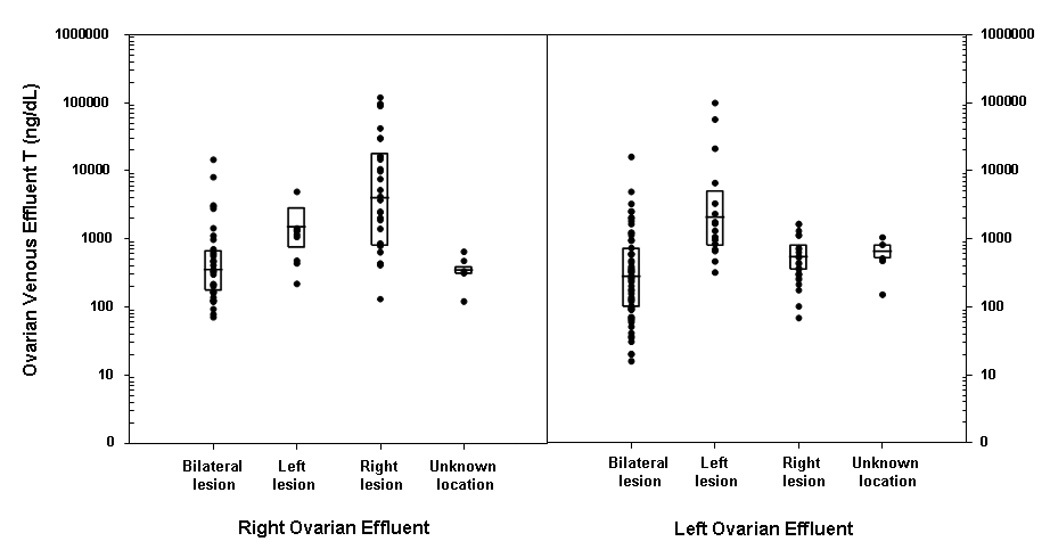
Right and left ovarian effluent testosterone (T) concentrations by location of the pathologically confirmed lesion.
Footnote: The boxplot displays the 25th and 75th percentiles with the line representing the group median. To convert ng/dL to nmol/L, multiply by 0.0347.
We further analyzed the ovarian effluent results in the subset of women predicted to have a tumour based on peripheral testosterone ≥4.51 nmol/L (≥130 ng/dL) (Figure 2). In these women, testosterone >62.46 nmol/L (>1800 ng/dl) in the right ovarian venous effluent identified 14 subjects with a right-sided tumour and misclassified 2 with bilateral pathology (PPV for right-sided tumour: 88%, 95%CI: 62%, 98%). Additionally, all 18 women with right-sided tumours had right-to-left ovarian effluent testosterone ratios ≥1.44, while the same 2 women with bilateral disease were misdiagnosed by this criterion (PPV 90%). Conversely, a right-to-left ovarian ratio of <1.44 identified 12 of 14 women with a left or bilateral lesion. Three of seven women with left-sided tumours had extremely high absolute left ovarian effluent values (>226.59 nmol/L (6530 ng/dL), n=3/7) and very high left-to-right testosterone effluent ratios (>15, n = 3/7). The right and left ovarian venous effluent testosterone values were similar in the other four women with left-sided tumours and the seven with bilateral lesions.
Figure 2.
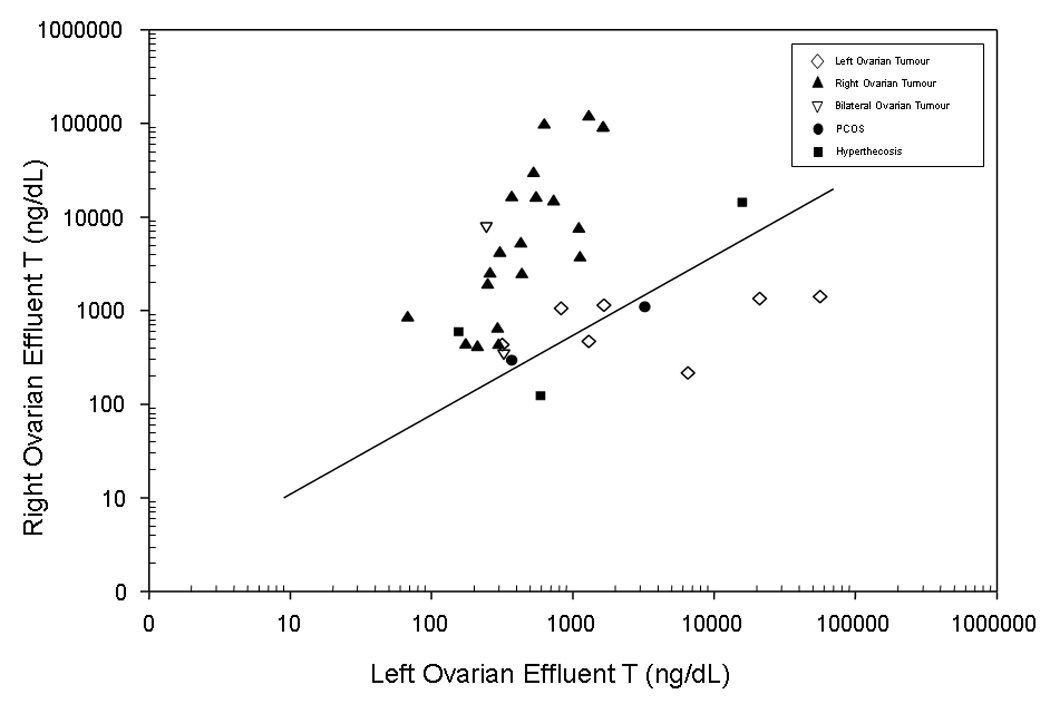
The log base 10 of the right ovarian effluent testosterone (T) concentration and the log base 10 of the left ovarian effluent testosterone (T) concentration for all women with peripheral T≥4.51 nmol/L (≥130 ng/dL) having right, left, or bilateral lesions and available information on both right and left effluent T concentration.
Footnote: The line represents a R:L ratio of 1.44. To convert ng/dL to nmol/L, multiply by 0.0347.
Thus, in women with peripheral testosterone ≥4.51 nmol/L (≥130 ng/dL), a right-to-left ovarian testosterone ratio ≥1.44 correctly identified 90% of right-sided tumours and a right-to-left ovarian testosterone ratio <1.44 correctly identified 86% of 14 women with left-sided or bilateral lesions. If this criterion were combined with the criterion to identify left-sided tumours (left-to-right ovarian testosterone effluent of >15), 66% of women overall would have been correctly categorized.
Discussion
Both ovarian and adrenal tumours may cause hyperandrogenism in women. In contrast to ovarian tumours, adrenal tumours are generally identified easily by imaging techniques.43 As a result, an ovarian source may be suspected when anatomic studies of the adrenal glands are normal.
The study objective was to evaluate the ability of selective ovarian venous effluent sampling to establish the presence of an androgen-producing lesion. In this study, peripheral testosterone concentration alone accurately delineated between tumour and non-tumour causes of hyperandrogenism. Ovarian venous effluents could localize up to 66% of androgen-secreting ovarian tumours. Because of the limited amount of data from stimulated ovarian effluent sampling, we were unable to judge its utility.
Generally, hyperandrogenic women are suspected to have a tumour based on rapid onset of symptoms, the severity of symptoms, and/or their onset after menopause. A peripheral testosterone value of <5.21 nmol/L (<150 ng/dL) has often been cited as a reasonable criterion to discriminate women with benign forms of hyperandrogenism, recognizing that some with PCOS will have higher values. In this study, a peripheral testosterone ≥4.51 nmol/L (≥130 ng/dL) worked well to discriminate women with tumours.
A best-fit model that added peripheral cortisol values to the testosterone criterion improved diagnostic accuracy slightly in the sample of 39 women. However, confidence intervals overlapped (97.6% correctly predicted with cortisol, 95%CI: 87.1 – 99.9% vs. 93.8% with testosterone alone, 95%CI: 85 – 98.2%). We are unable to propose a biologically plausible model to explain this finding. Thus, the utility of this approach requires confirmation in another population, ideally using consistent timing of blood draws. The small improvement in discriminatory capacity from more complicated models did not justify their complexity.
Considering that a peripheral testosterone value ≥4.51 nmol/L (≥130 ng/dL) indicates an increased risk of tumour in this study a right-to-left ovarian testosterone ratio ≥1.44 correctly identified 90% of right-sided tumours and a lower value correctly identified 86% of 14 women with left-sided or bilateral lesions. An additional three women in the latter group had a left-to-right testosterone effluent of >15 and had left sided tumours. Thus ovarian venous sampling may be helpful to localize either a right or left ovarian tumour, recognizing that women with PCOS, hyperthecosis and left sided lesions may occasionally be misdiagnosed.
Based on a series of seven patients, Moltz and colleagues reported that a ovarian gradient of >2.7 correctly identified the location of tumor.6 When applied to this series, this criterion would have a sensitivity of 50%, correctly identifying 13 of 20 women with right sided tumours, and 4 of 7 with left sided tumour while misclassifying 4/7 with bilateral tumours or PCOS.
It is not clear why venous sampling worked better to identify right sided tumours, and why a larger number of tumours were found on the right side. The right ovarian vein enters the inferior vena cava and the left ovarian vein enters the left renal vein. In one series, the right vein was catheterized only 42% of the time, compared to 73% success on the left, but it is not known whether catheter placement can result in dilution of hormonal effluent.42 A small series in post-menopausal women did not find a difference in venous effluent concentrations between the two veins, suggesting that in this setting, values are usually similar, and that catheter placement, as long as it is in the vein, may not be a concern.44 However, as this is a heterogeneous series from various centres, it is possible that differences in catheterization technique and placement may influence the results. Additionally, it has been reported recently that the left ovarian vein may have reflux and drain in some women into the right ovarian vein.45 This might enhance the apparent hormonal concentration in the right ovarian vein, and possibly account for a lack of increased left-to-right values in some patients.
The question of whether selective ovarian effluent venous sampling improves the clinical ability to diagnose and localize an androgen-producing source deserves further consideration. Our results must be interpreted with caution, as our study population is presumably a highly selected one (due to reporting bias). Among cases with an ovarian cause of hyperandrogenism, 47.4% had ovarian tumours responsible for the hirsutism, significantly higher than the proportion of women with tumours in the general population (~0.2%).46 As a result, the estimates of the utility of selective venous sampling may be high. Moreover, the pattern of missing venous sampling data is undoubtedly informative. Therefore, the limited sample size is not only directly related to the rareness of these cases, but also enriched for those most likely to have information available on the factors we modelled.
Other diagnostic strategies have been proposed, and deserve additional evaluation. Among hyperandrogenemic women, the response of plasma androgens and cortisol to 5-days of DEX (1.5–2.0 mg) administration using daily divided doses has been reported to aid in distinguishing functional ovarian causes of hyperandrogenism from other causes.47 While provocative testing as part of ovarian venous effluent sampling has been employed with variable success, there remains insufficient data regarding its utility on the prognostic capacity of venous effluent sampling. Furthermore, the possibility remains that further advances in radiologic imaging may obviate selective venous effluent sampling in the future.
In conclusion, a peripheral testosterone value ≥4.51 nmol/L (≥130 ng/dl) increases the probability of tumour in the appropriate clinical context. When diagnostic uncertainty exists, as when imaging is unrevealing, selective venous sampling may be useful to localize a tumour, recognizing that it will not always establish the laterality of a lesion.
Acknowledgements
Drs. Levens and Whitcomb contributed equally towards this work. This research was supported, in part, by the Program in Reproductive and Adult Endocrinology and the Epidemiology Branch, NICHD, NIH, Bethesda, MD.
Footnotes
Competing Interests: None declared.
References
- 1.Taylor L, Ayers JW, Gross MD, Peterson EP, Menon KM. Diagnostic considerations in virilization: iodomethyl-norcholesterol scanning in the localization of androgen secreting tumors. Fertility and Sterility. 1986;46:1005–1010. [PubMed] [Google Scholar]
- 2.Stephens JW, Katz JR, McDermott N, MacLean AB, Bouloux PM. An unusual steroid-producing ovarian tumour: case report. Human Reproduction. 2002;17:1468–1471. doi: 10.1093/humrep/17.6.1468. [DOI] [PubMed] [Google Scholar]
- 3.Wentz AC, White RI, Jr, Migeon CJ, Hsu TH, Barnes HV, Jones GS. Differential ovarian and adrenal vein catheterization. American Journal of Obstetrics and Gynecology. 1976;125:1000–1007. doi: 10.1016/0002-9378(76)90504-4. [DOI] [PubMed] [Google Scholar]
- 4.Kirschner MA, Jacobs JB. Combined ovarian and adrenal vein catheterization to determine the site(s) of androgen overproduction in hirsute women. Journal of Clinical Endocrinology and Metabolism. 1971;33:199–209. doi: 10.1210/jcem-33-2-199. [DOI] [PubMed] [Google Scholar]
- 5.Surrey ES, de Ziegler D, Gambone JC, Judd HL. Preoperative localization of androgen-secreting tumors: clinical, endocrinologic, and radiologic evaluation of ten patients. American Journal of Obstetrics and Gynecology. 1988;158:1313–1322. doi: 10.1016/0002-9378(88)90362-6. [DOI] [PubMed] [Google Scholar]
- 6.Moltz L, Pickartz H, Sorensen R, Schwartz U, Hammerstein J. Ovarian and adrenal vein steroids in seven patients with androgen-secreting ovarian neoplasms: selective catheterization findings. Fertility and Sterility. 1984;42:585–593. doi: 10.1016/s0015-0282(16)48143-4. [DOI] [PubMed] [Google Scholar]
- 7.Sorensen R, Moltz L, Schwartz U. Technical difficulties of selective venous blood sampling in the differential diagnosis of female hyperandrogenism. Cardiovascular and Interventional Radiology. 1986;9:75–82. doi: 10.1007/BF02577904. [DOI] [PubMed] [Google Scholar]
- 8.Vuento MH, Pirhonen JP, Makinen JI, Laippala PJ, Gronroos M, Salmi TA. Evaluation of ovarian findings in asymptomatic postmenopausal women with color Doppler ultrasound. Cancer. 1995;76:1214–1218. doi: 10.1002/1097-0142(19951001)76:7<1214::aid-cncr2820760718>3.0.co;2-5. [DOI] [PubMed] [Google Scholar]
- 9.Buzi F, Pilotta A, Dordoni D, Lombardi A, Zaglio S, Adlard P. Pelvic ultrasonography in normal girls and in girls with pubertal precocity. Acta Paediatrica. 1998;87:1138–1145. doi: 10.1080/080352598750031121. [DOI] [PubMed] [Google Scholar]
- 10.Aleem FA, Spenillo AR, Oberlander S, Surks MI. Hilar cell tumor of the ovary: preoperative localization by selective retrograde venous sampling. Obstetrics and Gynecology. 1980;56:99–102. [PubMed] [Google Scholar]
- 11.Judd HL, Spore WW, Talner LB, Rigg LA, Yen SS, Benirschke K. Preoperative localization of a testosterone-secreting ovarian tumor by retrograde venous catheterization and selective sampling. American Journal of Obstetrics and Gynecology. 1974;120:91–96. doi: 10.1016/0002-9378(74)90184-7. [DOI] [PubMed] [Google Scholar]
- 12.Parker CR, Jr, Bruneteau DW, Greenblatt RB, Mahesh VB. Peripheral, ovarian, and adrenal vein steroids in hirsute women: acute effects of human chorionic gonadotropin and adrenocorticotrophic hormone. Fertility and Sterility. 1975;26:877–888. [PubMed] [Google Scholar]
- 13.Casthely S, Diamandis HP, Pierre-Louis R. Hilar cell tumor of the ovary: diagnostic value of plasma testosterone by selective ovarian vein catheterization. American Journal of Obstetrics and Gynecology. 1977;129:108–110. doi: 10.1016/0002-9378(77)90828-6. [DOI] [PubMed] [Google Scholar]
- 14.Katz M, Hamilton SM, Albertyn L, Pimstone BL, Cohen BL, Tiltman AJ. Virilization with diffuse involvement of ovarian androgen secreting cells. Obstetrics and Gynecology. 1977;50:623–627. [PubMed] [Google Scholar]
- 15.Muechler EK, Grove S, Kohler D. Steroid hormones in ovarian vein and cyst fluid of a virilizing stromal tumor. Obstetrics and Gynecology. 1978;52:609–612. [PubMed] [Google Scholar]
- 16.Soules MR, Abraham GE, Bossen EH. The steroid profile of a virilizing ovarian tumor. Obstetrics and Gynecology. 1978;52:73–78. [PubMed] [Google Scholar]
- 17.Baranetsky NG, Zipser RD, Goebelsmann U, Kurman RJ, March CM, Morimoto I, Stanczyk FZ. Adrenocorticotropin-dependent virilizing paraovarian tumors in Nelson's syndrome. Journal of Clinical Endocrinology and Metabolism. 1979;49:381–386. doi: 10.1210/jcem-49-3-381. [DOI] [PubMed] [Google Scholar]
- 18.Check JH, Nowroozi K, Rakoff AE, Logue J. Detection of an estrogen-suppressible lipoid cell ovarian neoplasm by bilateral ovarian venous sampling. American Journal of Obstetrics and Gynecology. 1979;133:457–458. [PubMed] [Google Scholar]
- 19.Meldrum DR, Abraham GE. Peripheral and ovarian venous concentrations of various steroid hormones in virilizing ovarian tumors. Obstetrics and Gynecology. 1979;53:36–43. [PubMed] [Google Scholar]
- 20.Tzingounis VA, Aksu MF, Natrajan PK, Greenblatt RB. The significance of adrenal and ovarian catheterization in patients with polycystic ovary syndrome. International Journal of Gynaecology and Obstetrics. 1978;17:78–82. doi: 10.1002/j.1879-3479.1979.tb00120.x. [DOI] [PubMed] [Google Scholar]
- 21.Henriksen HM, Fischer S, Guttorm E. Bilateral ovarian lipid cell hyperplasia in a young hirsute patient. International Journal of Gynaecology and Obstetrics. 1981;19:467–472. doi: 10.1016/0020-7292(81)90006-0. [DOI] [PubMed] [Google Scholar]
- 22.Imperato-McGinley J, Peterson RE, Dawood MY, Zullo M, Kramer E, Saxena BB, Arthur A, Huang T. Steroid hormone secretion from a virilizing lipoid cell tumor of the ovary. Obstetrics and Gynecology. 1981;57:525–531. [PubMed] [Google Scholar]
- 23.Wajchenberg BL, Achando SS, Okada H, Czeresnia CE, Peixoto S, Lima SS, Goldman J. Determination of the source(s) of androgen overproduction in hirsutism associated with polycystic ovary syndrome by simultaneous adrenal and ovarian venous catheterization. Comparison with the dexamethasone suppression test. Journal of Clinical Endocrinology and Metabolism. 1986;63:1204–1210. doi: 10.1210/jcem-63-5-1204. [DOI] [PubMed] [Google Scholar]
- 24.van Heyningen C, MacFarlane IA, Diver MJ, Muronda C, Tuffnell D. Virilization due to ovarian hyperthecosis in a postmenopausal woman. Gynecological Endocrinology. 1988;2:331–338. doi: 10.3109/09513598809107656. [DOI] [PubMed] [Google Scholar]
- 25.Ohashi M, Hasegawa Y, Haji M, Igarashi M, Nawata H. Production of immunoreactive inhibin by a virilizing ovarian tumour (Sertoli-Leydig tumour) Clinical Endocrinology. 1990;33:613–618. doi: 10.1111/j.1365-2265.1990.tb03899.x. [DOI] [PubMed] [Google Scholar]
- 26.Bricaire C, Raynaud A, Benotmane A, Clair F, Paniel B, Mowszowicz I, Wright F, Moreau JF, Kuttenn F, Mauvais-Jarvis P. Selective venous catheterization in the evaluation of hyperandrogenism. Journal of Endocrinological Investigation. 1991;14:949–956. doi: 10.1007/BF03347121. [DOI] [PubMed] [Google Scholar]
- 27.DeFreitas EA, Dudzinski MR, LaRocque JC, Coddington CC. Ovarian vein sampling in rapidly progressing virilization. A case report. Journal of Reproductive Medicine. 1991;36:546–548. [PubMed] [Google Scholar]
- 28.Cohen I, Cuperman S, Altaras MM, Ben-Nun I, Goldberg E, Beyth Y. Combined ovarian vein catheterization with ovarian stimulation in the diagnosis of androgen overproduction. Acta Obstetricia et Gynecologica Scandinavica. 1992;71:245–248. doi: 10.3109/00016349209009929. [DOI] [PubMed] [Google Scholar]
- 29.Cohen I, Shapira M, Cuperman S, Goldberger S, Siegal A, Altaras M, Beyth Y. Direct in-vivo detection of atypical hormonal expression of a Sertoli-Leydig cell tumour following stimulation with human chorionic gonadotrophin. Clinical Endocrinology. 1993;39:491–495. doi: 10.1111/j.1365-2265.1993.tb02399.x. [DOI] [PubMed] [Google Scholar]
- 30.Azizlerli H, Tanakol R, Terzioglu T, Alagol F, Dizdaroglu F. Steroid cell tumor of the ovary as a rare cause of virilization. Mount Sinai Journal of Medicine. 1997;64:130–135. [PubMed] [Google Scholar]
- 31.Loh KC, Lo JC, Zaloudek CJ, Fitzgerald PA. Occult virilizing ovarian tumours in postmenopausal women: problems in evaluation with reference to a case. Annals of the Academy of Medicine, Singapore. 1998;27:712–716. [PubMed] [Google Scholar]
- 32.Inoue Y, Kamura T, Okuma A, Shigematsu T, Amada S, Ogata R, Koga M, Nozaki M, Nakano H. Efficacy of selective venous sampling to localize a small ovarian androgen-producing tumor. Journal of Obstetrics and Gynaecology Research. 1999;25:231–236. doi: 10.1111/j.1447-0756.1999.tb01154.x. [DOI] [PubMed] [Google Scholar]
- 33.Cserepes E, Szucs N, Patkos P, Csapo Z, Molnar F, Toth M, Dabasi G, Esik O, Racz K. Ovarian steroid cell tumor and a contralateral ovarian thecoma in a postmenopausal woman with severe hyperandrogenism. Gynecological Endocrinology. 2002;16:213–216. [PubMed] [Google Scholar]
- 34.Gorgojo JJ, Almodovar F, Lopez E, Vicente del Cerro J, Tejerina E, Donnay S. Coincidental diagnosis of an occult hilar steroid cell tumor of the ovary and a cortisol-secreting adrenal adenoma in a 49-year-old woman with severe hyperandrogenism. Fertility and Sterility. 2003;80:1504–1507. doi: 10.1016/j.fertnstert.2003.05.014. [DOI] [PubMed] [Google Scholar]
- 35.Kim Y, Marjoniemi VM, Diamond T, Lim A, Davis G, Murrell D. Androgenetic alopecia in a postmenopausal woman as a result of ovarian hyperthecosis. Australasian Journal of Dermatology. 2003;44:62–66. doi: 10.1046/j.1440-0960.2003.00640.x. [DOI] [PubMed] [Google Scholar]
- 36.White LC, Buchanan KD, O'Leary TD, Carlan SJ, Boothby R. Direct laparoscopic venous sampling to diagnose a small Sertoli-Leydig tumor. Gynecologic Oncology. 2003;91:254–257. doi: 10.1016/s0090-8258(03)00405-0. [DOI] [PubMed] [Google Scholar]
- 37.Bohlmann MK, Rabe T, Sinn HP, Strowitzki T, Von Wolff M. Intraoperative venous blood sampling to localize a small androgen-producing ovarian tumor. Gynecological Endocrinology. 2005;21:138–141. doi: 10.1080/09513590500223970. [DOI] [PubMed] [Google Scholar]
- 38.Dickerson RD, Putman MJ, Black ME, Pinto KR, Diamond NG, Marynick S, Pinto AB. Selective ovarian vein sampling to localize a Leydig cell tumor. Fertility and Sterility. 2005;84:218. doi: 10.1016/j.fertnstert.2004.12.055. [DOI] [PubMed] [Google Scholar]
- 39.Nardo LG, Ray DW, Laing I, Williams C, McVey RJ, Seif MW. Ovarian Leydig cell tumor in a peri-menopausal woman with severe hyperandrogenism and virilization. Gynecological Endocrinology. 2005;21:238–241. doi: 10.1080/09513590500369005. [DOI] [PubMed] [Google Scholar]
- 40.Nishiyama S, Hirota Y, Udagawa Y, Kato R, Hayakawa N, Tukada K. Efficacy of selective venous catheterization in localizing a small androgen-producing tumor in ovary. Medical Science Monitor. 2008;14:CS9–CS12. [PubMed] [Google Scholar]
- 41.Matuszczyk A, Petersenn S, Lahner H, Haude M, Veit P, Becker JU, Kimmig R, Bockisch A, Mann K. [Leydig cell tumor as a cause of hirsutism in a postmenopausal woman] Medizinische Klinik. 2007;102:259–262. doi: 10.1007/s00063-007-1032-5. [DOI] [PubMed] [Google Scholar]
- 42.Kaltsas GA, Mukherjee JJ, Kola B, Isidori AM, Hanson JA, Dacie JE, Reznek R, Monson JP, Grossman AB. Is ovarian and adrenal venous catheterization and sampling helpful in the investigation of hyperandrogenic women? Clinical Endocrinology. 2003;59:34–43. doi: 10.1046/j.1365-2265.2003.01792.x. [DOI] [PubMed] [Google Scholar]
- 43.Heinz-Peer G, Memarsadeghi M, Niederle B. Imaging of adrenal masses. Current Opinion in Urology. 2007;17:32–38. doi: 10.1097/MOU.0b013e328011ea00. [DOI] [PubMed] [Google Scholar]
- 44.Fogle RH, Stanczyk FZ, Zhang X, Paulson RJ. Ovarian androgen production in postmenopausal women. Journal of Clinical Endocrinology and Metabolism. 2007;92:3040–3043. doi: 10.1210/jc.2007-0581. [DOI] [PubMed] [Google Scholar]
- 45.Hiromura T, Nishioka T, Nishioka S, Ikeda H, Tomita K. Reflux in the left ovarian vein: analysis of MDCT findings in asymptomatic women. American Journal of Roentgenology. 2004;183:1411–1415. doi: 10.2214/ajr.183.5.1831411. [DOI] [PubMed] [Google Scholar]
- 46.Azziz R, Sanchez LA, Knochenhauer ES, Moran C, Lazenby J, Stephens KC, Taylor K, Boots LR. Androgen excess in women: experience with over 1000 consecutive patients. Journal of Clinical Endocrinology and Metabolism. 2004;89:453–462. doi: 10.1210/jc.2003-031122. [DOI] [PubMed] [Google Scholar]
- 47.Ehrmann DA, Rosenfield RL. Clinical review 10: An endocrinologic approach to the patient with hirsutism. Journal of Clinical Endocrinology and Metabolism. 1990;71:1–4. doi: 10.1210/jcem-71-1-1. [DOI] [PubMed] [Google Scholar]