

Abstract
Purpose:
Timely and accurate diagnosis of pancreatic adenocarcinoma (PA) is hampered by the lack of effective circulating biomarkers. No single test has emerged that improves upon the commonly used biomarker, cancer antigen 19-9 (CA 19-9) to effectively discriminate PA from benign conditions. The goals of this study were to validate two acute phase proteins, haptoglobin and serum amyloid A (SAA), as biomarkers for PA and determine if the combination of haptoglobin, SAA and CA 19-9 would improve PA diagnosis over CA 19-9 alone.
Methods
Levels of haptoglobin, SAA and CA 19-9 were measured in pre-treatment sera from 75 PA patients, 32 patients with chronic pancreatitis, 42 patients with other benign pancreatic disease or biliary stricture and 150 healthy control subjects by ELISA or colorimetric binding assay. Relative levels of haptoglobin or SAA were compared between groups using ANOVA. The diagnostic accuracy of serum haptoglobin and SAA levels were investigated using receiver operating characteristics analysis. Using classification tree analysis, an algorithm was developed that used haptoglobin, SAA and CA 19-9 in a panel diagnostic screen.
Results
Both haptoglobin and SAA were significantly elevated in sera from PA patients compared to healthy control subjects (P < 0.0001) and patients with chronic pancreatitis (P = 0.01). Haptoglobin was significantly elevated in sera from PA patients relative to patients with other benign diseases (P = 0.0015), whereas SAA fell short of significance in the same comparison (P = 0.0508). Receiver operating characteristic analysis indicated that haptoglobin (AUC = 0.792) was a better diagnostic marker than SAA (AUC = 0.691) over multiple threshold cutoffs. Using specific cutoffs that minimized overall misclassification, haptoglobin yielded a sensitivity of 82.7 % and a specificity of 71.1% and SAA yielded a sensitivity of 34.7% and 90.2% specificity when discriminating PA cases from all non-PA controls. In the same sample set, CA 19-9 yielded a sensitivity of 77.3% and a specificity of 91.1%. Combining data from haptoglobin, SAA and CA 19-9 in a panel diagnostic screen improved overall accuracy over CA 19-9 alone yielding a sensitivity of 81.3% and a specificity of 95.5%.
Conclusions
These data demonstrate that haptoglobin and SAA are useful in discriminating PA from benign conditions as well as healthy controls when used in a panel diagnostic screen. This study supports the use of combined biomarkers for improved accuracy in the diagnosis of PA.
Introduction
Adenocarcinoma of the pancreas is the fourth most common cause of cancer deaths in both men and women in the United States. The 5-year survival rate is about 4%, which is the lowest of any cancer. Median survival is six months. It is estimated that 37,680 new cases and 34,290 deaths will be attributable to pancreatic adenocarcinoma (PA) in 2008 [1]. The high mortality rate is largely due to the typically advanced stage of the cancer at the time of diagnosis and treatment. Resection is the only current treatment resulting in cure for PA. However, due to initiation and progression of cancer without symptoms, only about 10 to 15% of patients present with localized disease amenable to potentially curative resection. An accurate, minimally invasive blood test that could be routinely employed to screen for PA would possibly increase detection at a stage amenable to resection and improve survival rates. CA 19-9 is the marker most widely used clinically, but falls short of the desired characteristics for diagnosis of PA. CA 19-9 is elevated in approximately 75% of patients with PA [2,3] with reported sensitivities ranging from 70% - 90% and specificities ranging from 68-91% [4]. However, patients with tumors smaller than 2 cm may have undetectable levels of CA 19-9 and it is estimated that 15% of the population cannot synthesize the CA 19-9 antigen. CA 19-9 is also elevated in patients with chronic pancreatitis and jaundiced patients including those with nonmalignant causes of biliary obstruction [5,6]. For these reasons, CA 19-9 is generally employed to monitor PA disease progression and response to therapy in individual cases rather than as a diagnostic tool.
Improved diagnostic accuracy over CA 19-9 alone and the ability to discriminate between PA and pancreatitis have become the minimal benchmarks for validation of novel serum biomarkers. The ability to distinguish pancreatitis from PA is a persistent clinical challenge since both conditions can present with similar symptoms and share radiographic characteristics. Histologically, both chronic pancreatitis and PA are characterized by fibrosis and desmoplasia. Furthermore, the pancreatic duct obstruction common in PA often leads to an accompanying chronic pancreatitis, confounding diagnosis by fine needle aspiration biopsy. For patients who present with suspicion of PA, accurate diagnosis is important to avoid unnecessary and potentially morbid treatment triggered by false positive studies.
Recent studies have identified several promising candidate PA serum biomarkers that successfully discriminated between PA and healthy control subjects [7-15], although no individual marker improved upon CA 19-9 and effectively discriminated benign conditions. We hypothesize that combinations of markers in a panel screen may have increased power to accurately diagnose PA over any single marker alone. Single markers may correctly identify a subset of PA subjects, perhaps correlating with a specific functional consequence of the individual development of the tumor, whereas other markers might identify another, overlapping subset. With sufficient overlap, a panel of markers may provide increased accuracy over the individual markers. This idea is supported by a study in which a panel screen of three markers, CA 19-9, carcinoembyonic antigen, and TIMP1, improved diagnostic accuracy compared to the individual markers [16].
Serum levels of the acute phase proteins haptoglobin and serum amyloid A (SAA) are elevated in various malignancies [17-25] including PA [26-29]. The goals of this project were to investigate the potential clinical utility of haptoglobin and SAA for detecting PA and to assess the relative accuracy of haptoglobin, SAA and CA 19-9 when applied in a panel screen in distinguishing those patients with PA from patients with benign conditions and healthy control subjects.
Materials and methods
Study participants
Consecutive cases with periampullary disease referred for suspicion of PA and possible surgical resection were approached for enlistment over a two year period. Cases with confirmed diagnosis of pancreatic adenocarcinoma were used for this study. The diagnosis was considered confirmed only if verified histologically from surgical specimens or cytological evaluations of fine needle biopsies. Other cases with benign conditions (chronic pancreatitis, benign pancreatic neoplasm, serous cystadenoma, and benign biliary stricture) were included in this study as controls. Additional age and gender matched controls were obtained from two sources. First family members of the index patients were approached and screened. Those with confounding co-morbidities were excluded. In addition, excess sera from de-identified healthy controls were obtained from a large reference laboratory managed by the University of Utah Department of Pathology. Sample numbers and participant characteristics are shown in Table 1. The University of Utah Institutional Review Board approved all protocols and experiments.
Table 1.
Study participants
| Participant Class | Sample Size | Median Age (Range) | |
|---|---|---|---|
| Pancreatic Adenocarcinoma | |||
| Total | 75 | 69 (48-92) | |
| Female | 29 | 76 (52-94) | |
| Male | 46 | 65 (48-92) | |
| Stage IA | 1 | ||
| Stage IB | 3 | ||
| Stage IIA | 7 | ||
| Stage IIB | 24 | ||
| Stage III | 17 | ||
| Stage IV | 23 | ||
| Healthy Control | |||
| Total | 150 | 66 (30-94) | |
| Female | 58 | 65.5 (52-94) | |
| Male | 92 | 66.5 (30-91) | |
| Chronic Pancreatitis | |||
| Total | 32 | 50 (32-77) | |
| Female | 15 | 50 (34-63) | |
| Male | 17 | 47 (32-77) | |
| Benign Neoplasm and Periampullary Lesions |
|||
| Total | 42 | 70.5 (41-91) | |
| Female | 22 | 70 (41-84) | |
| Male | 20 | 71.5 (49-91) | |
| intraductal papillary mucinous tumor | 13 | ||
| mucinous cystic neoplasm | 12 | ||
| neuroendocrine tumor | 5 | ||
| serous cystadenoma | 4 | ||
| cystic neuroendocrine neoplasm | 3 | ||
| bile duct stricture | 3 | ||
| solid-cystic papillary neoplasm | 2 |
Serum marker determination
Approximately 6 ml of whole blood was collected in a red cap (no additive) blood collection tube (BD Vacutainer Systems, Franklin Lakes, NJ). Blood was allowed to clot at room temperature for 45 minutes and the serum separated by centrifugation at 3000 × g for 10 minutes. Serum was aspirated, aliquoted into cryotubes, and stored at −80°C until used for assays. Haptoglobin was determined using a 96-well format colorimetric assay (Haptoglobin Assay Kit, BioSource International, Camarillo, CA) that takes advantage of the peroxidase activity of heme at low pH when hemoglobin is bound to haptoglobin. Enzyme-linked immunosorbent assay kits were used to measure SAA (BioSource International, Camarillo, CA) and CA 19-9 (Diagnostic Automation, Calabasas, CA). All three assays were performed according to the manufacturers' recommendations. Samples that fell outside the linear detection range of the standard curves were diluted and re-measured. Both the haptoglobin and SAA kits were non-specific in that they measured the total amount of each protein present rather than subtypes. Serum total bilirubin levels were abstracted from patient charts.
Data analysis
Comparisons of serum haptoglobin and SAA levels between groups were performed using ANOVA. We additionally used linear models to test the possible interaction of age, gender, and serum marker levels as predictors. Subsequent logistic regression models were developed using PA as the response and serum marker levels as the predictors in order to identify odds ratios for the diagnosis of PA. These models were adjusted for age and gender as necessary. Receiver operating characteristic (ROC) analysis was used to investigate the sensitivity and specificity of haptoglobin and SAA as separate diagnostic tests for PA. Optimal cutoffs for individual or combined markers that minimized misclassification were determined using classification tree analysis. For combined marker analyses, classification trees were limited to a single threshold cutoff for each marker. Survival analysis was performed using a Cox model and logrank tests using both the marker cut at the median and continuous marker levels as predictors. StatXact (Cytel, Cambridge, MA) or Statistica (StatSoft Inc., Tulsa, OK) software were used for statistical analyses. ROC and classification tree analyses were carried out using programs in the R programming environment (http://www.R-project.org).
Results
Serum levels of haptoglobin and SAA were determined in pretreatment samples from 75 subjects with confirmed PA, 32 patients with chronic pancreatitis, 42 patients with other benign disease (benign pancreatic neoplasm, serous cystadenoma or benign biliary stricture), and 150 healthy control subjects. Healthy control subjects were chosen such that two gender-matched and age-approximated cases were measured for each PA case. Characteristics of the study participants are presented in Table 1.
Both haptoglobin and SAA were significantly elevated in serum from PA subjects (Fig. 1). Haptoglobin (Fig. 1A) was significantly elevated in serum of PA subjects relative to serum from healthy controls (P < 0.0001), serum from chronic pancreatitis subjects (P = 0.0102) and serum from patients with other benign disorders (P = 0.0015). Serum haptoglobin levels were significantly higher in PA subjects with locally advanced or metastatic disease relative to PA subjects with disease localized to the pancreas (P = 0.003, data not shown) suggesting that serum haptoglobin levels increased with increasing tumor burden. Logistic regression models, adjusting for age and gender, revealed that the odds that haptoglobin predicts PA versus non-cancer controls were increased 6.2-fold for a one standard deviation increase in haptoglobin (P < 0.0001). SAA (Fig. 1B) was significantly elevated in serum of PA subjects relative to both normal control serum (P < 0.0001) and serum from chronic pancreatitis subjects (P = 0.0109) and approached significance compared to cases with other benign disorders (P = 0.0508). Serum SAA levels were not significantly different in PA subjects with localized vs. advanced disease (data not shown). A one standard deviation increase in log SAA levels was associated with a 3.6-fold increase in the odds of PA in age and gender corrected logistic regression model (P < 0.0001).
Fig. 1.
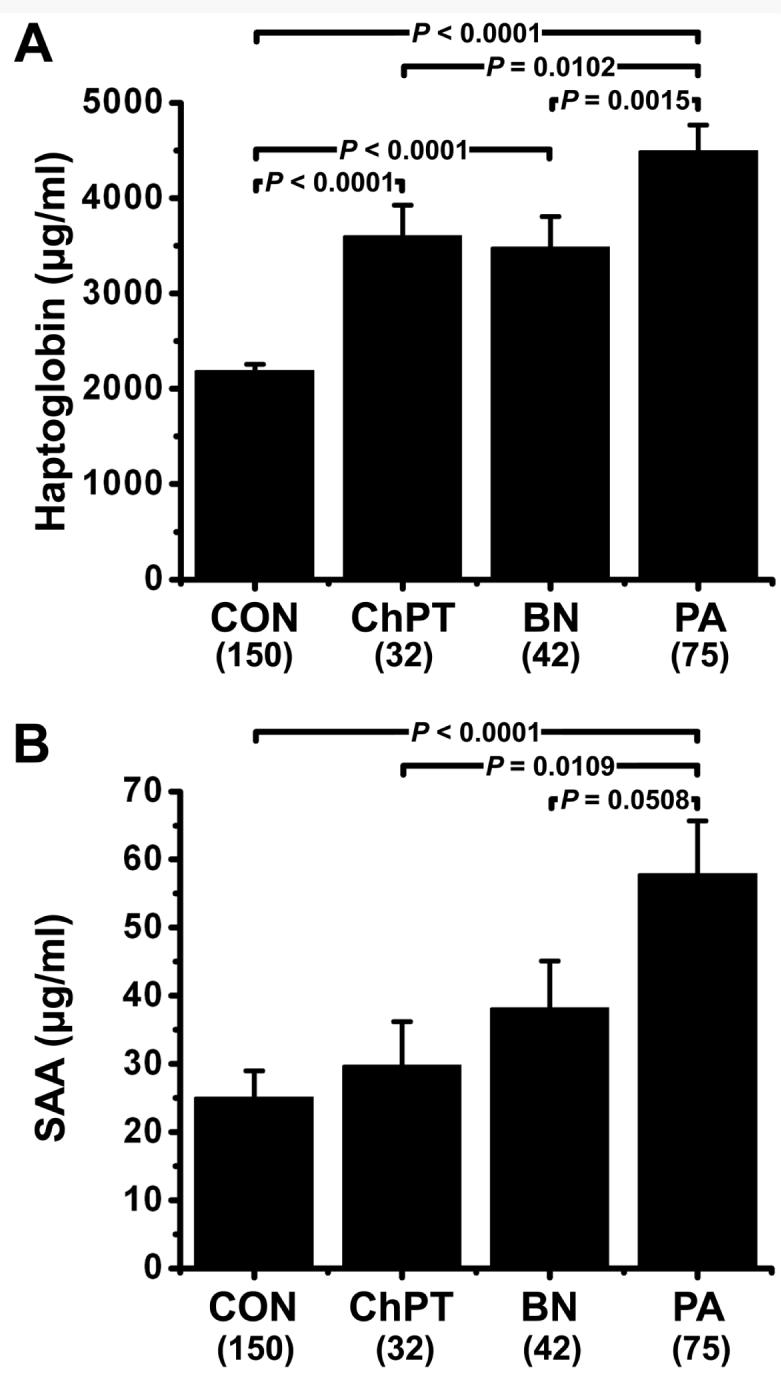
Serum marker levels. Haptoglobin (A) and serum amyloid A (B) levels were determined in serum from healthy control subjects (CON, N = 150), patients with chronic pancreatitis (ChPT, N = 32), patients with benign neoplasm or other periampullary lesions (BN, N = 42), and pretreatment samples from patients with cytologically confirmed pancreatic adenocarcinoma (PA, N = 75). Statistical comparisons were made by ANOVA and Fisher's PLSD post-hoc tests. Data is reported as mean ± SEM.
Pretreatment serum haptoglobin and SAA levels did not significantly correlate with survival in PA subjects, although a trend towards significance was noted in which increased SAA associated with decreased survival (data not shown). Since pancreatic cancer is often associated with jaundice, we also examined the possibility that bilirubin levels could explain increased serum marker levels in PA subjects. Linear regression models revealed no apparent relationship between bilirubin and haptoglobin (P = 0.356) or SAA (P = 0.731) serum levels in pretreatment samples.
Receiver Operating Characteristic curve (ROC) analyses were used to investigate the sensitivity and specificity of haptoglobin and SAA as separate diagnostic tests for PA. Fig. 2 depicts haptoglobin and SAA ROC curves for the discrimination of PA subjects prior to treatment (true positive cases) and non-PA control subjects, including normal control, chronic pancreatitis, benign neoplasms and cases with other benign periampullary lesions (true negative cases). ROC analysis estimates a curve, which describes the inherent tradeoff between sensitivity and specificity of a diagnostic test. Each point on the ROC curve is associated with a specific diagnostic criterion. If two ROC curves do not cross, then the diagnostic test corresponding to the higher of the two curves is uniformly better than the diagnostic test corresponding to the lower of the two curves, no matter what “cutoff” is chosen. The situation is more ambiguous if the ROC curves cross, as is the case for haptoglobin and SAA (Fig. 2). The area under the ROC curve (AUC) may be regarded as an average of the sensitivity over all possible specificities. The diagnostic measure with the higher AUC is therefore typically regarded as better. Thus, haptoglobin (AUC = 0.792) had greater accuracy than SAA (AUC = 0.691) over all possible cutoffs. Using classification tree analysis, single cutoffs were identified for haptoglobin (2687 μg/ml) and SAA (67.745 μg/ml) that minimized overall misclassification. These cutoffs yielded a sensitivity of 82.7 % and a specificity of 71.1% for haptoglobin and a sensitivity of 34.7% and 90.2% specificity for SAA when considering PA as true positive cases and all non-PA controls as true negative cases.
Fig. 2.

Receiver operator characteristic curves for diagnosis of pancreatic adenocarcinoma versus non-cancer cases. Curves demonstrate the relative accuracy for the individual serum haptoglobin or SAA levels to discriminate between PA and control cases. Serum levels of healthy control subjects (N = 150), patients with chronic pancreatitis (N = 32), and patients with benign neoplasm or other periampullary lesions (N = 42) were considered true negative cases, whereas serum levels of pretreatment samples from patients with cytologically confirmed pancreatic adenocarcinoma (N = 75) were considered true positive cases. AUC = area under curve.
As individual markers, haptoglobin and SAA were less accurate than CA 19-9 for diagnosing PA versus non-cancer controls. However, at the commonly used cutoff of 37 U/ml, CA 19-9 still misclassified 37 of 299 cases examined (see Table 2). We examined the possibility that combining haptoglobin and SAA with CA 19-9 in a panel diagnostic screen could improve classification. Haptoglobin, SAA and CA 19-9 serum levels from PA patients (true positive cases) and patients with chronic pancreatitis, benign neoplasms or other benign periampullary lesions (true negative cases) were used in a classification tree analysis with the stipulation that each marker be used only once. Marker levels from healthy controls were excluded from this tree analysis as these cases are much less likely to present with suspicion of PA. Thus, the resulting tree (Fig. 3) represents an algorithm for distinguishing PA from the benign conditions. The accuracy of this algorithm for distinguishing PA from the individual classes as well as from all controls as a group is shown in Table 2. In each case the panel screen incorporating information from all three markers improved overall diagnostic accuracy over CA 19-9 alone. Except for the chronic pancreatitis group, the panel screen improved both sensitivity and specificity for discriminating PA from control groups.
Table 2.
Diagnostic accuracy of the haptoglobin/SAA/CA 19-9 panel screen. Data presented as percentage. The number of accurate determinations of PA (sensitivity) or control (for specificity) per total possible cases is given in parentheses. For misclassification error rate, the total number of inaccurate determinations per total number of cases examined is given in parentheses.
| Haptoglobin/SAA/CA 19-9 | |||
|---|---|---|---|
| CA 19-9a | Panelb | ||
| PA vs. Benign Neoplasm Controls | |||
| Sensitivity | 77.3 (58/75) | 81.3 (61/75) | |
| Specificity | 76.2 (32/42) | 88.1 (37/42) | |
| Misclassification Error Rate | 23.1 (27/117) | 16.2 (19/117) | |
| PA vs. Chronic Pancreatitis Controls | |||
| Sensitivity | 77.3 (58/75) | 81.3 (61/75) | |
| Specificity | 93.8 (30/32) | 90.6 (29/32) | |
| Misclassification Error Rate | 17.8 (19/107) | 15.9 (17/107) | |
| PA vs. Healthy Controls | |||
| Sensitivity | 77.3 (58/75) | 81.3 (61/75) | |
| Specificity | 94.7 (142/150) | 98.7 (148/150) | |
| Misclassification Error Rate | 11.1 (25/225) | 7.1 (16/225) | |
| PA vs. Combined Controls | |||
| Sensitivity | 77.3 (58/75) | 81.3 (61/75) | |
| Specificity | 91.1 (204/224) | 95.5 (214/224) | |
| Misclassification Error Rate | 12.4 (37/299) | 8.0 (24/299) | |
Threshold cutoff of 37 U/ml.
Panel algorithm derived by classification tree analysis using serum from benign neoplasm and chronic pancreatitis cases as true negatives (Fig. 3).
Fig. 3.

Classification tree for discrimination of pancreatic adenocarcinoma (PA, N = 75) from chronic pancreatitis, benign neoplasm or other periampullary lesions (CON, N = 74). Healthy control cases were excluded from this analysis. The tree depicts an algorithm derived to minimize misclassification when all three markers were considered. The specific threshold cutoffs used in the algorithm for the individual markers are given in parentheses.
Discussion
Accurate diagnostic and prognostic biomarkers for PA could improve outcomes through early detection, selection of appropriate treatment strategies, monitoring intervention efficacy, and surveillance of groups at high-risk for developing PA. Despite multiple reports of candidate biomarkers, none have emerged that improve upon existing markers. It is tempting to speculate that the lack of a single marker that can be applied to all PA case might be due to the multiple mutation combinations that contribute to the transformed phenotype in the context of various environmental and genetic effectors. Since the complement of proteins and antigens produced by tumor cells would reflect the specific altered program resulting from various mutation combinations, a single common marker may be unlikely. Individual markers may correctly identify a subset of PA cases, but appear to have insufficient specificity and sensitivity when applied to aggregate data sets. Overlapping classification capabilities of individual markers, when combined in a panel screen, could provide increased accuracy over the individual markers. This idea is supported by the fact that several markers [10,12,16], including SAA [27], successfully identified PA cases that were misclassified by CA 19-9 alone. Similarly, in the data presented here, haptoglobin and SAA correctly identified cases that were misidentified by CA 19-9. Furthermore, the combination of all three markers in a panel screen resulted in further accuracy improvements (Table 2). These results suggest that more accurate screens can be developed from the combination of markers.
Both haptoglobin and serum amyloid A are acute-phase proteins whose concentrations increase during the acute phase response to inflammation and tissue injury. It is generally accepted that the major function of haptoglobin is the clearance of free plasma hemoglobin [30,31], however, haptoglobin has also been shown to have angiogenic [32] and antioxidant [33] properties and is an essential factor for cell migration [34]. Several functions have been proposed for SAA including lipid metabolism and transport, induction of extracellular matrix degrading enzymes and recruitment of inflammatory cells to sites of inflammation [36]. Although synthesized mainly in the liver, local differential expression of haptoglobin and serum amyloid A has been demonstrated in cancer tissues [36-38]. Expression in cancer cells as well as potential roles in angiogenesis, cell migration and extracellular matrix remodeling suggests that haptoglobin and SAA may directly contribute to tumorigenesis.
Previous studies have shown that haptoglobin and SAA are elevated in PA and other cancers [17-29]. It is not clear if the tumor contributes to elevated serum levels, but it seems likely that a sustained acute phase response to tumor induced injury is the main source of haptoglobin and SAA in serum. Since serum levels of acute phase proteins are elevated in other conditions involving inflammation, it has been argued that the non-specific nature of the acute phase response makes haptoglobin and SAA unsuitable for PA biomarkers [27-29]. Indeed, our data indicates that haptoglobin was significantly elevated in serum from patients with chronic pancreatitis and other benign conditions. Although mean serum levels of both haptoglobin and SAA were further elevated in PA cases, the overlap between the groups, including healthy controls, makes application of the individual biomarkers to individual cases problematic in that some cases will have serum levels below the mean for control groups. The same problem will occur for any biomarker whose measures do not fully segregate between groups. Such markers are still suitable for inclusion in a panel screen, however, as long as the marker contributes to classification by successfully identifying a subset of cases.
We have developed an algorithm involving the sequential application of single marker splits that minimize misclassification at each step. Such an approach provides an intuitive method for combining aggregate data from multiple markers that can be applied to individual cases. The specific algorithm awaits validation in a larger data set and its usefulness for early detection is unproven. However, our results indicate that inclusion of haptoglobin, SAA and CA 19-9 in a panel screen may be useful for diagnosis, particularly in those cases presenting with suspicion of PA.
Acknowledgments
This work was supported in part by research grants from the National Institutes of Health (R03 CA115225 to SJM and P30CA042014 to the Huntsman Cancer Institute for support of core facilities), grants from the Huntsman Cancer Institute Pancreas Cancer Research Program and through support from the Huntsman Cancer Foundation.
These data were presented at the Molecular Surgeon Symposium on Personalized Genomic Medicine and Surgery at the Baylor College of Medicine, Houston, Texas, on April 12, 2008. The symposium was supported by a grant from the National Institutes of Health (R13 CA132572 to Changyi Chen)
References
- 1.Jemal A, Siegel R, Ward E, et al. Cancer statistics, 2008 CA Cancer. J Clin. 2008;58:71–96. doi: 10.3322/CA.2007.0010. [DOI] [PubMed] [Google Scholar]
- 2.Glenn J, Steinberg WM, Kurtzman SH, et al. Evaluation of the utility of a radioimmunoassay for serum CA 19-9 levels in patients before and after treatment of carcinoma of the pancreas. J Clin Oncol. 1988;6:462–468. doi: 10.1200/JCO.1988.6.3.462. [DOI] [PubMed] [Google Scholar]
- 3.Ritts RE, Pitt HA. CA 19-9 in pancreatic cancer. Surg Oncol Clin N Am. 1998;7:93–101. [PubMed] [Google Scholar]
- 4.Goonetilleke KS, Siriwardena AK. Systematic review of carbohydrate antigen (CA 19-9) as a biochemical marker in the diagnosis of pancreatic cancer. Eur J Surg Oncol. 2007;33:266–270. doi: 10.1016/j.ejso.2006.10.004. [DOI] [PubMed] [Google Scholar]
- 5.Cooperman A. The Pancreas Revisited II: Benign and Malignanat Tumors--An Interdisciplinary Approach: Pancreatic Cancer. Surgical Clinics. 2001;81:3. [Google Scholar]
- 6.Peterli R, Meyer-Wyss B, Herzog U, et al. CA19-9 has no value as a tumor marker in obstructive jaundice. Schweiz Med Wochenschr. 1999;129:77–79. [PubMed] [Google Scholar]
- 7.Gold DV, Modrak DE, Ying Z, et al. New MUC1 serum immunoassay differentiates pancreatic cancer from pancreatitis. J Clin Oncol. 2006;24:252–258. doi: 10.1200/JCO.2005.02.8282. [DOI] [PubMed] [Google Scholar]
- 8.Grote T, Logsdon CD. Progress on molecular markers of pancreatic cancer. Current opinion in gastroenterology. 2007;23:508–514. doi: 10.1097/MOG.0b013e3282ba5724. [DOI] [PubMed] [Google Scholar]
- 9.Ibis M, Koklu S, Yilmaz FM, et al. Serum adenosine deaminase levels in pancreatic diseases. Pancreatology. 2007;7:526–530. doi: 10.1159/000108970. [DOI] [PubMed] [Google Scholar]
- 10.Koopmann J, Fedarko NS, Jain A, et al. Evaluation of osteopontin as biomarker for pancreatic adenocarcinoma. Cancer Epidemiol Biomarkers Prev. 2004;13:487–491. [PubMed] [Google Scholar]
- 11.Koopmann J, Rosenzweig CN, Zhang Z, et al. Serum markers in patients with resectable pancreatic adenocarcinoma: macrophage inhibitory cytokine 1 versus CA19-9. Clin Cancer Res. 2006;12:442–446. doi: 10.1158/1078-0432.CCR-05-0564. [DOI] [PubMed] [Google Scholar]
- 12.Kuhlmann KF, van Till JW, Boermeester MA, et al. Evaluation of matrix metalloproteinase 7 in plasma and pancreatic juice as a biomarker for pancreatic cancer. Cancer Epidemiol Biomarkers Prev. 2007;16:886–891. doi: 10.1158/1055-9965.EPI-06-0779. [DOI] [PMC free article] [PubMed] [Google Scholar]
- 13.Melle C, Ernst G, Escher N, et al. Protein profiling of microdissected pancreas carcinoma and identification of HSP27 as a potential serum marker. Clin Chem. 2007;53:629–635. doi: 10.1373/clinchem.2006.079194. [DOI] [PubMed] [Google Scholar]
- 14.Rosty C, Christa L, Kuzdzal S, et al. Identification of hepatocarcinoma-intestine-pancreas/pancreatitis-associated protein I as a biomarker for pancreatic ductal adenocarcinoma by protein biochip technology. Cancer Res. 2002;62:1868–1875. [PubMed] [Google Scholar]
- 15.Simeone DM, Ji B, Banerjee M, et al. CEACAM1, a novel serum biomarker for pancreatic cancer. Pancreas. 2007;34:436–443. doi: 10.1097/MPA.0b013e3180333ae3. [DOI] [PubMed] [Google Scholar]
- 16.Zhou W, Sokoll LJ, Bruzek DJ, et al. Identifying markers for pancreatic cancer by gene expression analysis. Cancer Epidemiol Biomarkers Prev. 1998;7:109–112. [PubMed] [Google Scholar]
- 17.Bharti A, Ma PC, Maulik G, et al. Haptoglobin alpha-subunit and hepatocyte growth factor can potentially serve as serum tumor biomarkers in small cell lung cancer. Anticancer Res. 2004;24:1031–1038. [PubMed] [Google Scholar]
- 18.Biran H, Friedman N, Neumann L, et al. Serum amyloid A (SAA) variations in patients with cancer: correlation with disease activity, stage, primary site, and prognosis. J Clin Pathol. 1986;39:794–797. doi: 10.1136/jcp.39.7.794. [DOI] [PMC free article] [PubMed] [Google Scholar]
- 19.Chan DC, Chen CJ, Chu HC, et al. Evaluation of serum amyloid A as a biomarker for gastric cancer. Ann Surg Oncol. 2007;14:84–93. doi: 10.1245/s10434-006-9091-z. [DOI] [PubMed] [Google Scholar]
- 20.Diamandis EP. Identification of serum amyloid a protein as a potentially useful biomarker for nasopharyngeal carcinoma. Clin Cancer Res. 2004;10:5293. doi: 10.1158/1078-0432.CCR-04-0377. author reply 5293-5294. [DOI] [PubMed] [Google Scholar]
- 21.Glojnaric I, Casl MT, Simic D, et al. Serum amyloid A protein (SAA) in colorectal carcinoma. Clin Chem Lab Med. 2001;39:129–133. doi: 10.1515/CCLM.2001.022. [DOI] [PubMed] [Google Scholar]
- 22.Howard BA, Wang MZ, Campa MJ, et al. Identification and validation of a potential lung cancer serum biomarker detected by matrix-assisted laser desorption/ionization-time of flight spectra analysis. Proteomics. 2003;3:1720–1724. doi: 10.1002/pmic.200300514. [DOI] [PubMed] [Google Scholar]
- 23.Khan N, Cromer CJ, Campa M, et al. Clinical utility of serum amyloid A and macrophage migration inhibitory factor as serum biomarkers for the detection of nonsmall cell lung carcinoma. Cancer. 2004;101:379–384. doi: 10.1002/cncr.20377. [DOI] [PubMed] [Google Scholar]
- 24.Tolson J, Bogumil R, Brunst E, et al. Serum protein profiling by SELDI mass spectrometry: detection of multiple variants of serum amyloid alpha in renal cancer. patients Lab Invest. 2004;84:845–856. doi: 10.1038/labinvest.3700097. [DOI] [PubMed] [Google Scholar]
- 25.Ye B, Cramer DW, Skates SJ, et al. Haptoglobin-alpha subunit as potential serum biomarker in ovarian cancer: identification and characterization using proteomic profiling and mass spectrometry. Clin Cancer Res. 2003;9:2904–2911. [PubMed] [Google Scholar]
- 26.Deng R, Lu Z, Chen Y, et al. Plasma proteomic analysis of pancreatic cancer by 2-dimensional gel electrophoresis. Pancreas. 2007;34:310–317. doi: 10.1097/MPA.0b013e31802f2483. [DOI] [PubMed] [Google Scholar]
- 27.Koomen JM, Shih LN, Coombes KR, et al. Plasma protein profiling for diagnosis of pancreatic cancer reveals the presence of host response proteins. Clin Cancer Res. 2005;11:1110–1118. [PubMed] [Google Scholar]
- 28.Sun ZL, Zhu Y, Wang FQ, et al. Serum proteomic-based analysis of pancreatic carcinoma for the identification of potential cancer biomarkers. Biochim Biophys Acta. 2007;1774:764–771. doi: 10.1016/j.bbapap.2007.04.001. [DOI] [PubMed] [Google Scholar]
- 29.Yokoi K, Shih LC, Kobayashi R, et al. Serum amyloid A as a tumor marker in sera of nude mice with orthotopic human pancreatic cancer and in plasma of patients with pancreatic cancer. Int J Oncol. 2005;27:1361–1369. [PubMed] [Google Scholar]
- 30.Dobryszycka W. Biological functions of haptoglobin--new pieces to an old puzzle. Eur J Clin Chem Clin Biochem. 1997;35:647–654. [PubMed] [Google Scholar]
- 31.Oshiro S, Yajima Y, Kawamura K, et al. Catabolism of hemoglobin-haptoglobin complex in microsome subfractions. Chem Pharm Bull (Tokyo) 1992;40:1847–1851. doi: 10.1248/cpb.40.1847. [DOI] [PubMed] [Google Scholar]
- 32.Cid MC, Grant DS, Hoffman GS, et al. Identification of haptoglobin as an angiogenic factor in sera from patients with systemic vasculitis. J Clin Invest. 1993;91:977–985. doi: 10.1172/JCI116319. [DOI] [PMC free article] [PubMed] [Google Scholar]
- 33.Gutteridge JM. The antioxidant activity of haptoglobin towards haemoglobin-stimulated lipid peroxidation. Biochim Biophys Acta. 1987;917:219–223. doi: 10.1016/0005-2760(87)90125-1. [DOI] [PubMed] [Google Scholar]
- 34.de Kleijn DP, Smeets MB, Kemmeren PP, et al. Acute-phase protein haptoglobin is a cell migration factor involved in arterial restructuring. FASEB J. 2002;16:1123–1125. doi: 10.1096/fj.02-0019fje. [DOI] [PubMed] [Google Scholar]
- 35.Uhlar CM, Whitehead AS. Serum amyloid A, the major vertebrate acute-phase reactant. Eur J Biochem. 1999;265:501–523. doi: 10.1046/j.1432-1327.1999.00657.x. [DOI] [PubMed] [Google Scholar]
- 36.Kaneta Y, Kagami Y, Tsunoda T, et al. Genome-wide analysis of gene-expression profiles in chronic myeloid leukemia cells using a cDNA microarray. Int J Oncol. 2003;23:681–691. [PubMed] [Google Scholar]
- 37.Nishie A, Masuda K, Otsubo M, et al. High expression of the Cap43 gene in infiltrating macrophages of human renal cell carcinomas. Clin Cancer Res. 2001;7:2145–2151. [PubMed] [Google Scholar]
- 38.Smeets MB, Fontijn J, Kavelaars A, et al. The acute phase protein haptoglobin is locally expressed in arthritic and oncological tissues. Int J Exp Pathol. 2003;84:69–74. doi: 10.1046/j.1365-2613.2003.00336.x. [DOI] [PMC free article] [PubMed] [Google Scholar]