

Abstract
Although it has been documented that dynamin 1 gene (DNM1) is significantly modulated by nicotine in animal models, its association with nicotine dependence (ND) in human population remained to be unexplored. To determine whether DNM1 is associated with ND, in this study, we genotyped seven single-nucleotide polymorphisms (SNPs) within this gene in 602 nuclear families of either African-American (AA) or European-American (EA) origin. Individual SNP-based association analysis revealed a significant association of SNP rs3003609 with Smoking Quantity (SQ; P = 0.0031) and Heaviness of Smoking Index (HSI; P = 0.0042) in the EA sample. Furthermore, our haplotype-based association analyses indicated that haplotypes T-G-T, formed by rs2502731-rs2229917-rs3003609 (at a frequency of 54%), G-T-A, formed by rs2229917-rs3003609-rs16930313 (at a frequency of 52%), and T-A-G, formed by rs3003609-rs16930313-rs7022174 (at a frequency of 52%) are significantly associated with SQ (Z = −2.44~−2.92; P = 0.015~0.0055) and HSI (Z = −2.52~−2.67; P = 0.012~0.0076) in the EA sample. In the AA sample, another haplotype, G-T-A, formed by rs7875406-rs2502731-rs2229917, at a frequency of 12% was significantly associated with SQ (Z = −2.58; P = 0.0098). Finally, by using in vitro gene expression assays, we demonstrated that the T allele of rs3003609 in the exon 9 of DNM1 significantly decreases the expression of dynamin 1, by 27.1% at the mRNA and 22.0% at the protein level, suggesting that rs3003609 represents a functional polymorphism affecting DNM1 expression and may partly contributed to the observed association of the gene with ND in our samples. Taken together, our findings indicate that dynamin 1 is likely involved in the etiology of ND and represents a plausible candidate for further investigation in independent samples.
Keywords: nicotine, smoking, genetic association, dynamin 1, functional SNP
Introduction
Smoking is the leading cause of preventable death in the United States, causing approximately 438,000 premature deaths and $157 billion in health-related costs annually (Mokdad et al, 2004; USDHHS, 2000). Numerous earlier studies have demonstrated that nicotine is the primary addictive substance in tobacco (Stolerman and Jarvis, 1995; USDHHS, 2000; WHO, 2002). Twin and family studies reveal that nicotine dependence (ND) is a complex trait determined by genetic and environmental factors, as well as their interactions (Carmelli et al, 1992; Swan et al, 2003; Swan and Lessov, 2004). A meta-analysis of 17 reported twin studies indicates that the weighted mean heritability for ND is 0.59 in male and 0.46 in female smokers, with an average of 0.56 for all smokers (Li et al, 2003).
A number of plausible candidate genes has been implicated and investigated for potential association with ND in human studies (Li, 2006). A variety of genes and proteins has also been revealed in microarray and proteomic studies that are modulated in response to nicotine stimulation (Hwang and Li, 2006; Wang et al, 2008). Previously, using two-dimensional electrophoresis combined with mass spectrometry, we identified a number of proteins whose expressions were significantly modulated in the brain regions of nicotine-treated rats compared with controls. Of these proteins, dynamin 1 was modulated significantly by nicotine in four of five brain regions we examined, suggesting that this protein plays a significant role in neuronal activities responding to nicotine stimulation (Hwang and Li,, 2006).
Dynamin 1 belongs to the GTPase superfamily that is involved in various cell processes and has important functions in endocytosis (Schmid et al, 1998), apoptosis, and signaling (Frank et al, 2001; Hislop et al, 2001; Kashiwakura et al, 2004). As one of the best-characterized family members, dynamin 1 is expressed exclusively in the central nervous system and is believed to function in synaptic vesicle recycling in nerve terminals (Powell and Robinson, 1995; Sontag et al, 1994), a process important for neural activities and plasticity. Study of a temperature-sensitive mutant of dynamin in Drosophila shows a clear role of dynamin in synaptic-vesicle retrieval in nerve terminals (Koenig and Ikeda, 1989). Similarly, in rat, dynamin 1-mediated processes appear to be necessary for normal neuronal morphogenesis and dynamin 1 is indispensable for vesicle endocytosis at fast central nervous system synapses (Torre et al, 1994; Yamashita et al, 2005). Moreover, several recent studies revealed that reduced dynamin 1 expression may impair neuronal transport and vesicle trafficking by interactions with other endocytic accessory proteins in hippocampal neurons (Jiang et al, 2006; Kelly and Ferreira, 2006; Kitzmueller et al, 2004). Whereas a study of dynamin 1-knockout mice found that dynamin 1-independent mechanisms can support limited synaptic vesicle endocytosis, the protein is essential during high levels of neuronal activity (Ferguson et al, 2007).
Given that dynamin 1 is modulated significantly nicotine in rat brain regions (Hwang and Li,, 2006) and plays an important role in endocytosis and neuronal activities, we investigated genetic association of its encoding human gene, DNM1, with ND and its potential involvement in the etiology of ND.
Materials and Methods
Participants and ND measures
Participants were of either African-American (AA) or European-American (EA) ancestry and were recruited primarily from the states of Tennessee, Mississippi, and Arkansas during 1999–2004. Proband smokers were required to be at least 21 years old, to have smoked for at least five years, and to have consumed an average of 20 cigarettes per day for the last 12 months. Siblings and parents of a proband were recruited whenever possible, regardless of their smoking status. Extensive data were collected on each participant, including demographics (e.g., sex, age, race, biological relationships, weight, height, years of education, and marital status), medical history, smoking history and current smoking behavior, ND, and selected personality traits, assessed by various questionnaires/interviews available at the NIDA Genetics Consortium Website (http://zork.wustl.edu/nida). All participants provided informed consent. The study protocol and forms/procedures have been approved by all participating Institutional Review Boards.
For each smoker, ND was ascertained by three measures commonly used in the tobacco research field: Smoking Quantity (SQ; defined as the number of cigarettes smoked per day), the Heaviness of Smoking Index (HSI; 0–6 scale), and the Fagerström Test for ND score (FTND; 0–10 scale) (Heatherton et al, 1991). The SQ provides a simple, quantified index of consumption (using a 0–3 point compressed format), whereas HSI includes one item addressing quantity (SQ) and another assessing urgency. The FTND score includes the HSI plus other indicators of behavioral propensity to smoke in various situations. Given the presence of overlap in the content of the three ND measures, there exist fairly robust correlations among them (r = 0.88–0.94) in both the AA and EA samples.
Of the 2,037 participants, the average age was 39.4 ± 14.4 (SD) years for the AA and 40.5 ± 15.5 years for the EA participants. The average nuclear family size was 3.14 ± 0.75 for AAs and 3.17 ± 0.69 for EAs. The average number of cigarettes smoked per day, his, and FTND scores of smokers were 19.4 ± 13.3, 3.7 ± 1.4, and 6.26 ± 2.15 for AA smokers (N = 1053) and 19.5 ± 13.4, 3.9 ± 1.4 and 6.33 ± 2.22 for EA smokers (N = 515).
DNA extraction, SNP selection, and genotyping
Genomic DNA was isolated from blood sample of each participant using the QIAamp DNA Blood Maxi kit (Qiagen, Valencia, CA). The SNPs used for genotyping were selected from the NCBI dbSNP database (http://www.ncbi.nlm.nih.gov/entrez/query.fcgi?db=snp). Two SNPs (rs2229917 and rs3003609) were selected specifically because of their locations at exons 4 and 9, respectively. To obtain a uniform coverage of the gene, the other five were selected on the basis of their high heterozygosity with a minor allele frequency (MAF) > 0.15 (Table 1). All SNPs were genotyped using the TaqMan assay in a 384-well microplate format (Applied Biosystems, Foster City, CA). Briefly, 15 ng of DNA was amplified in a total volume of 7 μl, which contains a set of TaqMan primers and probes and 2.5 μl of TaqMan universal PCR master mix. The amplification procedure was 2 min at 50°C and 10 min at 95°C followed by 40 cycles of 95°C for 25 sec and 60°C for 1 min. Allelic discrimination analysis was performed on the ABI Prism 7900HT Sequence Detection System. To ensure the quality of the genotyping, eight positive and negative controls were added to each microplate. Genotyping data were accepted only when all control samples produced consistent results; otherwise, all samples of the microplate under investigation were re-genotyped.
Table 1.
Information of seven SNPs within DNM1 selected for this study
| SNP number | dbSNP ID | SNP location | Chromosome position | Allele | Frequency
(EA)* |
Frequency
(AA)* |
Sequences of TaqMan primers and MGB probes (5′→3′) |
|---|---|---|---|---|---|---|---|
| 1 | rs7875406 | Intron 2 | 130010839 | A/G | 0.96/0.04 | 0.69/0.31 | F: GGAGGCTTGCGGCTGAT
R: AGCCTCCTTCAAAATACACGACAA P1: AAATCCACAAAGAGCACGT P2: ATCCACAAAGGGCACGT |
| 2 | rs2502731 | Intron 2 | 130016378 | T/C | 0.72/0.28 | 0.51/0.49 | F: TGCCCAGCAAGCTATCGTTATTTAT
R: ACATCAGTAAAATGGGTTGCTGTGA P1: TTCAGCCATCAGTCTGTATA P2: TCAGCCATCAGTTTGTATA |
| 3 | rs2229917 | Exon 4 | 130020758 | G/A | 0.91/0.09 | N/A | F: GGAGGTGCGCCTTGAGATC
R: GCGAGATGCCCTTGTTGGT P1: CCTGTCGGTTTCGGCCT P2: CTGTCGGTCTCGGCCT |
| 4 | rs3003609 | Exon 9 | 130024576 | T/C | 0.62/0.38 | 0.01/0.99 | F: ACCACTCTCCCACCAGGAT
R: AGCCCTCAATGCGCTTCT P1: CAAAGTCTACGGCGAACT P2: AAAGTCTACGGCAAACT |
| 5 | rs16930313 | Intron 11 | 130033218 | A/G | 0.88/0.12 | 0.54/0.46 | F: AGGCATGCGCCACCAT
R: CCTCCTTTTAGACCAAAGCTTTCCT P1: TCTGTGTGATTTTTATGAGCA P2: CTGTGTGATTTTTGTGAGCA |
| 6 | rs7022174 | Intron 12 | 130039293 | G/C | 0.79/0.21 | 0.13/0.87 | F: TTGTCCCATCTGGAAAGTCATTCTC
R: GACCCTTGCAAACGATTAAATGTGA P1: ATCACTACTCAATTCC P2: TCACTACTGAATTCC |
| 7 | rs10987945 | Intron 16 | 130045847 | G/T | 0.96/0.04 | 0.34/0.66 | F: GCCAGGGAGACCATGTGA
R: CCCCTCCCCCACAGTGT P1: CGGTCTCCGGCCCT P2: CGGTCTCAGGCCCT |
The allele frequencies are from HapMap data in the NCBI dbSNP database; N/A: not available.
Association analyses
We used the PedCheck program (O’Connell and Weeks, 1998) to detect genotyping inconsistencies for Mendelian inheritance. One hundred fifty inconsistencies, with 95 in the AA sample and 25 in the EA sample, were detected from approximately 14,300 assays (i.e., 0.8% genotyping error) for seven SNPs across all DNA samples and were excluded from subsequent statistical analysis. Pair-wise linkage disequilibrium (LD) between all possible SNP pairs was estimated using the program Haploview (Barrett et al, 2005). Associations between individual SNP and the three ND measures were determined by the PBAT program using generalized estimating equations (Lange et al, 2003). Associations between each ND measure and haplotypes from all possible haplotypes in consecutive three-SNP combinations were calculated using the FBAT program with the option of computing the P-value of the Z-statistic using Monte Carlo sampling under the null distribution of no linkage and no association (Horvath et al, 2004). Three genetic models (additive, dominant, and recessive) were tested for both individual and multi-locus SNPs (i.e., haplotypes). For all PBAT and FBAT association tests, sex and age were used as covariates in the EA and AA samples and sex, age, and ethnicity as covariates in the combined sample. The three ND measures, SQ, HSI, and FTND, were analyzed individually. All significant associations were corrected for multiple testing according to the SNP spectral decomposition (SNPSpD) approach (Nyholt, 2004) for individual SNP analysis and using Bonferroni correction by dividing the significance level by the number of major haplotypes (frequency >5.0%) for haplotype-based association analysis.
In consideration of high correlations between the three ND measures and among the results under different genetic models, we chose not to correct for testing of the three highly-correlated ND measures or genetic models to avoid being over-conservative. This is because there is no generally accepted methodology capable of handling the problem of highly correlated multiple testing. However, if one wishes to correct for multiple testing for the three highly-related genetic models and/or phenotypes, a justified P-value can be obtained by dividing the corrected P-value after correction for major multiple testing given in the note #1 of Table 2 by 6, i.e., 2 accounting for two independent tests for the three genetic models multiply by 3 ND measures.
Table 2.
Allele frequency and P-value of individual SNPs for association with three ND measures in the EA and AA samples
| EA sample | AA sample | ||||||||
|---|---|---|---|---|---|---|---|---|---|
|
|
|||||||||
| dbSNP ID | Allele | Frequency | SQ | HSI | FTND | Frequency | SQ | HSI | FTND |
| rs7875406 | A/G | 0.63/0.37 | 0.10d | 0.10d | 0.19d | 0.53/0.47 | 0.42d | 0.44r | 0.56r |
| rs2502731 | T/C | 0.63/0.37 | 0.08a | 0.11a | 0.21a | 0.44/0.56 | 0.43d | 0.46d | 0.42a |
| rs2229917 | G/A | 0.94/0.06 | 0.05r | 0.04d | 0.05r | 0.78/0.22 | 0.69a | 0.77d | 0.60r |
| rs3003609 | T/C | 0.55/0.45 | 0.0031d | 0.0042d | 0.011d | 0.11/0.89 | 0.07d | 0.13d | 0.12d |
| rs16930313 | A/G | 0.86/0.14 | 0.04d | 0.05d | 0.14d | 0.64/0.36 | 0.22r | 0.31r | 0.50r |
| rs7022174 | G/C | 0.79/0.21 | 0.39r | 0.21r | 0.32r | 0.29/0.71 | 0.10d | 0.12d | 0.08d |
| rs10987945 | G/T | 0.95/0.05 | 0.25a | 0.34a | 0.32a | 0.50/0.50 | 0.43d | 0.73a | 0.62d |
Notes:
Significant P-value after correction for multiple testing is given in bold and the adjusted P-value at the 0.05 significance level is 0.007 for both the EA and AA samples. Given that the three genetic models and three ND measures are so highly related to each other, we feel that it is too conservative to apply a Bonferroni correction to these comparisons. However, if one wishes to correct for them, the adjusted P value at the 0.05 significance level becomes 0.0012 for both the samples. This approach can be applied to Table 3 as well.
Superscripts indicate genetic models used for analysis: a = additive; d = dominant; and r = recessive.
Age and sex were used as covariates in the analyses for both the EA and AA samples.
Plasmid construction and mutagenesis
The full-length cDNA clone of human DNM1 was purchased from Open Biosystems (Huntsville, AL). The coding region of DNM1 was amplified with a pair of primers, 5′-GCCGGAATTCGGATGGGCAACCGCGGCATGGAAGATC-3′ (forward) and 5′-CATGGCGGCCGCTCAGGGGTCACTGATAGTGATTCTG-3′ (reverse), and was subcloned into the pCMV-HA vector (Clontech, Mountain View, CA), using the EcoRI and NotI two cloning sites. The yielded construct was sequence confirmed to contain rs2229917G and rs3003609C and was thus designated pE4G-E9C. Allele combinations of SNPs rs2229917 and rs3003609 were then generated with the QuikChange II XL Site-Directed Mutagenesis kit (Stratagene, La Jolla, CA), and designated pE4A-E9C, pE4G-E9T, and pE4A-E9T, separately (Figure 2A). All four constructs were verified by sequencing.
Figure 2.
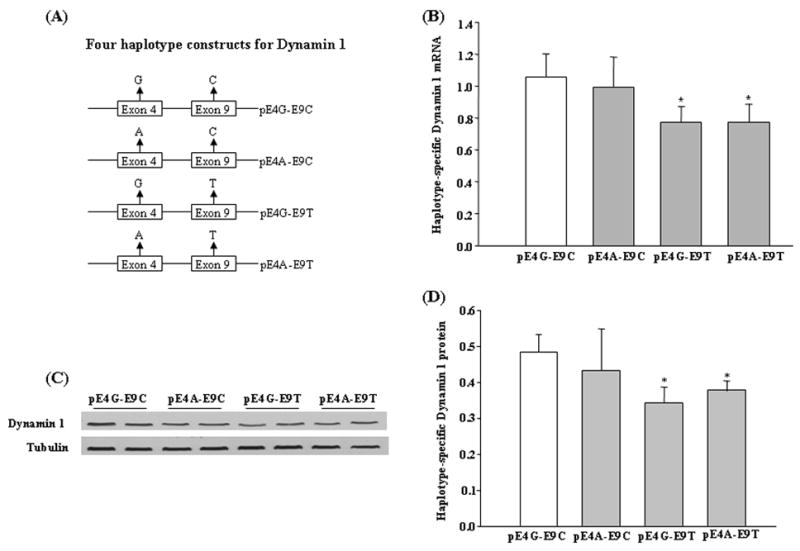
Expression analyses of allele combinations of SNPs rs2229917 at exon 4 and rs3003609 at exon 9. (A) Illustration of four plasmids constructed for dynamin 1 expression analysis. (B) Statistical analysis of real-time RT-PCR data for the four plasmids. 18S RNA was used to normalize expression of each DNM1 construct. Compared with pE4G-E9C, pE4G-E9T and pE4A-E9T showed lower expression of dynamin 1, by 27.1% and 26.8%, respectively. No significant difference was detected between constructs pE4G-E9C and pE4A-E9C. (C) Representative Western blotting images for dynamin 1 and tubulin. Tubulin was used to normalize expression of each DNM1 construct. (D) Statistical analysis of the protein expression levels of four DNM1 constructs. Similar to the mRNA expression data in (C), pE4G-E9T and pE4A-E9T showed decreased dynamin 1 protein expression, by 29.2% and 22.2%, respectively, compared with pE4G-E9C. Data in Figures B and D are given as means ± S.E.M. (* P <0.05; n = 3/group).
Cell culture and transfection
Human neuroblastoma SH-SY5Y cells were purchased from the American Type Culture Collection (Manassas, VA), and grown in the DMEM supplemented with 10% fetal bovine serum (Invitrogen, Carlsbad, CA) at 37°C with 5% CO2. Cells were transfected with DNM1 constructs using Lipofectamine 2000 (Invitrogen) in accordance to the manufacturer’s protocol. Cells were grown for additional 24 hours after transfection and were harvested for RNA isolation and protein extraction, respectively.
Expression analysis of haplotype-specific DNM1
Total RNA in the transfected cells was isolated with the Trizol reagent (Invitrogene) and treated with RNA-free DNase I (Ambion, Austin, TX) to remove any potential remaining plasmid DNA prior to reverse transcription. For quantitative real-time reverse transcriptase-polymerase chain reaction (RT-PCR), RNA was first reverse transcribed with SuperScript II RNase H− and random hexamer (Invitrogen). Then a TaqMan probe specifically designed to detect the HA-fused dynamin-1 gene: 5′-GATGTTCCAGATTACGCTCTTATGG-3′ (forward), 5′-CAGCGGGATGAGATCTTCCA-3′ (reverse), and 5′-FAM-CGAATTCGGATGGGCA-MGB-3′ (probe), was applied for the standard TaqMan PCR procedures in the ABI Prism 7900HT Sequence Detection System. Ribosome RNA (18S) was used as a control for data normalization. Proteins in the transfected cells were extracted by the RIPA buffer, and sonicated and quantified using the Bio-Rad Protein Assay (Bio-Rad, Hercules, CA). The same amount of total protein was applied in the SDS-PAGE separation. The protein expression of haplotype-specific DNM1 was detected by using a primary antibody against HA tag, a horseradish peroxidase-conjugated secondary antibody (Covance, Princeton, NJ), and the SuperSignal West Pico chemiluminescent substrate (Pierce, Rockford, IL) in Western blotting analysis.
mRNA stability analysis of haplotype-specific DNM1
To evaluate the effect of SNP rs3003609 alleles (C/T) on the mRNA stability, pE4G-E9C and pE4G-E9T were transfected separately into SH-SY5Y cells. One day after transfection, cells were treated with actinomycin D at a final concentration of 5 μg/ml for 0, 1, 3, 5, 7, or 9 hours, respectively. Total RNA was then isolated for quantitative real-time RT-PCR assay.
Results
Association analysis of individual SNPs with ND
Association of individual SNPs with the three ND measures (SQ, HSI, FTND) was determined with PBAT-GEE (Lange et al, 2003). We analyzed the EA and AA samples separately, because 1) the potential genetic differences were reported in nicotine metabolism and smoking behavior among racial groups (Benowitz et al, 1999) and 2) we noticed significant differences in the allele frequencies of several SNPs between the EA and AA samples (Table 2).
In the EA sample, we found significant associations under the dominant model of rs2229917 with the HSI measure (P = 0.043), of rs3003609 with all three ND measures (P = 0.0031~0.011), and of rs16930313 with the SQ measure (P = 0.039). However, only the associations of rs3003609 with SQ and HSI remained significant after correction for multiple testing (adjusted P-value at the 0.05 significance level = 0.007) based on the SNPSpD approach (Nyholt, 2004). We found no significant association of individual SNPs in DNM1 with any ND measure in the AA sample (Table 2). Nonetheless, we also tested these individual SNPs in the EA and AA combined sample. We only detected rs7022174 that was marginally associated with the FTND measure (P = 0.05), which was no longer significant after correction for multiple testing.
Haplotype block structure
Figure 1 shows the pair-wise D′ values for the seven selected SNPs within DNM1 that were determined in the EA and AA populations using the HaploView algorithm (Barrett et al, 2005). The haplotype block in the EA sample, a length of 5 kb extending from rs7875406 to rs2502731, was predicted according to the block definition proposed by Gabriel and colleagues (Gabriel et al, 2002). No haplotype block was found in the AA sample.
Figure 1.
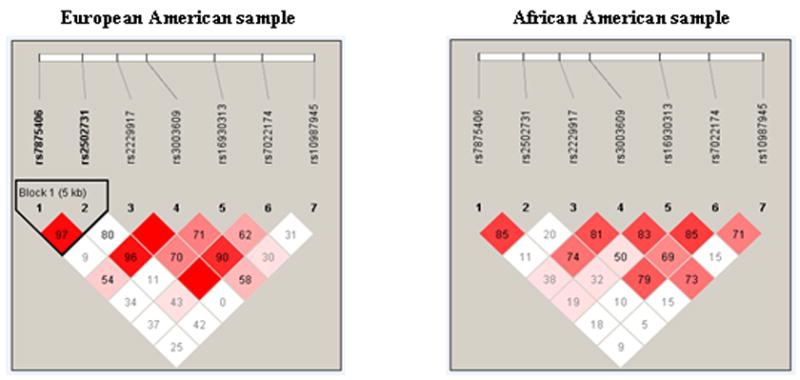
Haploview-generated LD maps of the seven SNPs within DNM1 in the EA and AA samples. Regions of high LD (D′ = 1 and LD >2) are shown in dark gray. Markers with LD (0.21 < D′ < 1 and LOD >2) are shown in dark through light gray, with the color intensity decreasing with decreasing D′ values. Regions of low LD and low LOD scores (LOD <2) are shown in white. The number within each box indicates the D′ statistic between the two SNPs. Haplotype blocks in the two samples were produced by the HaploView program using the block definitions proposed by Grabiel et al.
Haplotype-based association analysis
Since we found no large haplotype block within DNM1, we performed haplotype-based association analysis with the FBAT program for all possible haplotypes in consecutive three-SNP combinations and the three measures in the EA and AA samples. As shown in Table 3, in the EA sample, four major haplotypes showed significant associations with at least two of three ND measures, of which three major haplotypes remained significant for the SQ and HSI after Bonferroni correction. The first haplotype, T-G-T, formed by SNPs rs2502731, rs2229917 and rs3003609, at a frequency of 54% showed a significant inverse association with SQ (Z = −2.76, P = 0.0058; Global P = 0.015) and HSI (Z = −2.66, P = 0.0079; Global P = 0.027) under the additive model. The second haplotype, G-T-A, formed by rs2229917, rs3003609 and rs16930313, at a frequency of 52% showed a significant inverse association with SQ (Z = −2.92, P = 0.0035; Global P = 0.033) and HSI (Z = −2.67, P = 0.0076; Global P = 0.056) under the dominant model. The last one, T-A-G, formed by rs3003609, rs16930313 and rs7022174, at a frequency of 52% also exhibited a significant inverse association with SQ and HSI under both the additive and dominant models. By examining the haplotype associations in the EA sample (Table 3), we found that all significant haplotypes contain the T allele of SNP rs3003609, which always responds to the protective haplotypes. This indicates that rs3003609 may represent a functional polymorphism contributing to the observed association of the gene with ND in the EA sample.
Table 3.
P- and Z-values of haplotypes that are significantly associated with three ND measures in the EA and AA samples
| Haplotype | SQ
|
HIS
|
FTND
|
|||||||||||||||
|---|---|---|---|---|---|---|---|---|---|---|---|---|---|---|---|---|---|---|
| 1 | 2 | 3 | 4 | 5 | 6 | Freq. | P-value | Z-value | Global P-value |
No. of families |
P-value | Z-value | Global P-value |
No. of families | P-value | Z-value | Global P-value |
No. of families |
| EA sample
| ||||||||||||||||||
| T | G | T | 0.54 | 0.0058a | −2.76a | 0.015a | 79a | 0.0079a | −2.65a | 0.027a | 80a | 0.31a | 1.02a | 0.15a | 71a | |||
| 0.013d | −2.49d | 0.12d | 45d | 0.033d | −2.13d | 0.19d | 48d | |||||||||||
| G | T | A | 0.52 | 0.015a | −2.44a | 0.11a | 82a | 0.018a | −2.36a | 0.13a | 83a | 0.031d | −2.15d | 0.092d | 51d | |||
| 0.0035d | −2.92d | 0.033d | 51d | 0.0076d | −2.67d | 0.056d | 51d | |||||||||||
| C | A | G | 0.24 | 0.033a | 2.41a | 0.14a | 64a | 0.031a | 2.13a | 0.10a | 65a | 0.046a | 1.97a | 0.25a | 65a | |||
| T | A | G | 0.52 | 0.0071a | −2.69 a | 0.14a | 87a | 0.0078a | −2.66a | 0.10a | 88a | 0.047a | −2.00a | 0.25a | 88a | |||
| 0.0041d | −2.87d | 0.07d | 60d | 0.012d | −2.52d | 0.078d | 61d | 0.049d | −1.98d | 0.19d | 61d | |||||||
|
| ||||||||||||||||||
| AA sample
| ||||||||||||||||||
| G | T | A | 0.12 | 0.0098r | −2.58r | 0.11r | 16r | 0.037r | −2.09r | 0.31r | 16r | 0.05r | −1.96r | 0.34r | 16r | |||
| T | A | C | 0.15 | 0.014r | −2.46r | 0.062r | 18r | 0.052r | −1.94r | 0.28r | 18r | 0.090r | −1.69r | 0.36r | 18r | |||
Notes:
Only the major haplotypes with P-value < 0.05 in at least one ND measure are shown
At the 0.05 significance level, significant P-value after Bonferroni correction for three major haplotypes in the EA sample is 0.0167; for five major haplotypes in the AA sample is 0.01.
Superscripts indicate the genetic models used in the analysis: a = additive; d = dominant; and r = recessive.
Age and sex were used as covariates in both the EA and AA samples.
Although we detected no significant association of individual SNPs with ND in the AA sample, interestingly, we did find several haplotypes that were significantly associated with the SQ and HSI under the recessive model. However, only the haplotype G-T-A, formed by SNPs rs7875406, rs2502731, and rs2229917, at a frequency of 12%, remained a significant association with SQ (Z = −2.58; P = 0.0098; Global P = 0.11) after correction for multiple testing (Table 3).
Biological effect of SNPs rs2229917 and rs3003609 on the expression of dynamin 1
To define the functional significance of exonic SNPs rs2229917 (A/G) and rs3003609 (C/T) for the expression of dynamin 1, we constructed four plasmids for the possible allele combinations (i.e., pE4G-E9C, pE4A-E9C, pE4G-E9T, and pE4A-E9T) by site-directed mutagenesis from a complete cDNA clone and then transfected them into human neuroblastoma SH-SY5Y cells. Following the transient transfection, we measured the mRNA and protein expression levels for each construct using the quantitative real-time RT-PCR and Western blotting analysis, respectively (Figure 2).
After normalization to the corresponding 18S ribosome RNA of each sample, we found that constructs pE4G-E9C and pE4A-E9C showed significantly higher mRNA expression than pE4G-E9T and pE4A-E9T (~27.0%; P < 0.05). On the other hand, no difference was observed between pE4G-E9C and pE4A-E9C or between pE4G-E9T and pE4A-E9T (Figure 2B). At the protein level normalized to the corresponding tubulin expression of each sample, almost the same expression trends were found, in that pE4G-E9T and pE4A-E9T showed significantly less expression than was seen from the other two constructs (−22.2~−29.2%; P < 0.05; Figure 2D). These results indicate that the two alleles of rs2229917 at exon 4 have little or no impact on the expression of DNM1 and that all differences observed among the four constructs were attributable primarily to rs3003609 at exon 9, of which the C allele caused higher expression than does the T allele, indicating that this SNP is a functional polymorphism contributing at least partly to the observed association of the gene with ND in our samples.
Regulatory effect of rs3003609 on mRNA stability of DNM1
As demonstrated above, the constructs with the T allele of rs3003609 caused significantly less expression of dynamin 1 than did those with the C allele. Given that the same trends occurred at both the mRNA and protein levels, a possible explanation is the stability difference of the allele-specific mRNAs. To test this speculation, we transfected SH-SY5Y cells with constructs pE4G-E9C and pE4G-E9T, treated cells with actinomycin D for a different period of time, and measured the mRNA expression level with real-time RT-PCR. We found that the estimated half-life of DNM1 mRNA was about 3.2 hours for pE4G-E9C and 3.6 hours for pE4G-E9T (Figure 3). No significant difference was detected in the mRNA half-life between the two constructs, although the mRNA level of pE4G-E9T was significantly lower at each time point than that of pE4G-E9C, implying that the expression difference of DNM1 with different rs3003609 alleles may be caused at the transcription level.
Figure 3.
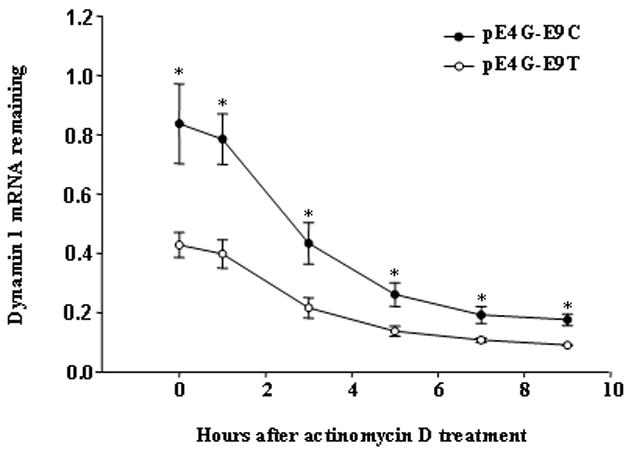
Comparison of mRNA stability of DNM1 from pE4G-E9C and pE4G-E9T constructs. Measured half-life of mRNA was about 3.2 hours for the former and 3.6 hours for the latter. No significant difference in the half-life of DNM1 mRNA was found in the two constructs. Data are given as means ± S.E.M. (* P <0.05; n = 3/group).
Discussion
Previously, we reported in a proteomics study that dynamin 1 is modulated significantly by nicotine in several rat brain regions (Hwang and Li, 2006). By using different molecular approaches in independent animal experiments, we subsequently confirmed this finding (Xu and Li, unpublished data). Given these consistent results, we performed a genetic association study in two independent ethnic samples to explore whether DNM1, encoding dynamin 1, is associated with ND. Our individual SNP analysis revealed that SNPs rs2229917, rs3003609, and rs16930313 are significantly associated with at least two ND measures in the EA sample (Table 2). Further, our haplotype analysis revealed three major haplotypes, T-G-T, G-T-A and T-A-G, formed by SNPs rs2502731, rs2229917, rs3003609, and rs16930313, that have significant inverse associations with at least two ND measures in the EA sample (Table 3). Together, this indicates that DNM1 is significantly associated with ND in the EA population. In contrast, we found no significant association of individual SNPs with ND in the AA sample, but identified a haplotype, G-T-A, formed by SNPs rs7875406, rs2502731, and rs2229917, that has a significant inverse association with SQ in the AA sample (Tables 2 and 3). It suggests that the association in the AA sample is potentially attributable to linkage disequilibrium with a more centromeric genetic variant in the near region.
Although we examined the association with three ND measures in the EA and AA combined sample as well, we only found marginal significant associations in the individual SNP and haplotype analyses. These associations were no longer significant after correction for multiple testing (data not shown). This, from another point of view, reflects the significant difference in the associations of DNM1 with ND in the two ethnic groups, which is most likely attributable to the ethnic-specific characteristics of some SNPs within DNM1 (Tables 1 and 2). Also, we like to point out that our association results for both individual SNPs and haplotypes did not correct for testing of the three highly correlated ND measures and genetic models, or multiple genes that we found to be associated with ND previously in the samples. This is because Bonferroni correction is considered to be over-conservative and there is no generally accepted method for handling such highly correlated multiple testing. Regarding genetic models, we chose to use the three models because in some cases we found that dominant and/or recessive model produce better results than additive model likely due to the presence of heterosis that has not received much attention in almost all human genetic association analyses. Regardless of these rationale, we like to consider our association results of ND with dynamin 1, especially for the AA sample, as exploratory and suggest that more replication in independent samples is greatly needed in future studies.
Polymorphisms rs2229917 and rs3003609 are two exonic synonymous variants, residing at exons 4 and 9, respectively. Because both SNPs demonstrated consistently associations with ND in our individual SNP and haplotype analyses in the EA sample (Tables 2 and 3), we speculate that they may represent two functional polymorphisms to affect DNM1 expression. By expressing plasmid constructs containing different allele combinations of rs2229917 and rs3003609 in human neuroblastoma SH-SY5Y cells, we found that the plasmid constructs bearing rs3003609T allele produced significantly lower expression levels of mRNA and protein than those with rs3003609C allele, whereas no significant difference was detected between the constructs with the G or A allele of rs2229917 (Figure 2). We thus conclude that SNP rs3003609, but not rs2229917, is a potential causative polymorphism involved in the regulation of DNM1 expression. Of note, we revealed all negative Z-value for the haplotypes containing rs3003609T allele (Table 3), indicating that the T allele of rs3003609 may play a protective role against the development of ND.
Non-synonymous SNPs change amino acids in protein sequence and can directly influence protein function. The effects of no-synonymous polymorphisms are thus relatively easy to study and have been widely characterized for associations with human diseases (Yampolsky et al, 2005). In contrast, synonymous SNPs are more common in human genome but do not produce altered coding sequences. Their characterization is relatively difficult. Recently, studies have revealed that synonymous SNPs can also modulate gene expression by altering mRNA secondary structure (Nackley et al, 2006) or influence protein function by altering protein conformation in the presence of a rare codon marked by the polymorphism (Kimchi-Sarfaty et al, 2007). Our data in this report thus provide the new evidence of synonymous SNPs as potential functional variants in human genetics. However, although we demonstrated the differential expression of rs3003609 allele-specific DNM1, subsequently we detected no significant difference in their mRNA stability or half-life. We reasoned that endogenous expressed dynamin 1, exclusively confined in neurons (Praefcke and McMahon, 2004), might interfere with our results, despite that we employed an exogenous gene-specific TaqMan probe for mRNA quantification and an antibody against HA tag for protein detection. Nonetheless, further study is required to determine how polymorphism rs3003609 modulates the expression of DNM1.
In summary, we provided the first evidence that DNM1 is associated with ND, more significant in the EA sample than in the AA sample. Further, we demonstrated that SNP rs3003609 at exon 9 represents a functional variant, of which the C allele causes greater DNM1 expression at both the mRNA and protein levels than does the T allele. On the basis of these findings, along with our previous findings of nicotine-modulated dynamin 1 expression in the brain regions (Hwang et al, 2006) and the well-known function of dynamin 1 in neuronal activities and plasticity (Ferguson et al, 2007; Praefcke et al, 2004), we conclude that dynamin 1 is an important player in the etiology of ND. Further genetic association study of this gene in other independent samples is warranted.
Acknowledgments
We are grateful to the invaluable contributions of clinical information and tissue samples by the participants in this study, as well as the dedicated work of the research staffs at different clinical sites. We also thank Dr. David L. Bronson for his excellent editing of this manuscript. This project was funded by National Institutes of Health grants DA-12844 and DA-13783 (to M.D.L.).
Footnotes
Disclosure/Conflict of Interest
QX, WH, TJP, and JZM have no conflicts of interest to declare. MDL disclosed consulting fees on a NIDA-sponsored research project from Information Management Consultants, Inc.
References
- Barrett JC, Fry B, Maller J, Daly MJ. Haploview: analysis and visualization of LD and haplotype maps. Bioinformatics. 2005;21(2):263–265. doi: 10.1093/bioinformatics/bth457. [DOI] [PubMed] [Google Scholar]
- Benowitz NL, Perez-Stable EJ, Fong I, Modin G, Herrera B, Jacob P., 3rd Ethnic differences in N-glucuronidation of nicotine and cotinine. J Pharmacol Exp Ther. 1999;291(3):1196–1203. [PubMed] [Google Scholar]
- Carmelli D, Swan GE, Robinette D, Fabsitz R. Genetic influence on smoking--a study of male twins. N Engl J Med. 1992;327(12):829–833. doi: 10.1056/NEJM199209173271201. [DOI] [PubMed] [Google Scholar]
- Ferguson SM, Brasnjo G, Hayashi M, Wolfel M, Collesi C, Giovedi S, et al. A selective activity-dependent requirement for dynamin 1 in synaptic vesicle endocytosis. Science. 2007;316(5824):570–574. doi: 10.1126/science.1140621. [DOI] [PubMed] [Google Scholar]
- Frank S, Gaume B, Bergmann-Leitner ES, Leitner WW, Robert EG, Catez F, et al. The role of dynamin-related protein 1, a mediator of mitochondrial fission, in apoptosis. Dev Cell. 2001;1(4):515–525. doi: 10.1016/s1534-5807(01)00055-7. [DOI] [PubMed] [Google Scholar]
- Gabriel SB, Schaffner SF, Nguyen H, Moore JM, Roy J, Blumenstiel B, et al. The structure of haplotype blocks in the human genome. Science. 2002;296(5576):2225–2229. doi: 10.1126/science.1069424. [DOI] [PubMed] [Google Scholar]
- Heatherton TF, Kozlowski LT, Frecker RC, Fagerstrom KO. The Fagerstrom Test for Nicotine Dependence: a revision of the Fagerstrom Tolerance Questionnaire. Br J Addict. 1991;86(9):1119–1127. doi: 10.1111/j.1360-0443.1991.tb01879.x. [DOI] [PubMed] [Google Scholar]
- Hislop JN, Everest HM, Flynn A, Harding T, Uney JB, Troskie BE, et al. Differential internalization of mammalian and non-mammalian gonadotropin-releasing hormone receptors. Uncoupling of dynamin-dependent internalization from mitogen-activated protein kinase signaling. J Biol Chem. 2001;276(43):39685–39694. doi: 10.1074/jbc.M104542200. [DOI] [PubMed] [Google Scholar]
- Horvath S, Xu X, Lake SL, Silverman EK, Weiss ST, Laird NM. Family-based tests for associating haplotypes with general phenotype data: application to asthma genetics. Genet Epidemiol. 2004;26(1):61–69. doi: 10.1002/gepi.10295. [DOI] [PubMed] [Google Scholar]
- Hwang YY, Li MD. Proteins differentially expressed in response to nicotine in five rat brain regions: identification using a 2-DE/MS-based proteomics approach. Proteomics. 2006;6(10):3138–3153. doi: 10.1002/pmic.200500745. [DOI] [PubMed] [Google Scholar]
- Jiang S, Avraham HK, Kim TA, Rogers RA, Avraham S. Receptor-type PTP-NP inhibition of Dynamin-1 GTPase activity is associated with neuronal depolarization. Cell Signal. 2006;18(9):1439–1446. doi: 10.1016/j.cellsig.2005.11.010. [DOI] [PubMed] [Google Scholar]
- Kashiwakura Y, Watanabe M, Kusumi N, Sumiyoshi K, Nasu Y, Yamada H, et al. Dynamin-2 regulates oxidized low-density lipoprotein-induced apoptosis of vascular smooth muscle cell. Circulation. 2004;110(21):3329–3334. doi: 10.1161/01.CIR.0000147828.86593.85. [DOI] [PubMed] [Google Scholar]
- Kelly BL, Ferreira A. beta-Amyloid-induced dynamin 1 degradation is mediated by N-methyl-D-aspartate receptors in hippocampal neurons. J Biol Chem. 2006;281(38):28079–28089. doi: 10.1074/jbc.M605081200. [DOI] [PubMed] [Google Scholar]
- Kimchi-Sarfaty C, Oh JM, Kim IW, Sauna ZE, Calcagno AM, Ambudkar SV, et al. A “silent” polymorphism in the MDR1 gene changes substrate specificity. Science. 2007;315(5811):525–528. doi: 10.1126/science.1135308. [DOI] [PubMed] [Google Scholar]
- Kitzmueller E, Krapfenbauer K, Hoeger H, Weitzdoerfer R, Lubec G, Lubec B. Life-long effects of perinatal asphyxia on stress-induced proteins and dynamin 1 in rat brain. Neurochem Res. 2004;29(9):1767–1777. doi: 10.1023/b:nere.0000035813.73790.b5. [DOI] [PubMed] [Google Scholar]
- Koenig JH, Ikeda K. Disappearance and reformation of synaptic vesicle membrane upon transmitter release observed under reversible blockage of membrane retrieval. J Neurosci. 1989;9(11):3844–3860. doi: 10.1523/JNEUROSCI.09-11-03844.1989. [DOI] [PMC free article] [PubMed] [Google Scholar]
- Lange C, Silverman EK, Xu X, Weiss ST, Laird NM. A multivariate family-based association test using generalized estimating equations: FBAT-GEE. Biostatistics. 2003;4(2):195–206. doi: 10.1093/biostatistics/4.2.195. [DOI] [PubMed] [Google Scholar]
- Li MD. The genetics of nicotine dependence. Current psychiatry reports. 2006;8(2):158–164. doi: 10.1007/s11920-006-0016-0. [DOI] [PubMed] [Google Scholar]
- Li MD, Cheng R, Ma JZ, Swan GE. A meta-analysis of estimated genetic and environmental effects on smoking behavior in male and female adult twins. Addiction. 2003;98(1):23–31. doi: 10.1046/j.1360-0443.2003.00295.x. [DOI] [PubMed] [Google Scholar]
- Mokdad AH, Marks JS, Stroup DF, Gerberding JL. Actual causes of death in the United States, 2000. JAMA. 2004;291(10):1238–1245. doi: 10.1001/jama.291.10.1238. [DOI] [PubMed] [Google Scholar]
- Nackley AG, Shabalina SA, Tchivileva IE, Satterfield K, Korchynskyi O, Makarov SS, et al. Human catechol-O-methyltransferase haplotypes modulate protein expression by altering mRNA secondary structure. Science. 2006;314(5807):1930–1933. doi: 10.1126/science.1131262. [DOI] [PubMed] [Google Scholar]
- Nyholt DR. A simple correction for multiple testing for single-nucleotide polymorphisms in linkage disequilibrium with each other. Am J Hum Genet. 2004;74(4):765–769. doi: 10.1086/383251. [DOI] [PMC free article] [PubMed] [Google Scholar]
- O’Connell JR, Weeks DE. PedCheck: a program for identification of genotype incompatibilities in linkage analysis. Am J Hum Genet. 1998;63(1):259–266. doi: 10.1086/301904. [DOI] [PMC free article] [PubMed] [Google Scholar]
- Powell KA, Robinson PJ. Dephosphin/dynamin is a neuronal phosphoprotein concentrated in nerve terminals: evidence from rat cerebellum. Neuroscience. 1995;64(3):821–833. doi: 10.1016/0306-4522(94)00337-5. [DOI] [PubMed] [Google Scholar]
- Praefcke GJ, McMahon HT. The dynamin superfamily: universal membrane tubulation and fission molecules? Nat Rev Mol Cell Biol. 2004;5(2):133–147. doi: 10.1038/nrm1313. [DOI] [PubMed] [Google Scholar]
- Schmid SL, McNiven MA, De Camilli P. Dynamin and its partners: a progress report. Curr Opin Cell Biol. 1998;10(4):504–512. doi: 10.1016/s0955-0674(98)80066-5. [DOI] [PubMed] [Google Scholar]
- Sontag JM, Fykse EM, Ushkaryov Y, Liu JP, Robinson PJ, Sudhof TC. Differential expression and regulation of multiple dynamins. J Biol Chem. 1994;269(6):4547–4554. [PubMed] [Google Scholar]
- Stolerman IP, Jarvis MJ. The scientific case that nicotine is addictive. Psychopharmacology (Berl) 1995;117(1):2–10. doi: 10.1007/BF02245088. discussion 14–20. [DOI] [PubMed] [Google Scholar]
- Swan GE, Hudmon KS, Jack LM, Hemberger K, Carmelli D, Khroyan TV, et al. Environmental and genetic determinants of tobacco use: methodology for a multidisciplinary, longitudinal family-based investigation. Cancer Epidemiol Biomarkers Prev. 2003;12(10):994–1005. [PMC free article] [PubMed] [Google Scholar]
- Swan GE, Lessov CN. Gene-environment interaction in nicotine addiction: the need for a large-scale, collaborative effort. Subst Use Misuse. 2004;39(10–12):2083–2085. [PubMed] [Google Scholar]
- Torre E, McNiven MA, Urrutia R. Dynamin 1 antisense oligonucleotide treatment prevents neurite formation in cultured hippocampal neurons. J Biol Chem. 1994;269(51):32411–32417. [PubMed] [Google Scholar]
- USDHHS. Reducing tobacco use: A report of the Surgeon General. US Department of Health & Human Services, Center for Disease Control and Prevention, National Center for Chronic Disease Prevention and Health Promortion; Atlanta, Georgia: 2000. [Google Scholar]
- Wang J, Gutala R, Hwang YY, Kim JM, Konu O, Ma JZ, et al. Strain- and region-specific gene expression profiles in mouse brain in response to chronic nicotine treatment. Genes Brain Behav. 2008;7:78–87. doi: 10.1111/j.1601-183X.2007.00328.x. [DOI] [PubMed] [Google Scholar]
- WHO. The World Health Report 2002. World Health Organization; 2002. [Google Scholar]
- Yamashita T, Hige T, Takahashi T. Vesicle endocytosis requires dynamin-dependent GTP hydrolysis at a fast CNS synapse. Science. 2005;307(5706):124–127. doi: 10.1126/science.1103631. [DOI] [PubMed] [Google Scholar]
- Yampolsky LY, Kondrashov FA, Kondrashov AS. Distribution of the strength of selection against amino acid replacements in human proteins. Human molecular genetics. 2005;14(21):3191–3201. doi: 10.1093/hmg/ddi350. [DOI] [PubMed] [Google Scholar]