

Abstract
Introduction
Lower leg bowing with tibial pseudarthrosis is associated with neurofibromatosis type 1 (NF1). The objective of the study is to determine if the geometry of the lower limb in individuals with neurofibromatosis type 1 (NF1) differs from controls, and to characterize the osseous components of the tibia in NF1.
Methods
Peripheral quantitative computed tomography (pQCT) of the lower limb was performed (90 individuals with NF1 without tibial and/or fibular dysplasia: 474 healthy individuals without NF1). Subjects were 4–18 years of age. Individuals with NF1 were compared to controls using an analysis-of-covariance with a fixed set of covariates (age, weight, height, Tanner stage, and gender).
Results
Using pQCT, NF1 individuals without bowing of the lower leg have smaller periosteal circumferences (p<0.0001), smaller cortical area (p<0.0001), and decreased tibial cortical and trabecular bone mineral content (BMC) (p<0.0001) compared to controls.
Discussion
Individuals with NF1 have a different geometry of the lower leg compared to healthy controls suggesting that NF1 haploinsufficiency impacts bone homeostasis although not resulting in overt anterolateral bowing of the lower leg.
Keywords: neurofibromatosis type 1, tibia, peripheral quantitative computed tomography, bone, bone mineral content
Introduction
Neurofibromatosis type 1 (NF1) is an autosomal dominant condition due to mutations in the NF1 gene located on chromosome 17 (reviewed in Viskochil, 2002) [1]. The NF1 gene product encodes neurofibromin, which has tumor suppressor properties that explains the pathophysiology of neurofibromas. However, the clinical phenotype of NF1 is not restricted to tumorigenesis. In particular, skeletal abnormalities are observed in individuals with NF1, although the osseous phenotype of NF1 is variable even between family members. The classical skeletal dysplasias observed in NF1 include long bone dysplasia, sphenoid wing dysplasia, and short-angled dystrophic scoliosis which can include spinal canal widening, vertebral body narrowing, rib-penciling, and vertebral scalloping [2–5]. Long bone dysplasia observed in NF1 typically affects the tibia, although other long bones can be dysplastic. Anterolateral bowing of the lower leg often precedes fracture and non-union, defined as pseudarthrosis [2,4]. Other osseous abnormalities are also observed and include short stature for familial background, bone overgrowth, bone cysts, increased dental caries, osteopenia, and non-dystrophic scoliosis. The skeletal abnormalities are a key component in the clinical diagnosis of individuals with NF1 [6–8], and skeletal abnormalities taken as a whole are quite common in NF1 [5].
The classic skeletal dysplasias of NF1 are localized (long bone dysplasia, sphenoid wing dysplasia, and dystrophic scoliosis) and usually unilateral (long bone dysplasia and sphenoid wing dysplasia) suggesting a random “second event” such as a somatic mutation of NF1 or other modifiers. Double inactivation of NF1 has been observed in the tibial pseudarthrosis tissue of 2 individuals with NF1 [9], giving credence to the role of a “second event” for the development of the localized skeletal dysplasias observed in NF1. However, there is evidence that NF1 haploinsufficiency also has osseous implications. NF1 individuals have been reported to have dental abnormalities with periapical cemental dysplasia in 35% of adult women with NF1 [10], and increased dental caries in individuals with NF1 [11]. Decreased bone mineral density (BMD) and bone mineral content (BMC) have also been reported in several studies [12–18]. It is likely that double inactivation of NF1 does not explain the generalized increase in dental caries, early tooth eruption, non-endocrine short stature, and generalized decrease in bone mineral density in individuals with NF1, and we hypothesize that NF1 haploinsufficiency plays a role in these generalized osseous manifestations.
The geometry of the long bones in NF1 has not been well elucidated. Given that the tibia is the most commonly affected long bone in NF1, the current study focuses on characterizing the osseous geometry of the tibia in NF1 individuals. The bowing of the long bone likely results in altered stress strain distribution potentially increasing the risk of fracture. However, there is little information on why NF1 children with long bone bowing and fracture progress to non-union, while NF1 children without long bone bowing do not in general sustain long bone fractures progressing to non-union. The geometry of the lower leg, both the osseous and muscular compartment, in individuals without tibial and/or fibular dysplasia may provide clues to the potential effects of NF1 haploinsufficieny on bone.
In order to characterize the architecture of the lower leg in individuals with NF1, a comparison of the non-dominant tibia utilizing peripheral quantitative computed tomography (pQCT) in NF1 individuals versus healthy controls was utilized. PQCT imaging was selected, as it is a modality that allows for the measurement of bone size, geometry, volumetric density, and strength with separation of the bone and muscle compartments [19].
Materials and Methods
Peripheral Quantitative Computed Tomography (pQCT)
Patients
Individuals with NF1 were recruited from an NF1 clinic and NF1 Registry at the University of Utah. Medical histories were obtained and physical examinations performed on all enrollees. Only individuals who fulfilled the NF1 diagnostic criteria were included as cases [6,7]. A total of 97 individuals with NF1 (ages 4–18) were recruited over the years 2003–2007. Controls consisted of a reference group of 474 healthy children without NF1 collected by the Center for Pediatric Nutrition Research at the University of Utah enrolled over the years 2000–2007. Controls were recruited from the same geographic area as individuals with NF1. Given that controls were recruited from a pediatric center, NF1 cases were also restricted to a pediatric population. Children <4 years old were not included due to difficulty in cooperating in the imaging procedures.
Information from medical histories of both NF1 individuals and controls included fracture history, medication use, handedness, and pubertal maturation. Pubertal maturation was determined by self-reported questionnaire using Tanner stage criteria based on breast/areolar development for girls and testicular development for boys [20]. Past-year physical activity was obtained by questionnaire [21]. Individuals with other chronic illnesses known to influence bone health (e.g. conditions requiring systemic glucocorticoids, recent fracture, anorexia, pregnancy, lactation, oral contraception or any hormone replacement) were excluded. Growth parameters were assessed by measuring height without shoes using a Seca height-Rite Stadiometer (Model 225, Culver City, California), and measuring weight by digital scale (Scan-Tronix Stand on Scale, Model 5002, Carol Stream, Illinois).
Skeletal dysplasia status was assessed by physical examination, medical history, and review of medical records on all individuals with NF1. NF1 individuals with tibial and/or fibular dysplasia or complications were excluded.
This study was approved by the Institutional Review Board at the University of Utah, and informed consent was obtained on all participants.
Imaging Procedures (pQCT)
Three cross-sectional slices of the non-dominant leg in individuals with NF1 and controls were measured by pQCT (XCT-2000; Stratec Medical Systems/Orthometrix, White Plains, NY) at relative distances of 4%, 38%, and 66% from the distal tibial growth plate (Fig. 1). Dominance of the leg was based on self-reported handedness. The distal end of the medial malleolus and the internal point of articulation at the knee were marked with an erasable pen. Distance between the two marks were measured in triplicate and recorded, and the two measurements that were within 2 mm of each other were averaged. Measurement of the 66% tibial site was obtained by calculating 66% of the average total length measurement of the leg and marked with erasable pen. Placing the non-dominant leg through the pQCT gantry, the pQCT laser was aligned with the distal reference mark (medial malleolus) on the tibia. A scout scan, taking approximately 1 minute, was performed to determine the position of the endplate and placement of the reference line in the distal tibia. The reference line was placed at the most proximal line to the distal growth plate or at the endplate if the growth plate was fused. Once the reference line was defined, the scanner automatically measured the calculated 4% and 38% tibial sites. Then the leg was manually slid back to the marked 66% tibial site and scanned. The scanning time took approximately 2 minutes for each site measurement. The 4% tibial cross-sectional site was used to determine trabecular BMD (mg/cm3). The 38% and 66% cross-sectional sites were used to determine cortical BMD and BMC as well as the bone geometry properties. Imaging was performed by a densitometry technologist certified by the International Society for Clinical Densitometry.
Fig. 1.
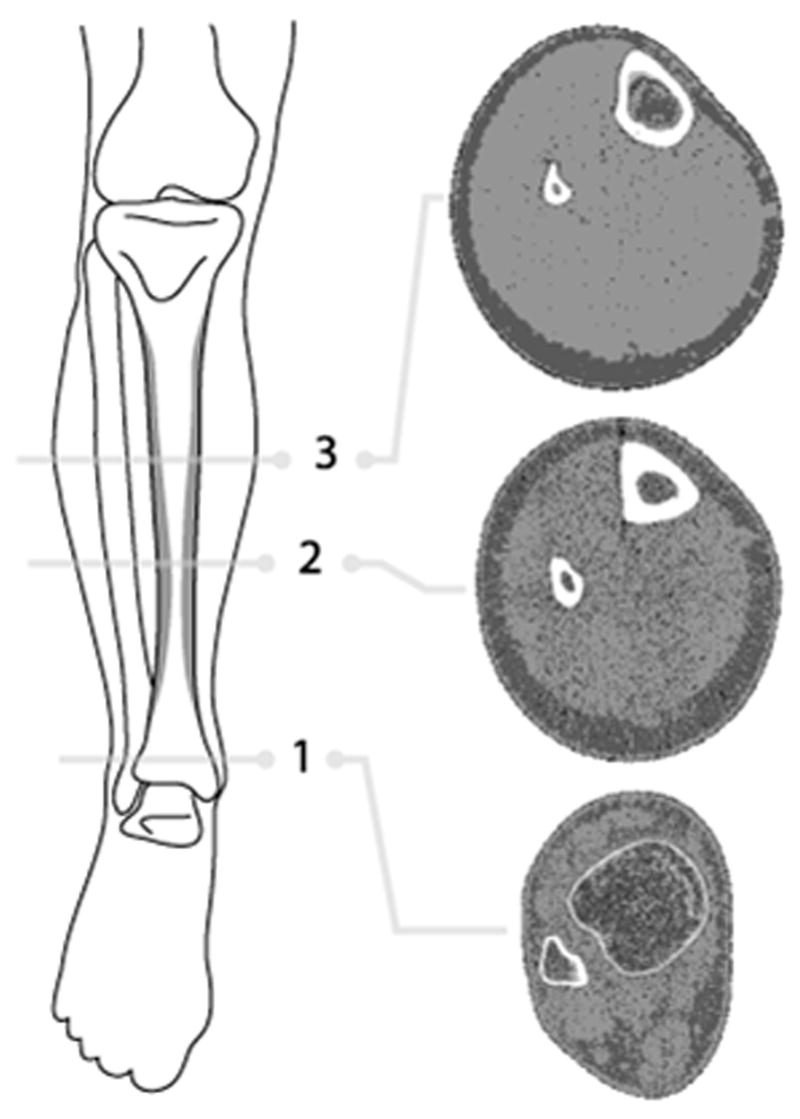
Illustration of the lower leg showing regions where pQCT images were obtained. Three cross-sectional slices of the non-dominant leg in individuals with NF1 and controls were measured at relative distances of (1) 4%, (2) 38%, and (3) 66% from the distal tibial growth plate. The three radiographic images (located on the right of the figure) are examples of pQCT images from a healthy control individual at each respective leg site.
Scans were analyzed utilizing XCT software version 5.50c. Slice thickness was 2.3mm. The 4% tibial site analysis was based on 0.4mm voxel size, with a threshold of 169 mg/cc, contour mode = 1, peel mode = 1, with the filter on. The 38% tibial site analysis was based on 0.4mm voxel size, with a cortical bone threshold of 711 mg/cc and cort mode = 1. The 66% tibial site analysis was based on 0.8mm voxel size, with a cortical threshold of 711 mg/cc and cort mode = 1. The contour mode defines the bone edge, and the peel mode defines the trabecular area. The thresholds used were recommended by the manufacturer.
Statistical Analyses
NF1 without tibial and/or fibular dysplasia vs. controls
The non-dominant leg, imaged by pQCT, was compared between NF1 individuals without tibial and/or fibular dysplasia and data from local controls without NF1. The comparison of various pQCT bone variables between groups was adjusted for gender, age, Tanner stage, weight and height using analysis-of-covariance. The primary focus was on the separate differences of each outcome measure; therefore, statistical tests were not subject to multiple comparison adjustment.
Results
Peripheral Quantitative Computed Tomography (pQCT)
Within the NF1 cohort of 97 individuals, 7 individuals had an orthopedic abnormality of the lower leg (1 with unilateral tibial and fibular pseudarthrosis, 1 with unilateral tibial dysplasia without tibial pseudarthrosis but with fibular pseudarthrosis, 2 with unilateral tibial and fibular dysplasia without pseudarthrosis, 1 with bilateral tibial and fibular dysplasia without pseudarthrosis, 1 with fibular bone cyst, and 1 with bilateral tibial torsion). These individuals were excluded from the analysis of NF1 without tibial and/or fibular dysplasia vs. controls
Anthropometric and demographic data are listed in Table 1. The vast majority of individuals in both the NF1 and control groups were Caucasian given the demographics of the recruitment area (NF1 individuals: 93.3% Caucasian; controls: 93.7% Caucasian).
Table 1.
Anthropometric and Demographic Data on NF1 versus Controls
| Variable | NF1 Individuals | Healthy Controls | p-value | ||||
|---|---|---|---|---|---|---|---|
| Mean | Standard Deviation | N | Mean | Standard Deviation | N | ||
| Age | 10.0 | 4.1 | 90 | 11.6 | 4.2 | 475 | p=0.001 |
| Height (cm) | 131.4 | 20.0 | 90 | 145.3 | 22.2 | 470 | p<0.001 |
| Weight (kg) | 33.4 | 16.3 | 90 | 43.9 | 20.6 | 469 | p<0.001 |
| Variable | # NF1 Individuals | # Healthy Controls |
|---|---|---|
| Gender (Chi-square Test p=0.108) | ||
| Female | 40 | 255 |
| Male | 50 | 220 |
| Tanner Stage (Wilcoxon-Mann-Whitney Test p=0.011) | (Median=1) | (Median=2) |
| 1 | 52 | 217 |
| 2 | 13 | 60 |
| 3 | 6 | 48 |
| 4 | 12 | 62 |
| 5 | 7 | 87 |
Questionnaires for past-year physical activity estimation measuring the metabolic equivalent (MET) were returned by only 45 NF1 individuals and 244 controls [mean for individuals with NF1 = 30 MET/week (range 4–118; median 25; n=45); mean for individuals without NF1 = 38 MET/week (range 0–317; median 25; n=244)].
NF1 individuals without tibial and/or fibular dysplasia had statistically significant differences compared to healthy controls in numerous variables of the lower leg as measured by pQCT (Table 2). Upon initial evaluation, only 2 of the selected measures (cortical BMD at the 66% tibial site, and cortical BMD at the 38% tibial site) showed no significant differences, while all others showed strong differences with higher measured values in the control group. When the means were adjusted for covariates (age, gender, Tanner stage, height, and weight), group differences were no longer evident in tibial length (p=0.12), cortical thickness at the 66% distal tibial site (p=0.11), and endosteal circumference at the 38% tibial site (p=0.38), while cortical BMD at the 38% and 66% tibial site now showed slightly stronger differences between groups (p=0.15 and p=0.06 respectively).
Table 2.
pQCT Tibial Bone Measurements (NF1 versus Controls)*
| Variable | NF1 Individuals
|
Healthy Controls
|
p-value | ||||
|---|---|---|---|---|---|---|---|
| LS Mean | Adjusted SE | N | LS Mean | Adjusted SE | N | ||
| 4% Tibial Site | |||||||
| Total Area (mm2) | 893 | 15.1 | 86 | 941 | 8.9 | 341 | p<0.0001 |
| Total BMD (mg/cm3) | 259 | 3.9 | 86 | 280 | 2.3 | 341 | p<0.0001 |
| Total BMC (mg/mm) | 245 | 4.9 | 86 | 272 | 2.9 | 341 | p<0.0001 |
| Trabecular Area (mm2) | 404 | 6.8 | 86 | 430 | 4.0 | 341 | p<0.0001 |
| Trabecular BMD (mg/cm3) | 211 | 3.8 | 86 | 237 | 2.2 | 341 | p<0.0001 |
| Trabecular BMC (mg/mm) | 89 | 2.4 | 86 | 104 | 1.4 | 341 | p<0.0001 |
|
| |||||||
| 38% Tibial Site | |||||||
| Total Tibial Area (mm2) | 241 | 5.0 | 90 | 256 | 5.4 | 97 | p<0.0001 |
| Cortical Thickness (mm) | 3.86 | 0.08 | 90 | 3.92 | 0.09 | 100 | p=0.4959 |
| Periosteal circumference (mm) | 53.97 | 0.54 | 90 | 55.19 | 0.59 | 100 | p<0.0001 |
| Endosteal circumference (mm) | 29.71 | 0.85 | 90 | 30.54 | 0.92 | 100 | p=0.3804 |
| Cortical Area (mm2) | 167 | 3.2 | 90 | 178 | 3.4 | 100 | p<0.0001 |
| Cortical BMD (mg/cm3) | 1081 | 5.8 | 90 | 1071 | 6.3 | 100 | p=0.1514 |
| Cortical BMC (mg/mm) | 184 | 3.6 | 90 | 195 | 3.9 | 100 | p<0.0001 |
| Strength Strain Index (mm3) | 765 | 21.2 | 90 | 834 | 23 | 100 | p<0.0001 |
|
| |||||||
| 66% Tibial Site | |||||||
| Total Tibial Area (mm2) | 376 | 6.5 | 89 | 403 | 3.8 | 452 | p<0.0001 |
| Cortical Thickness (mm) | 3.21 | 0.05 | 89 | 3.29 | 0.03 | 452 | p=0.1119 |
| Periosteal circumference (mm) | 67.53 | 0.54 | 89 | 69.79 | 0.32 | 452 | p<0.0001 |
| Endosteal circumference (mm) | 47.42 | 0.66 | 89 | 49.14 | 0.38 | 452 | p<0.0001 |
| Cortical Area (mm2) | 191 | 2.9 | 89 | 204 | 1.7 | 452 | p<0.0001 |
| Cortical BMD (mg/cm3) | 1031 | 3.5 | 89 | 1024 | 2.0 | 452 | p=0.0558 |
| Cortical BMC (mg/mm) | 201 | 3.2 | 89 | 213 | 1.9 | 452 | p<0.0001 |
| Strength Strain Index (mm3) | 1194 | 30.5 | 89 | 1298 | 17.8 | 452 | p=0.0002 |
|
| |||||||
| Tibial length (mm) | 315 | 1.7 | 90 | 317 | 1.0 | 475 | p=0.1167 |
Comparison of the bone variables from pQCT imaging of the tibia at relative distances from the distal tibial growth plate between NF1 individuals and controls was adjusted for gender, Tanner stage, weight, height, and age using analysis-of-covariance with a fixed set of covariates. (LS=least squares; pQCT=peripheral quantitative computed tomography; BMD= volumetric bone mineral density; BMC=bone mineral content; SE=standard error).
Decreased muscle mass and Strength Strain Index was previously reported in 40 NF1 individuals utilizing pQCT [22]. The current analysis of the muscular compartments includes these individuals with a larger expanded cohort (NF1 individuals=71; controls=448). After adjusting for age, gender, height, weight and Tanner stage, the muscle cross-sectional area [NF1: least squares (LS) mean = 4096 mm2 with a standard error (SE) of 89; controls: LS mean = 4413 mm2 (SE = 47); p=0.0008], muscle and bone cross-sectional area [NF1: LS mean = 4691 mm2 (SE = 114); controls: LS mean = 4966 mm2 (SE = 61); p=0.02], and the total area at the 66% tibial site [NF1: LS mean = 6509 mm2 (SE = 136); controls: LS mean = 7177 mm2 (SE = 72); p<0.0001] were decreased. The ratio of the LS mean muscle cross-sectional area to total area at the 66% tibial site was 0.63 for NF1 individuals and 0.62 for controls. To assess muscle-bone relationships a ratio using the LS mean of the cortical BMC/muscle cross-sectional area at the 66% tibial site was calculated and the ratios were similar in both groups (NF1=0.049; controls=0.048).
Discussion
These data demonstrate that NF1 individuals without anterolateral bowing of the lower leg have a different tibial geometry. The smaller periosteal circumferences and endosteal circumferences at the 66% tibial site with equivalent tibial lengths in individuals with NF1 after adjusting for height, weight, age, gender, and Tanner stage, shows that NF1 individuals have narrower bones at the tibial diaphyseal site.
The trabecular BMC and BMD at the distal tibial metaphyseal site were decreased in NF1 individuals, which is in concert with a previous report of decreased BMC in other body regions containing a large amount of trabecular bone (i.e. proximal femur and lumbar spine) using DXA in an overlapping cohort [12]. In a study of 73 NF1 individuals by Brunetti Pierrie et al., BMD was most severely affected in the lumbar spine, and vertebral biopsies from 3 NF1 individuals with scoliosis showed a marked reduction in the number and thickness of the bony trabecula [18].
The cortical thickness in the NF1 individuals without tibial and/or fibular dysplasia was not significantly different from controls at the 38% and 66% tibial site. The cortical BMD values for the NF1 individuals are greater than controls despite less mineral, although not statistically significant (p>.05). BMD is difficult to interpret secondary to a partial volume effect which may be more pronounced in children with smaller bones [23,24,25].
NF1 individuals with clinical long bone bowing are at risk for fracture and subsequent non-union of the affected long bone [2], but currently there are no data showing increased fractures at other skeletal sites in NF1 individuals with localized long bone bowing. In addition, even though decreased areal BMD and BMC as measured by dual energy x-ray absorptiometry have been observed in children with NF1 without long bone dysplasia [12], there are no published reports of an association of increased fracture rates in the general NF1 population without a localized long bone dysplasia. BMD alone is not necessarily the best predictor of fracture risk or structural strength, and bone is a 3-dimensional object in which the material composition and structure combined impart stiffness and flexibility [26,27,28]. The size and architecture of the long bones are important when determining strength and the response to mechanical forces. Focusing solely on BMD and BMC may be inappropriate in the context of NF1. A decreased Strength Strain Index (which relates to the bending and torsional strength of tubular bone) was confirmed in the expanded cohort of NF1 individuals without tibial and/or fibular dysplasia suggesting that NF1 individuals without anterolateral bowing of the lower leg may be at an increased risk for tibial fractures.
Decreased muscle mass was seen in individuals with NF1. The observation of similar cortical BMC/muscle cross-sectional area ratios at the 66% tibial site suggests that NF1 individuals have appropriate tibial cortical BMC for muscle mass. Based on the “functional muscle-bone-unit” diagnostic algorithm the decreased cortical BMC is due to a secondary bone disease [24,25,29]. Potential explanations for the decrease in muscle mass include reduced nutrient intake, decreased activity, etc. The mean activity levels were decreased in NF1 individuals, but the number of NF1 individuals and controls who completed the past-year physical activity estimation questionnaires was lacking and further investigation on the effects of decreased physical activity in NF1 is needed. Investigation of the effect of exercise including jumping mechanography may help elucidate if bones in individuals with NF1 are less responsive to loading as based on the “mechanostat” theory [30].
Arguably, NF1 haploinsufficiency has in part some effect on bone development. Previous data on double inactivation of NF1 in human tibial pseudarthrosis tissue [9], and anterolateral bowing of the tibia in mice lacking neurofibromin in undifferentiated mesenchymal cells of the developing limb (Nf1Prx1) [31] give credence to the hypothesis that double inactivation of NF1 contributes to the development of localized anterolateral bowing and pseudarthrosis. However, in humans, only pseudarthrosis tissue has been examined for double inactivation of NF1, and it is not known if individuals with anterolateral bowing without pseudarthrosis harbor a somatic mutation of NF1 in a subset of osteoprogenitor cells at the tibial site leading to the localized dysplasia. Still it is likely that NF1 haploinsufficiency has a different effect on bone homeostasis than double inactivation of NF1.
These data provide some information on the geometric differences of the tibia in NF1 individuals without long bone bowing of the lower leg. Little information is available on the microarchitecture of bone in individuals with NF1 [18], and histomorphometric analysis of tibial samples from humans with NF1 will be necessary for correlation with the animal studies and the pQCT findings we describe in our study. Expanded efforts to systematically collect and analyze bone specimens from individuals with NF1 will help to elucidate the microarchitecture of bones in NF1 with the hope of understanding the development of long bone bowing and subsequent propensity for fracture and non-union.
Acknowledgments
We would like to acknowledge investigators and staff at the University of Utah (Stacy Maxwell, Diane Hartford, Amy Watkins, Bronte Clifford, and Ann Rutherford), the Shriners Hospitals for Children, Salt Lake City (Dr. James Roach, Jeanne Siebert, Susan Geyer, Janice Davis, and Meredith Winn), the University of Manchester (Dr. Zulf Mughal, Dr. Kate Ward, Judith Eelloo, Dr. Judith Adams, Dr. Gareth Evans, Dr. Susan Huson), Cincinnati Children’s Hospital Medical Center (Dr. Alvin Crawford, Dr. Heidi Kalkwarf, Martha Walker, Donna Buckley), the University of British Columbia (Dr. Linlea Armstrong, Dr. J. Friedman, Patricia Birch, Deetria Egeli, Dr. Heather McKay, Melanie Burrows), and Dr. Heather Macdonald (University of Calgary), for their help, discussion, and insight. We would also like to acknowledge the Centre for Hip Health and Musculoskeletal Diseases at Vancouver Coastal Health Research Institute, University of British Columbia, and the Center for Pediatric Nutrition Research at the University of Utah for their facilities and expertise. We thank Dr. Aaron Stevenson for his assistance with the figure. We thank the participants and their families. This research was carried out with support from a Public Health Services research grant #M01-RR00064 from the National Center for Research Resources, research grant #1 K23 NS052500 and #R01 NS050509 from the National Institute of Neurological Disorders and Stroke, Shriners Hospitals for Children, the Children’s Health Research Center at the University of Utah, the Clinical Genetics Research Program at the University of Utah, and the Primary Children’s Research Foundation.
Footnotes
Publisher's Disclaimer: This is a PDF file of an unedited manuscript that has been accepted for publication. As a service to our customers we are providing this early version of the manuscript. The manuscript will undergo copyediting, typesetting, and review of the resulting proof before it is published in its final citable form. Please note that during the production process errors may be discovered which could affect the content, and all legal disclaimers that apply to the journal pertain.
References
- 1.Viskochil D. Genetics of neurofibromatosis 1 and the NF1 gene. J Child Neurol. 2002;17:562–70. doi: 10.1177/088307380201700804. [DOI] [PubMed] [Google Scholar]
- 2.Stevenson DA, Birch PH, Friedman JM, Viskochil DH, Balestrazzi P, Buske A, Korf BR, Niimura M, Pivnick EK, Schorry EK, Short MP, Tenconi R, Tonsgard JH, Carey JC. Descriptive analysis of tibial pseudarthrosis in patients with neurofibromatosis 1. Am J Med Genet. 1999;84:413–9. doi: 10.1002/(sici)1096-8628(19990611)84:5<413::aid-ajmg5>3.0.co;2-1. [DOI] [PubMed] [Google Scholar]
- 3.Vitale MG, Guha A, Skaggs DL. Orthopaedic manifestations of neurofibromatosis in children: an update. Clin Orthop. 2002;401:107–18. doi: 10.1097/00003086-200208000-00013. [DOI] [PubMed] [Google Scholar]
- 4.Friedman JM, Birch PH. Type 1 Neurofibromatosis: A descriptive analysis of the disorder in 1728 patients. Am J Med Genet. 1997;70:138–43. doi: 10.1002/(sici)1096-8628(19970516)70:2<138::aid-ajmg7>3.0.co;2-u. [DOI] [PubMed] [Google Scholar]
- 5.Crawford AH, Schorry EK. Neurofibromatosis in children; the role of the orthopaedist. J Am Academy of Orthopaedic Surgeons. 1999;7:217–30. doi: 10.5435/00124635-199907000-00002. [DOI] [PubMed] [Google Scholar]
- 6.Stumpf DA, Alksne JF, Annegers JF, Brown SS, Conneally PM, Housman D, Leppert MF, Miller JP, Moss ML, Pileggi AJ, Rapin I, Strohman RC, Swanson LW, Zimmerman A. Neurofibromatosis conference statement national institutes of health consensus development conference. Arch Neurol. 1988;45:575–8. [PubMed] [Google Scholar]
- 7.Gutmann DH, Aylsworth A, Carey JC, Korf B, Marks J, Pyeritz RE, Rubenstein A, Viskochil D. The diagnostic evaluation and multidisciplinary management of neurofibromatosis 1 and neurofibromatosis 2. JAMA. 1997;278:51–57. [PubMed] [Google Scholar]
- 8.Stevenson DA, Viskochil DH, Schorry EK, Crawford AH, D’Astous J, Murray KA, Friedman JM, Armstrong L, Carey JC. The use of anterolateral bowing of the lower leg in the diagnostic criteria for neurofibromatosis type 1. Genet Med. 2007;9:409–412. doi: 10.1097/GIM.0b013e3180986e05. [DOI] [PMC free article] [PubMed] [Google Scholar]
- 9.Stevenson DA, Zhou H, Ashrafi S, Messiaen LM, Carey JC, D’Astous JL, Santora SD, Viskochil DH. Double inactivation of NF1 in tibial pseudarthrosis. Am J Hum Genet. 2006;79:143–148. doi: 10.1086/504441. [DOI] [PMC free article] [PubMed] [Google Scholar]
- 10.Visnapuu V, Peltonen S, Ellilä T, Kerosuo E, Väänänen K, Happonen RP, Peltonen J. Periapical cemental dysplasia is common in women with NF1. Eur J Med Genet. 2007;50:274–80. doi: 10.1016/j.ejmg.2007.04.001. [DOI] [PubMed] [Google Scholar]
- 11.Tucker T, Birch P, Savoy DM, Friedman JM. Increased dental caries in people with neurofibromatosis 1. Clin Genet. 2007;72:524–527. doi: 10.1111/j.1399-0004.2007.00886.x. [DOI] [PubMed] [Google Scholar]
- 12.Stevenson DA, Moyer-Mileur LJ, Murray M, Slater H, Sheng X, Carey JC, Dube B, Viskochil DH. Bone mineral density in children and adolescents with neurofibromatosis type 1. J Pediatr. 2007;150:83–88. doi: 10.1016/j.jpeds.2006.10.048. [DOI] [PMC free article] [PubMed] [Google Scholar]
- 13.Illes T, Halmai V, de Jonge T, Dubousset J. Decreased bone mineral density in neurofibromatosis-1 patients with spinal deformities. Osteoporos Int. 2001;12:823–7. doi: 10.1007/s001980170032. [DOI] [PubMed] [Google Scholar]
- 14.Kuorilehto T, Pöyhönen M, Bloigu R, Heikkinen J, Väänänen K, Peltonen J. Decreased bone mineral density and content in neurofibromatosis type 1: lowest local values are located in the load-carrying parts of the body. Osteoporos Int. 2004;16:928–36. doi: 10.1007/s00198-004-1801-4. [DOI] [PubMed] [Google Scholar]
- 15.Lammert M, Kappler M, Mautner VF, Lammert K, Störkel S, Friedman JM, Atkins D. Decreased bone mineral density in patients with neurofibromatosis 1. Osteoporos Int. 2005;16:1161–6. doi: 10.1007/s00198-005-1940-2. [DOI] [PubMed] [Google Scholar]
- 16.Dulai S, Briody J, Schindeler A, North KN, Cowell CT, Little DG. Decreased bone mineral density in neurofibromatosis type 1: results from a pediatric cohort. J Pediatr Orthop. 2007;27:472–475. doi: 10.1097/01.bpb.0000271310.87997.ae. [DOI] [PubMed] [Google Scholar]
- 17.Yilmaz K, Ozmen M, Bora Goksan S, Eskiyurt N. Bone mineral density in children with neurofibromatosis 1. Acta Paediatr. 2007;96:1220–1222. doi: 10.1111/j.1651-2227.2007.00401.x. [DOI] [PubMed] [Google Scholar]
- 18.Brunetti-Pierri N, Doty SB, Hicks J, Phan K, Mendoza-Londono R, Blazo M, Tran A, Carter S, Lewis RA, Plon SE, Phillips WA, O’Brian Smith E, Ellis KJ, Lee B. Generalized metabolic bone disease in Neurofibromatosis type 1. Mol Genet Metab. 2008;94:105–111. doi: 10.1016/j.ymgme.2007.12.004. [DOI] [PMC free article] [PubMed] [Google Scholar]
- 19.Siu WS, Qin L, Leung KS. pQCT bone strength index may serve as a better predictor than bone mineral density for long bone breaking strength. J Bone Miner Metab. 2003;21:316–322. doi: 10.1007/s00774-003-0427-5. [DOI] [PubMed] [Google Scholar]
- 20.Taylor SJWP, Hindmarsh PC, Lampe F, Odoki K, Cook DG. Performance of a new pubertal self-assessment questionnaire; a preliminary study. Paediatr Perinat Epidemiol. 2001;15:88–94. doi: 10.1046/j.1365-3016.2001.00317.x. [DOI] [PubMed] [Google Scholar]
- 21.Ainsworth BE, Haskell WL, Leon AS, Jacobs DR, Montoye HJ, Sallis JF, et al. Compendium of physical activities: classification of energy cost of human physical activities. Med Sci Sports Exerc. 1993;25:71–80. doi: 10.1249/00005768-199301000-00011. [DOI] [PubMed] [Google Scholar]
- 22.Stevenson DA, Moyer-Mileur LJ, Carey JC, Quick JL, Hoff CJ, Viskochil DH. Case-control study of the muscular compartments and osseous strength in neurofibromatosis type 1 using peripheral quantitative computed tomography. J Musculoskel Neuron Interact. 2005;5:145–149. [PubMed] [Google Scholar]
- 23.Specker BL, Schoenau E. Quantitative bone analysis in children: current methods and recommendations. J Pediatr. 2005;146:726–31. doi: 10.1016/j.jpeds.2005.02.002. [DOI] [PubMed] [Google Scholar]
- 24.Schoenau E. The “functional muscle-bone unit”: a two-step diagnostic algorithm in pediatric bone disease. Pediatr Nephrol. 2005;20:356–359. doi: 10.1007/s00467-004-1744-1. [DOI] [PubMed] [Google Scholar]
- 25.Schoenau E. From mechanostat theory to development of the “Functional Muscle-Bone Unit”. J Musculoskelet Neuron Interact. 2005;5:232–238. [PubMed] [Google Scholar]
- 26.Seeman E, Delmas PD. Bone quality – the material and structural basis of bone strength and fragility. N Engl J Med. 2006;354:2250–61. doi: 10.1056/NEJMra053077. [DOI] [PubMed] [Google Scholar]
- 27.Heaney RP. BMD: the problem. Osteoporos Int. 2005;16:1013–5. doi: 10.1007/s00198-005-1855-y. [DOI] [PubMed] [Google Scholar]
- 28.Prentice A, Parsons TJ, Cole TJ. Uncritical use of bone mineral density in absorptiometry may lead to size-related artifacts in the identification of bone mineral determinants. Am J Clin Nutr. 1994;60:837–842. doi: 10.1093/ajcn/60.6.837. [DOI] [PubMed] [Google Scholar]
- 29.Schoenau E, Neu CM, Beck B, Manz F, Rauch F. Bone mineral content per muscle cross-sectional area as an index of the functional muscle-bone unit. J Bone Miner Res. 2002;17:1095–1101. doi: 10.1359/jbmr.2002.17.6.1095. [DOI] [PubMed] [Google Scholar]
- 30.Frost HM. Bone “mass” and the “mechanostat”. A proposal Anat Rec. 1987;219:1–9. doi: 10.1002/ar.1092190104. [DOI] [PubMed] [Google Scholar]
- 31.Kolanczyk M, Kossler N, Kühnisch J, Lavitas L, Stricker S, Wilkening U, Manjubala I, Fratzl P, Sporle R, Herrmann BG, Parada L, Kornak U, Mundlos S. Multiple roles for neurofibromin in skeletal development and growth. Hum Mol Genet. 2007;16:874–886. doi: 10.1093/hmg/ddm032. [DOI] [PubMed] [Google Scholar]