

Abstract
It has been proposed that schizophrenia results partly from altered brain connectivity. Gene microarray analyses performed in gray matter have indicated that several myelin-related genes normally expressed in oligodendrocytes have decreased expression levels in schizophrenia. These data suggest that oligodendrocytes may be involved in the deficits of schizophrenia and may be decreased in number in the disease. The anterior cingulate cortex in particular has been demonstrated to be affected in schizophrenia, with studies reporting altered neuronal arrangement, decreased anisotropy in diffusion tensor images, and hypometabolism. We used a stereologic nearest-neighbor estimator of spatial distribution to investigate oligodendrocytes in the anterior cingulum bundle using postmortem tissue from 13 chronic schizophrenics and 13 age-matched controls. Using a spatial point pattern analysis, we measured the degree of oligodendrocyte clustering by comparing the probability of finding a nearest-neighbor at a given distance in schizophrenics and controls. At the same time, we also estimated the number and density of oligodendrocytes in the region of interest. In the present study, we found no significant differences in the oligodendrocyte distribution or density in the cingulum bundle between the two groups, in contrast to earlier data from the prefrontal subcortical white matter. These results suggest that a more subtle oligodendrocyte or myelin anomaly may underlie the structural deficits observed by brain imaging in the cingulum bundle in schizophrenia.
Keywords: schizophrenia, oligodendrocyte, cingulate gyrus, stereology
Introduction
In recent years, evidence has emerged suggesting that schizophrenia results partly from altered brain connectivity. Several studies have shown increased neuronal density without increased absolute numbers of neurons in a number of cortical areas of persons with schizophrenia, implying that cortical volume is reduced in the disease, possibly because of reduced neuropil [47]. Gross structural abnormalities have also been noted in the corpus callosum [1]. The absence of an obvious neurodegenerative process in schizophrenia contrasts sharply with the pathology of neurons seen in other neurological disorders, such as Parkinson’s disease or Alzheimer’s disease. It has therefore been proposed that it is disorganization of synapses and specific white matter tracts that may result in the functional deficits seen in the disease. In addition, studies performed in the thalamus found people with schizophrenia had decreased levels of phosphatidylcholine, the main membrane lipid, and sphingomyelin and galactocerebroside, major myelin membrane components [42], providing further evidence for a myelin dysfunction in the disease.
Research has thus focused on disruption of white matter tracts as a possible underlying mechanism of schizophrenia. This hypothesis is supported by several studies using the in vivo brain imaging modalities of magnetic transfer imaging (MTI) and diffusion tensor imaging (DTI). Studies comparing magnetic transfer images, which measure protons bound to macromolecules included in cell membranes and myelin, have demonstrated decreased myelin or axonal membrane integrity in the temporal and frontal lobes of persons with schizophrenia [18, 19], which tends to correlate with the severity of negative symptoms [19]. DTI anisotropy, a measure of the directionality of water movement in the spaces between axons, provides an indication of white matter tract directionality and, by measuring the strength of the direction vector of water diffusion, possibly of tract integrity or coherence [13]. Interestingly, in vivo DTI studies have demonstrated decreased anisotropy in several major white matter tracts in persons with schizophrenia [9, 10, 20, 30, 31, 33, 50, 55]. Anisotropy changes in a number of brain areas, including the anterior cingulate gyrus, have been specifically linked to increased impulsivity, a symptom of the disease, in men with schizophrenia [26], and anisotropy reductions in some regions have also been linked to poor outcomes in the disease [35]. Further implicating white matter alterations are PET imaging studies that showed impaired functional connectivity between cortical areas, such as the hippocampus and the dorsolateral prefrontal cortex, in persons with schizophrenia, implying a lack of coordination between areas that are normally active together in the context of specific tasks [34]. PET imaging has recently demonstrated increased relative metabolic rates in white matter in schizophrenia, which may represent white matter inefficiency or defects resulting in increases metabolic needs [11].
Gene expression studies [22] in the dorsolateral prefrontal cortex that found a significant decrease in the expression of six myelin-related genes (MAG, MAL, CNP, HERR3, gelsolin, and transferrin) in postmortem schizophrenic brains support the novel hypothesis that an underlying pathology of myelination plays a role in the development of such abnormalities. These genes are all predominantly expressed in oligodendrocytes. These results, confirmed independently [51] and extended to other brain areas [16], implied that there is a pathology of oligodendrocytes underlying schizophrenia; further linkage studies have also implicated myelin-related loci in the disease [3, 17, 21, 27, 32, 49]. Although gene expression in oligodendrocytes [36] and white matter volume [4] may be affected by some antipsychotic drugs, a recent longitudinal study of white matter volume [57] clearly indicates that white matter abnormalities exist at the first presentation of schizophrenia, before treatment, and then progress. Recent electron microscopy data have further bolstered the hypothesis of oligodendrocyte pathology in schizophrenia, with one group demonstrating apoptotic and irregular oligodendrocytes and damaged myelin sheath lamellae in the prefrontal cortex and caudate nucleus of schizophrenic brains [52]. Postmortem studies have shown fewer oligodendrocytes in the prefrontal cortical layer III of persons with schizophrenia along with diminished white matter [25, 54], as well as lower oligodendrocyte density in Brodmann area 9 layer VI (although not in the underlying white matter [53]).
The anterior cingulate cortex (ACC) has long been an area of interest in schizophrenia. As part of the “limbic” cortex, the ACC has connections with the amygdala, orbitofrontal cortex, and entorhinal cortex. It thus plays a role in conditioned emotional learning, information processing, motivation, and behavior [14]. Changes observed in the ACC in schizophrenia include a thinner cortex and decreased cortical volume [29, 56], decreased gyral volume [2], smaller pyramidal cells [6], altered neuronal arrangement [5], fewer oligodendrocytes [48] and decreased N-acetylaspartate levels [58]. The cingulum bundle is the major coherent white matter tract underlying the ACC, radiating superiorly from the corpus callosum to the cortex of the cingulate gyrus. DTI studies have demonstrated decreased anisotropy in the cingulum bundle of persons with chronic schizophrenia [30, 50, 55]. Additionally, PET studies have shown hypometabolism in the anterior cingulate cortex [23, 24]. Considered together, these data suggest the existence of severe myelin alterations in the ACC that may underlie some of the deficits seen in schizophrenia.
Changes in myelin organization may be reflected by an abnormal distribution of oligodendrocytes in specific axonal pathways, such as the cingulum bundle, that have been shown to be abnormal in schizophrenia[9, 33]. Although in vivo imaging supports this hypothesis, there are limited data on the spatial organization of oligodendrocytes in white matter. Regular and isotropic cellular distributions are by and large not observed in nervous tissue, so estimates of densities or total numbers of glial cells do not reflect their topographical heterogeneity. While often considered less relevant than number or volume, data on spatial organization are crucial for relating morphometric data to information about tissue structure obtained in vivo. Oligodendrocytes in white matter tend to be lined up alongside myelinated axons, delineating the course of white matter tracts through the brain. It is, therefore, specifically the characteristics of oligodendrocyte spatial distribution that may be relevant to the pathophysiology of schizophrenia, particularly in the context of exploring the organizational structure of white matter in order to provide a cellular correlate to the decreased anisotropy observed by DTI. In this study, we have focused on oligodendrocytes in the cingulum bundle, looking for cellular changes in a major white matter tract implicated in schizophrenia. In addition to investigating oligodendrocyte density, we used a second-order stereological technique to provide reliable and accurate estimates of the 3-dimensional spatial distribution of oligodendrocytes, identified by morphological characteristics, in the cingulum bundle.
Materials and Methods
Subjects and tissue preparation
Brains from 13 persons with schizophrenia and 13 controls matched for age (2-sample Student’s t test, p = 0.79, not significant), gender (χ2 = 0.24, p = 0.62, not significant), and postmortem interval (PMI) (two-sample Student’s t test, p = 0.84, not significant) were obtained from the Mount Sinai School of Medicine Brain Bank, with efforts made to obtain cases with the shortest postmortem delays (Table 1). Diagnosis of schizophrenia was made by a team of research neuropsychologists and psychiatrists based on direct structured interviews and/or detailed review of life-time medical and psychiatric records [16]. Patients had all been treated with antipsychotic medications (Table 1), and some patients had been treated with several different medications. Controls were free of psychiatric and neurological illnesses and evidenced no significant neuropathology after detailed examination of the brain [40]. Clinical dementia ratings (CDR) were obtained for all subjects to assess the possible presence and degree of dementia. No case used in the present study had significant senile plaques or neurofibrillary tangles. For each case, the right brain hemisphere was dissected out at autopsy and fixed in cold 4% paraformaldehyde for two weeks. It was then placed in phosphate buffer and blocked at regular intervals using a multi-blade knife specially designed for a stereology-oriented brain bank as previously described [25, 37]. The sliced hemisphere was stored in 10% buffered formalin until sampling. Anterior cingulate gyrus samples approximately 3 cm3 in size were dissected out from the block directly posterior to the genu of the corpus callosum and cut at 50 μm on a cryostat, and every 40th section was mounted on gelatin-coated slides and Nissl-stained with cresyl violet.
Table 1.
Subject sample characteristics
| Case | Age | Gender | PMI | CDR | Cause of Death | Medications |
|---|---|---|---|---|---|---|
| NL1 | 59 | M | 1225 | 0 | Malignant neoplasm | |
| NL2 | 64 | M | 253 | 3 | Acute myocardial infarction | |
| NL3 | 65 | M | 230 | 0 | Cardiac arrest | |
| NL4 | 66 | M | 454 | 1 | Cardiac arrest | |
| NL5 | 70 | M | 1230 | 0.0 | Cardiopulmonary arrest | |
| NL6 | 75 | M | 300 | 0.5 | Myocardial infarction | |
| NL7 | 92 | M | 1201 | 0.5 | Arrhythmia | |
| NL8 | 93 | M | 250 | 0.5 | Acute myocardial infarction | |
| NL9 | 74 | W | 285 | 0 | Cardio pulmonary arrest | |
| NL10 | 75 | W | 390 | 1 | Cardiopulmonary arrest | |
| NL11 | 78 | W | 255 | 1 | Cardiopulmonary arrest | |
| NL12 | 81 | W | 1128 | 0 | Cardiopulmonary arrest/Atherosclerotic heart disease | |
| NL13 | 83 | W | 370 | 0.5 | Cardiopulmonary arrest | |
| SZ1 | 73 | M | 430 | 0 | Cardiopulmonary arrest | Risp |
| SZ2 | 59 | M | 381 | 1 | Pancreatitis | Olan, hal, thior, thio, flu, tri, chlor, per |
| SZ3 | 66 | M | 504 | unknown | Cardiopulmonary arrest | Hal, thior, thio, tri, chlor |
| SZ4 | 73 | M | 525 | 4 | Cardiopulmonary arrest | Risp |
| SZ5 | 82 | M | 683 | 3 | Respiratory failure | Risp |
| SZ6 | 53 | W | 377 | 0.5 | Cardiac arrest | Olan, hal, mol, tri, chlor |
| SZ7 | 59 | W | 1315 | 1 | Cardiopulmonary arrest | Hal, thior, risp, chlor |
| SZ8 | 74 | W | 417 | 2 | Cardiopulmonary arrest | Hal |
| SZ9 | 77 | W | 583 | 3 | Cardiopulmonary arrest | Risp |
| SZ10 | 79 | W | 595 | 4 | Cardiac arrest | Thio |
| SZ11 | 86 | W | 1092 | 4 | Cardiopulmonary arrest | Hal |
| SZ12 | 90 | W | 465 | 0.5 | Cardiopulmonary arrest | Olan, hal, met |
| SZ13 | 89 | W | 578 | 4 | Cardiopulmonary arrest | Met, risp |
SZ, schizophrenic; NL, normal control; PMI, postmortem interval (in minutes); CDR, clinical dementia rating score; Risp. Riperidone; Olan, olanzapine; hal; haloperidol; thior, thioridiazine; thio, thiothixene; flu, fluphenazine; tri, trifluoperazine; chlor, chlorpromazine; per, perphenazine; mol, molindone; met, metoclopramide.
Definition of the region of interest
The human cingulum bundle can be identified in coronal Nissl-stained sections as a clearly darker band within the white matter of the anterior cingulate gyrus, directly adjacent to the gray matter of the gyrus immediately superior to the corpus callosum (Fig. 1). Our analysis was limited to sampling the anterior segment of the cingulum bundle where it runs parallel to the dorsal (postgenual) portion of the anterior cingulate cortex.
Figure 1.
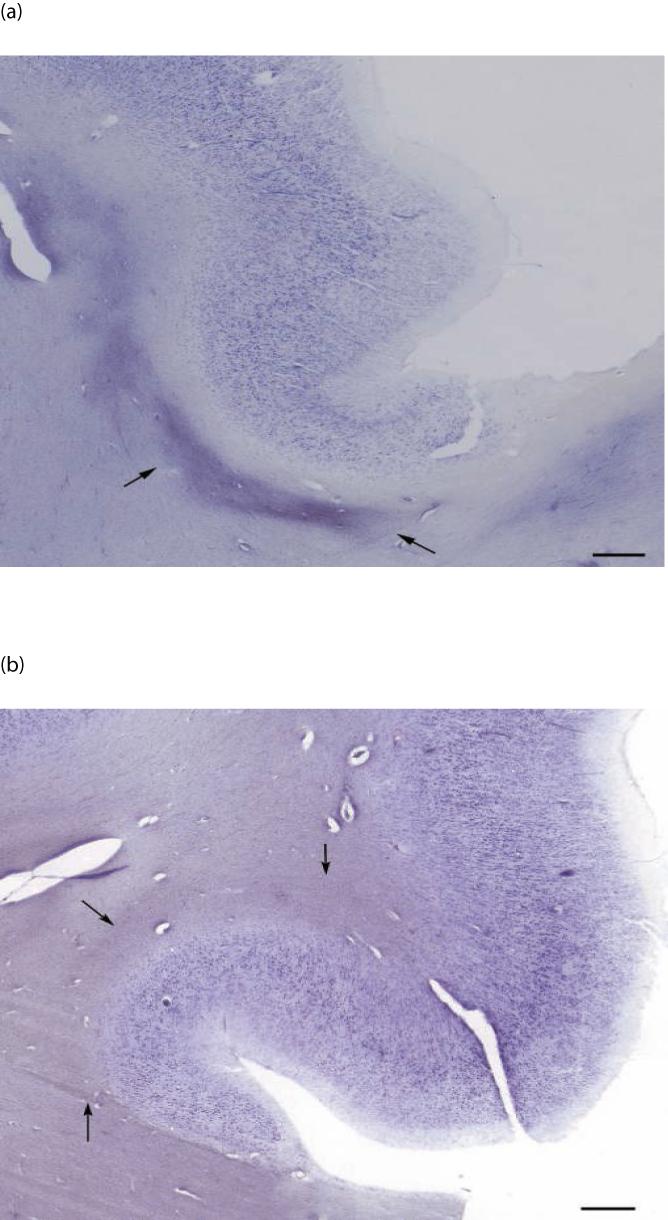
Low magnification image of the anterior cingulate gyrus in a control subject (a) and a schizophrenia subject (b). Arrows indicate borders of the cingulum bundle. Scale bar = 300 μm for both panels.
Stereological design
In order to reduce bias, all analyses were performed while blind to group and diagnosis. For spatial analyses, every 40th Nissl-stained section was first viewed at low magnification (10×) for outlining the cingulum bundle using StereoInvestigator software (MBF Bioscience, Williston, VT). The software then defined a systematic-random sampling map within each outlined contour, providing a statistically adequate sampling fraction for estimation of oligodendrocyte number and distribution, with a coefficient of error of 10% or less [43]. The dimensions of the sampling grid were set to sample approximately 200-300 oligodendrocytes per case (Table 2). Standard Nissl staining was used to identify oligodendrocytes, recognizable at high magnification as small, dark, round cells [25]. Oligodendrocytes were counted using a Zeiss Axioplan 2 microscope with a 100× Zeiss PlanApo objectives, 1.4 n.a., using a counting frame of 13.8 × 13.8 μm, and a 16.7 μm disector height with a 0.5 μm guard zone at the top surface of the tissue. The guard zone was set to avoid counting in compromised tissue at the top cut surface, and the disector height was chosen to sample at least 80% of the tissue thickness, leaving the remainder of the tissue thickness as a bottom guard zone. To the end of clarifying possible differences in oligodendrocyte spatial distribution, data acquisition was performed using a new stereological tool, the nearest-neighbor probe, integrated in the StereoInvestigator software [44, 45]. This tool, which combines the optical fractionator and a spatial point pattern analysis, identifies the spatial coordinates of the rater-chosen nearest neighbor of each counted cell. It then uses the relative frequency distribution of nearest-neighbor distances to provide a 3-dimensional analysis of spatial distribution of cells [7, 15, 44] (Fig. 2). This tool has been validated on a mouse model of abnormal cortical development after X-irradiation [44]. Distances were measured from the centers of each cell, and the resulting cumulative relative frequency (CRF) distributions were compared between schizophrenic and control groups [25, 44, 45]. When using stereologic techniques on processed tissue, tissue volume change is always a concern. In this study, tissue sections were mounted soon after cutting and before staining, which minimizes shrinkage in the x-y directions [44]. Shrinkage in the z-direction can be substantial; the stereology software corrects for this by measuring the true section thickness at regular intervals and using this corrected thickness factor in calculating cell densities.
Table 2.
Results of stereologic analyses
| Variable | Controls | Schizophrenia | p |
|---|---|---|---|
| Section thickness after staining (μm) | 18.17 ± 3.66 | 18.28 ± 7.33 | 0.963 |
| Number of sampled parent cells | 231 ± 88.7 | 189 ± 85.8 | |
| Total number of oligodendrocytes in sampled region of cb | 6,313,947 ± 2,441,661 | 5,210,601 ± 2,621,120 | |
| Oligodendrocyte density (cells/mm3) | 113,393 ± 27,000 | 115436 ± 33,694 | |
| CE (Schmitz-Hof) | 0.069 ± 0.014 | 0.078 ± 0.018 | |
| Minimum NND | 4.22 ± 0.16 | 4.11 ± 0.13 | |
| Median of NND distribution | 10.65 ± 0.70 | 10.33 ± 0.92 | |
| Mean NND | 11.27 ± 0.66 | 11.12 ± 0.91 | |
| Maximum NND | 29.07 ± 5.16 | 29.92 ± 5.46 | |
| Oligodendrocyte density in men (cells/mm3) | 118,701 ± 26,510 | 112,912 ± 38,072 | 0.751 |
| Oligodendrocyte density in women (cells/mm3) | 104,900 ± 28,471 | 117,014 ± 33,325 | 0.516 |
| Median of NND distribution in men | 10.82 ± 0.72 | 10.58 ± 1.09 | 0.639 |
| Median of NND distribution in women | 10.27 ± 0.66 | 10.18 ± 0.84 | 0.835 |
P values given are for Student’s two-tailed t test. Results are given with their standard deviations. CE, coefficient of error; NND, nearest-neighbor distance; cb, cingulum bundle.
Figure 2.
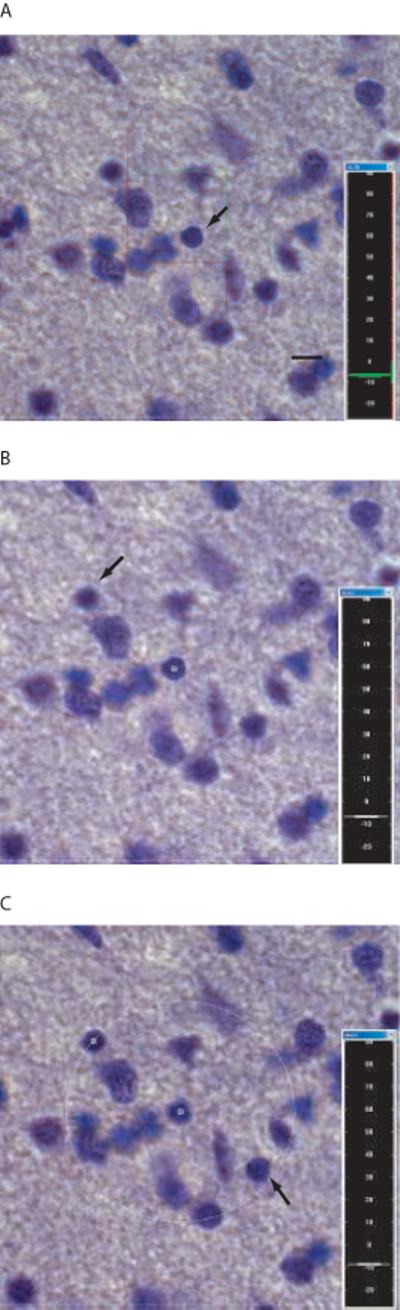
Stereologic nearest-neighbor procedure. (a) An oligodendrocyte is chosen within the counting frame (arrow). (b)The nearest oligodendrocyte to the “parent neuron” to come into focus is then chosen (arrow). (c) A 3-dimensional sphere is generated centered on the first cell with the radius equal to the distance between the two cells. The rater then focuses through the section, clicking on any oligodendrocyte that falls within this sphere (arrow), which generates a sphere with the new, smaller radius. The above is repeated until the nearest-neighbor is found. Scale bar = 5 μm for all.
Statistical analyses
Group differences in age and PMI were assessed using the Student’s t test, and differences in gender analyzed using Pearson’s χ2. Mean oligodendroglial densities in the cingulum bundle were compared for schizophrenics and controls using a generalized linear model multivariate analysis of variance (MANOVA), with diagnosis as the fixed factor and the patients’ age, gender, postmortem interval (PMI), fixation time, and CDR as covariates. Post-hoc tests (fixation time) were performed with linear regression analysis. Density was correlated with age using Pearson’s r analysis. Nearest-neighbor data are expressed as CRF graphs; using a spatial point pattern analysis, we measured the degree of oligodendrocyte clustering by comparing the probability of finding a nearest-neighbor at a given distance from an oligodendrocyte in schizophrenics and controls. The average CRF distributions for the two groups were compared graphically [44]. In addition, the average minimum, median, mean, and maximum nearest neighbor differences for the two groups were compared using the generalized linear model MANOVA. In all these analyses, an effect was considered statistically significant if the associated p value was less than 0.05. MANOVA calculations were performed using SPSS (Version 12.0.1 for Windows; SPSS, Chicago, IL) and GraphPad Prism (Version 4.0 for Windows, GraphPad software, San Diego, CA).
Results
In the present study, in contrast to earlier work in the prefrontal cortex (25, 53), we found no significant differences in oligodendrocyte density (generalized linear model MANOVA, one degree of freedom, p = 0.37) (Table 3) in the cingulum bundle when comparing schizophrenics and control subjects. Because the area of the cingulum bundle present varied considerably from case to case, we chose cell density as a more reliable parameter for comparison. Oligodendrocyte number was compared as well, to take into account possible differences in tissue shrinkage during processing, and did not differ between the two groups (p = 0.86) (Table 2). In addition, average section thickness after staining and mounting was the same (mean thickness = 18.2 and 18.3 μm, respectively, p = 0.96), indicating that differential shrinkage did not occur. Some studies on macaque monkeys have found increased numbers of oligodendrocytes in the cortex of aged animals compared to young ones [38, 39]. Although these observations were not made in the white matter, they suggest that age may be a confounding factor in our analyses. To control for a possible age effect that may differ in the diseased brain, we then looked at the correlation between age and oligodendrocyte density in the two groups, and found no significant correlations (Pearson’s r = -0.09 in controls, and 0.007 in schizophrenia) (Fig. 3). These findings, however, may be limited because of the small age range of subjects involved. The narrow range of ages, however, suggests that age was not a significant contributor in this study cohort.
Table 3.
Results of statistical analysis (p values) with generalized linear model MANOVA
| Variable | Diagnosis | Age | PMI | Fix | Gender | CDR |
|---|---|---|---|---|---|---|
| Oligodendrocyte density | 0.37 | 0.59 | 0.77 | 0.002 | 0.53 | 0.87 |
| Oligodendrocyte number | 0.86 | 0.84 | 0.37 | 0.04 | 0.62 | 0.67 |
| Minimum NND | 0.33 | 0.65 | 0.07 | 0.06 | 0.06 | 0.79 |
| Mean NND | 0.95 | 0.35 | 0.17 | 0.83 | 0.27 | 0.92 |
| Median NND | 0.58 | 0.14 | 0.22 | 0.85 | 0.15 | 0.69 |
| Maximum NND | 0.24 | 0.25 | 0.94 | 0.007 | 0.34 | 0.77 |
PMI, postmortem interval; Fix, time in 10% formalin fixative solution; CDR, clinical dementia rating, NND, nearest neighbor distance. Significant p values are shown in bold type.
Figure 3.

Correlation between subject age and mean oligodendrocyte density in a portion of the cingulum bundle of schizophrenic and control subjects, separated by gender. NL, normal; SZ, schizophrenic; M, men; W, women. Pearson’s r = -0.44 for NL M, 0.26 for SZ M, -0.51 for NL W, and -0.12 for SZ W.
The results of the nearest-neighbor analysis, pictured as an averaged cumulative relative frequency graph for each group, showed no difference in oligodendrocyte distribution in the cingulum bundle between the two groups (Fig. 4). As a numerical measure, we compared the averaged minimum, mean, median, and maximum nearest-neighbor distances across schizophrenics and controls, finding no significant differences in any of these measures (Table 3 and Fig. 4, generalized linear model of MANOVA, one degree of freedom, p = 0.33, 0.95, 0.58, and 0.24, respectively).
Figure 4.

Cumulative relative frequency graph of averaged oligodendrocyte nearest neighbor distances, indicating the probability of finding a “nearest-neighbor” oligodendrocyte at a given distance from another oligodendrocyte. Note that the two groups have nearly identical profiles.
Data were then separated by gender to look for gender-specific differences in oligodendrocyte density and distribution. No differences between groups were noted in oligodendrocyte density (men, p = 0.75; women, p = 0.52), median nearest-neighbor distance (men, p = 0.64; women, p = 0.83), or correlation between age and density (Fig. 3). These results are somewhat limited because, when separated by gender, only 5-8 subjects were present in each group. Further analyses performed using a generalized linear model multivariate analysis of variance (MANOVA) showed no significant differences in oligodendrocytes between persons with schizophrenia and healthy controls. There were no significant effects on measured variables with respect to the covariates of age, postmortem interval, gender, or Clinical Dementia Rating score. There was, however, an effect of fixation time on both oligodendrocyte number and density, and this inverse relationship reached significance in the control group (Fig. 5).
Figure 5.
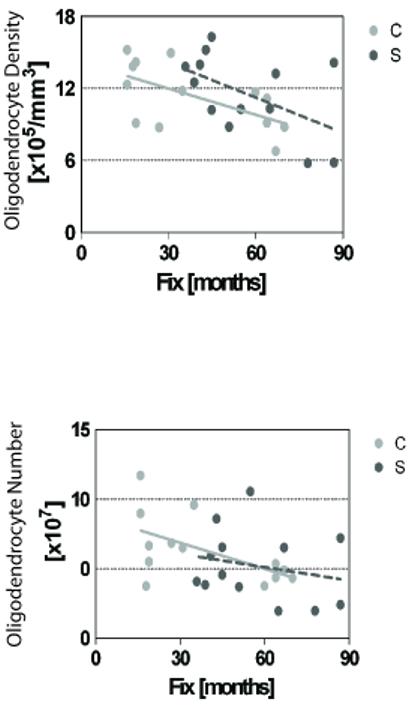
Linear regression analysis of the effect of time in 10% formalin fixative solution on oligodendrocyte number and density. C, control; S, schizophrenia.
Discussion
Increasingly, evidence from very different lines of research supports the premise that pathophysiology of oligodendrocytes may play a critical role in the development of schizophrenia. Volumetric studies, in vivo imaging techniques, gene expression data, and ultrastructural studies have all pointed to myelin, and specifically to oligodendrocytes, as a key player in the disease. Earlier studies demonstrated a decrease in oligodendrocyte number and altered oligodendroglial density in frontal brain areas in schizophrenia [25, 53]. Our laboratory investigated oligodendrocyte spatial distribution utilizing Voronoi tessellation maps to represent oligodendrocyte distribution in postmortem material from the superior frontal gyrus of schizophrenics and controls [25]. This technique provides an objective estimate of the degree of clustering of oligodendrocytes in 2-dimensional space. When this method was applied to the superior frontal gyrus, a more clustered arrangement of oligodendrocytes was noted in controls, as well as a 28.3% decrease in oligodendrocyte density in schizophrenics compared to controls. Absolute numbers of oligodendrocytes were also significantly decreased in schizophrenia, in both layer III and the white matter underlying area 9, where the decrease reached 27% [25]. These results clearly support the notion that pathology of oligodendrocytes is present in schizophrenia, at least in the superior frontal gyrus white matter.
In the present study, we chose to focus on a distinct major white matter tract demonstrated to be affected in the disease. Altered white matter tract coherence may be reflected in differences in oligodendrocyte distribution, as oligodendrocytes tend to line up along the fibers for which they provide myelin. We used nearest-neighbor analysis to investigate the pattern of cellular distribution by indicating the probability of finding the closest neighboring cell at any given distance from a chosen oligodendrocyte. This can allow for detection of significant changes in white matter organization at the cellular level in schizophrenia that may be related to the connectivity of this tract. Using this new 3-dimensional stereological tool, we obtained results markedly different from our previous study: there was no difference in either oligodendrocyte density or distribution in schizophrenic cases. The nearest-neighbor stereologic tool has been fully validated [44] and has the major advantage of providing 3-dimensional estimates, which provides a more accurate picture of cellular distribution than do the 2-dimensional approach used in our previous study [25]. Furthermore, decreased cortical thickness has been demonstrated in several brain areas in schizophrenia, but no differences in capillary length density have been noted, (specifically in the anterior cingulate gyrus) [29]. This suggests that general volume compression in vivo does not occur in the disease, eliminating this as a possible cause for artificially increased cell density. In addition, we found no change in absolute oligodendrocyte number in schizophrenia in the region of the cingulum bundle we sampled. Our study, in contrast to previous work, used cresyl violet Nissl staining to identify oligodendrocytes using morphological characteristics. The advantage of this simple technique over immunohistochemical labeling of oligodendrocytes is that it avoids potentially biasing results due to differential expression of oligodendrocyte-related genes in schizophrenia. In addition, staining is relatively reliable and penetrates the full thickness of the sections. A possible pitfall of the cresyl violet method is that immature forms of oligodendrocytes may look like astrocytes, with a pale and heterochromatic appearance [8], as well as multiple neurites [12]. We therefore may have inadvertently missed a population of immature oligodendrocytes in our counts. An additional disadvantage with the cresyl violet stain may be suggested by the noted effect of fixation time on oligodendrocyte density and number. As both measured number and density decreased with increased fixation time, brain shrinkage is not the issue at hand. Increased fixation time may result in diminished Nissl stain uptake -- an effect that may be specific to oligodendrocytes.
An additional consideration is our analysis of only the right hemisphere, due to the archiving system employed by the Mount Sinai School of Medicine Brain Bank, which freezes the left hemisphere of all brains. Some studies have found pathology in schizophrenia lateralized to the left ACC, such as decreased glucose metabolism and volume [24] and decreased white matter fractional anisotropy [20]. This suggests that, in examining only the right hemisphere, we may have missed a left ACC-specific effects of schizophrenia. While this is certainly possible, the question of lateralized deficits in schizophrenia is far from decided. Many studies have shown ACC changes in the disease that are evenly bilateral, including decreased area and anisotropy [30, 33], decreased glucose metabolism [23], and decreased gray matter volume [56]. Recent work has also shown that, in macaque monkeys, both typical and atypical antipsychotic drugs can alter numbers of glial cells [28]. As all of the patients included in the present study received antipsychotic medication, this may be an important factor. In monkeys, the numbers of astrocytes were shown to be significantly reduced by antipsychotic treatment, and oligodendrocytes were also decreased, but not to a statistically significant degree. Our study investigated only oligodendrocytes, and as such a considerable effect of drug treatment on our estimates is not likely.
In summary, our results suggest that a more subtle oligodendrocyte or myelin anomaly may underlie the deficits observed in schizophrenia. Previous studies have shown changes in expression levels in schizophrenia of only some genes expressed in oligodendrocytes, whereas other genes’ expression remains unchanged. The observed lack of differences in oligodendrocyte numbers supports the suggestion that these changes in gene expression are gene and protein-specific and not a result of a general decrease in the numbers of these cells. Indeed, recent research [41] has demonstrated that a genetic defect that affects oligodendrocytes can result in altered brain function without decreased oligodendrocyte numbers. Additionally, our findings may reflect a difference in disease state between gray and white matter, with related, but not identical, processes occurring in each; alternatively, there may be differences in the intrinsic structures of the cingulum bundle and the subcortical gyral white matter. This suggests that the role played by oligodendrocytes in the pathogenesis of schizophrenia is far from simple and cannot be generalized to all component of the white matter. These critical myelinating cells do not appear simply to die or fail to develop. It remains to be seen what position oligodendrocytes hold in the cascade of malfunctions that results in the constellation of behavioral deficits seen in this disease. Studies in mice lacking myelination-related genes implicated in schizophrenia may shed light on this issue. For instance, our laboratory is currently studying mice missing the MAG gene (myelin associated glycoprotein), examining the dendritic trees and spines in these animals. Preliminary results indicate a significant decrease in total basal dendritic length in MAG knockout mice compared with wildtype controls, particularly at higher branch orders [46]. Additional ultrastructural studies are also needed to determine whether there is a more subtle anomaly of oligodendrocytes in schizophrenia that may prevent healthy myelination and tract coherence. Lastly, more nuanced research may help explain what is actually being measured by DTI and MTI, at the cellular level. A deeper understanding of these fundamental issues will be necessary for the development of more effective prevention or treatment of schizophrenia.
Acknowledgements
Supported by NIH grants MH66392 and MH82286 and by the Stanley Medical Research Institute. The authors would like to thank W.G.M. Janssen and B. Wicinski for expert technical assistance, Dr. V. Haroutunian for helpful discussion, Dr. D.P. Purohit for expert neuropathological assessments, and L. White and M. Kundu for review of neuropsychological and medical records.
References
- 1.Arnone D, McIntosh AM, Tan GMY, Ebmeier KP. Meta-analysis of magnetic resonance imaging studies of the corpus callosum in schizophrenia. Schizophr Res. 2008 doi: 10.1016/j.schres.2008.01.005. DOI: 10.1016/j.schres.2008.01.005. [DOI] [PubMed] [Google Scholar]
- 2.Baiano M, David A, Versace A, Churchill R, Balestrieri M, Brambilla P. Anterior cingulate volumes in schizophrenia: a systematic review and a meta-analysis of MRI studies. Schizophr Res. 2007;93:1–12. doi: 10.1016/j.schres.2007.02.012. [DOI] [PubMed] [Google Scholar]
- 3.Bailer U, Leisch F, Meszaros K, Lenzinger E, Willinger U, Strobl R, Gebhardt C, Gerhard E, Fuchs K, Sieghart W, Kasper S, Hornik K, Aschauer HN. Genome scan for susceptibility loci for schizophrenia. Neuropsychobiology. 2000;42:175–182. doi: 10.1159/000026690. [DOI] [PubMed] [Google Scholar]
- 4.Bartzokis G, Lu PH, Nuechterlein KH, Gitlin M, Doi C, Edwards N, Lieu C, Altshuler LL, Mintz J. Differential effects of typical and atypical antipsychotics on brain myelination in schizophrenia. Schizophr Res. 2007;93:13–22. doi: 10.1016/j.schres.2007.02.011. [DOI] [PMC free article] [PubMed] [Google Scholar]
- 5.Benes FM, Bird ED. An analysis of the arrangement of neurons in the cingulate cortex of schizophrenic patients. Arch Gen Psychiatry. 1987;44:608–616. doi: 10.1001/archpsyc.1987.01800190024004. [DOI] [PubMed] [Google Scholar]
- 6.Bouras C, Kovari E, Hof PR, Riederer BM, Giannakopoulos P. Anterior cingulate cortex pathology in schizophrenia and bipolar disorder. Acta Neuropathol. 2001;102:373–379. doi: 10.1007/s004010100392. [DOI] [PubMed] [Google Scholar]
- 7.Bronshtein IN, Semendyayev KA. Handbook of Mathematics. Springer; Berlin: 1985. [Google Scholar]
- 8.Bucher O. Cytologie, Histologie und mikroskopische Anatomie des Menschen. 10th Edition Hans Huber Verlag; Bern: 1980. [Google Scholar]
- 9.Buchsbaum MS, Tang CY, Peled S, Gudbjartsson H, Lu D, Hazlett EA, Downhill J, Haznedar M, Fallon JH, Atlas SW. MRI white matter diffusion anisotropy and PET metabolic rate in schizophrenia. NeuroReport. 1998;9:425–430. doi: 10.1097/00001756-199802160-00013. [DOI] [PubMed] [Google Scholar]
- 10.Buchsbaum MS, Friedman J, Buchsbaum BR, Chu K, Hazlett EA, Newmark R, Schneiderman JS, Torosjan Y, Tang C, Hof PR, Stewart D, Davis KL, Gorman J. Diffusion tensor imaging in schizophrenia. Biol Psychiatry. 2006;60:1181–1187. doi: 10.1016/j.biopsych.2005.11.028. [DOI] [PubMed] [Google Scholar]
- 11.Buchsbaum MS, Buchsbaum BR, Hazlett EA, Haznedar MM, Newmark R, Tang CY, Hof PR. Relative glucose metabolic rate higher in white matter in patients with schizophrenia. Am J Psychiatry. 2007;164:1072–1081. doi: 10.1176/ajp.2007.164.7.1072. [DOI] [PubMed] [Google Scholar]
- 12.Butt AM, Ransom BR. Morphology of astrocytes and oligodendrocytes during development in the intact rat optic nerve. J Comp Neurol. 1993;338:141–158. doi: 10.1002/cne.903380110. [DOI] [PubMed] [Google Scholar]
- 13.Davis KL, Stewart DG, Friedman J, Buchsbaum MS, Harvey P, Hof PR, Buxbaum JD, Haroutunian V. White matter changes in schizophrenia: evidence for myelin-related dysfunction. Arch Gen Psychiatry. 2003;60:443–456. doi: 10.1001/archpsyc.60.5.443. [DOI] [PubMed] [Google Scholar]
- 14.Devinsky O, Morrell MJ, Vogt BA. Contributions of anterior cingulate cortex to behavior. Brain. 1995;118:279–306. doi: 10.1093/brain/118.1.279. [DOI] [PubMed] [Google Scholar]
- 15.Diggle PJ. Statistical Analysis of Spatial Point Patterns. Academic Press; London: 1983. [Google Scholar]
- 16.Dracheva S, Davis KL, Chin B, Woo DA, Schmeidler J, Haroutunian V. Myelin-associated mRNA and protein expression deficits in the anterior cingulate cortex and hippocampus in elderly schizophrenia patients. Neurobiol Dis. 2006;21:531–540. doi: 10.1016/j.nbd.2005.08.012. [DOI] [PubMed] [Google Scholar]
- 17.Faraone SV, Matise T, Svrakic D, Pepple J, Malaspina D, Suarez B, Hampe C, Zambuto CT, Schmitt K, Meyer J, Markel P, Lee H, Harkavy-Friedman J, Kaufmann C, Cloninger CR, Tsuang MT. Genome scan of European-American schizophrenia pedigrees: results of the NIMH genetics initiative and millennium consortium. Am J Med Genet (Neuropsych Genet) 1998;81:290–295. [PubMed] [Google Scholar]
- 18.Foong J, Maier M, Barker GJ, Brocklehurst S, Miller DH, Ron MA. In vivo investigation of white matter pathology in schizophrenia with magnetization transfer imaging. J Neurol Neurosurg Psychiatry. 2000;68:70–74. doi: 10.1136/jnnp.68.1.70. [DOI] [PMC free article] [PubMed] [Google Scholar]
- 19.Foong J, Symms MR, Barker GJ, Maier M, Woermann FG, Miller DH, Ron MA. Neuropathological abnormalities in schizophrenia: evidence from magnetization transfer imaging. Brain. 2001;124:882–892. doi: 10.1093/brain/124.5.882. [DOI] [PubMed] [Google Scholar]
- 20.Fujiwara H, Namiki C, Hirao K, Miyata J, Shimizu M, Fukuyama H, Sawamoto N, Hayashi T, Murai T. Anterior and posterior cingulum abnormalities and their association with psychopathology in schizophrenia: A diffusion tensor imaging study. Schizophr Res. 2007;95:215–222. doi: 10.1016/j.schres.2007.05.044. [DOI] [PubMed] [Google Scholar]
- 21.Gurling HMD, Kalsi G, Brynjolfson J, Sigmundsson T, Sherrington R, Mankoo BS, Read T, Murphy P, Blaveri E, McQuillin A, Petursson H, Curtis D. Genomewide genetic linkage analysis confirms the presence of susceptibility loci for schizophrenia, on chromosomes 1q32.2, 5q33.2, and 8p21-22 and provides support for linkage to schizophrenia, on chromosomes 11q23.3-24 and 20q12.1-11.23. Am J Hum Genet. 2001;68:661–673. doi: 10.1086/318788. [DOI] [PMC free article] [PubMed] [Google Scholar]
- 22.Hakak Y, Walker JR, Li C, Wong WH, Davis KL, Buxbaum JD, Haroutunian V, Fienberg AA. Genome-wide expression analysis reveals dysregulation of myelination-related genes in chronic schizophrenia. Proc Natl Acad Sci USA. 2001;98:4746–4751. doi: 10.1073/pnas.081071198. [DOI] [PMC free article] [PubMed] [Google Scholar]
- 23.Haznedar MM, Buchsbaum MS, Luu C, Hazlett EA, Siegel BV, Jr, Lohr J, Wu J, Haier RJ, Bunney WE., Jr Decreased anterior cingulate gyrus metabolic rate in schizophrenia. Am J Psychiatry. 1997;154:682–684. doi: 10.1176/ajp.154.5.682. [DOI] [PubMed] [Google Scholar]
- 24.Haznedar MM, Buchsbaum MS, Hazlett EA, Shihabuddin L, New A, Siever LJ. Cingulate gyrus volume and metabolism in the schizophrenia spectrum. Schizophr Res. 2004;71:249–262. doi: 10.1016/j.schres.2004.02.025. [DOI] [PubMed] [Google Scholar]
- 25.Hof PR, Haroutunian V, Friedrich VL, Jr, Byne W, Buitron C, Perl DP, Davis KL. Loss and altered spatial distribution of oligodendrocytes in the superior frontal gyrus in schizophrenia. Biol Psychiatry. 2003;53:1075–1085. doi: 10.1016/s0006-3223(03)00237-3. [DOI] [PubMed] [Google Scholar]
- 26.Hoptman MJ, Ardekani BA, Butler PD, Nierenberg J, Javitt DC, Lim KO. DTI and impulsivity in schizophrenia: a first voxelwise correlational analysis. NeuroReport. 2004;15:2467–2470. doi: 10.1097/00001756-200411150-00007. [DOI] [PMC free article] [PubMed] [Google Scholar]
- 27.Kaufmann CA, Suarez B, Malaspina D, Pepple J, Svrakic D, Markel PD, Meyer J, Zambuto CT, Schmitt K, Cox Matise T, Harkavy Friedman JM, Hampe C, Lee H, Shore D, Wynne D, Faraone SV, Tsuang MT, Cloninger CR. NIMH genetics initiative millennium schizophrenia consortium: linkage analysis of African-American pedigrees. Am J Med Genet (Neuropsych Genet) 1998;81:282–289. [PubMed] [Google Scholar]
- 28.Konopaske GT, Dorph-Petersen K, Sweet RA, Pierri JN, Zhang W, Sampson AR, Lewis DA. Effect of chronic antipsychotic exposure on astrocyte and oligodendrocyte numbers in macaque monkeys. Biol Psychiatry. 2007;8:759–765. doi: 10.1016/j.biopsych.2007.08.018. [DOI] [PMC free article] [PubMed] [Google Scholar]
- 29.Kreczmanski P, Schmidt-Kastner R, Heinsen H, Steinbusch HWM, Hof PR, Schmitz C. Stereological studies of capillary length density in the frontal cortex of schizophrenics. Acta Neuropathol. 2005;109:510–518. doi: 10.1007/s00401-005-1003-y. [DOI] [PubMed] [Google Scholar]
- 30.Kubicki M, Westin CF, Nestor PG, Wible CG, Frumin M, Maier SE, Kikinis R, Jolesz FA, McCarley RW, Shenton ME. Cingulate fasciculus integrity disruption in schizophrenia: a magnetic resonance diffusion tensor imaging study. Biol Psychiatry. 2003;54:1171–1180. doi: 10.1016/s0006-3223(03)00419-0. [DOI] [PMC free article] [PubMed] [Google Scholar]
- 31.Kubicki M, McCarley R, Westin CF, Park HJ, Maier S, Kikinis R, Jolesz FA, Shenton M. A review of diffusion tensor imaging studies in schizophrenia. J Psychiatry Res. 2005;41:15–30. doi: 10.1016/j.jpsychires.2005.05.005. [DOI] [PMC free article] [PubMed] [Google Scholar]
- 32.Levinson DF, Mahtani MM, Nancarrow DJ, Brown DM, Kruglyak L, Kirby A, Hayward NK, Crowe RR, Andreasen NC, Black DW, Silverman JM, Endicott J, Sharpe L, Mohs RC, Siever LJ, Walters MK, Lennon DP, Jones HL, Nertney DA, Daly MJ, Gladis M, Mowry BJ. Genome scan of schizophrenia. Am J Psychiatry. 1998;155:741–750. doi: 10.1176/ajp.155.6.741. [DOI] [PubMed] [Google Scholar]
- 33.Lim KO, Hedehus M, Moseley M, de Crespigny A, Sullivan EV, Pfefferbaum A. Compromised white matter integrity in schizophrenia inferred from diffusion tensor imaging. Arch Gen Psychiatry. 1999;56:367–374. doi: 10.1001/archpsyc.56.4.367. [DOI] [PubMed] [Google Scholar]
- 34.Meyer-Lindenberg AS, Olsen RK, Kohn PD, Brown T, Egan MF, Weinberger DR, Berman KF. Regionally specific disturbance of dorsolateral prefrontal-hippocampal functional connectivity in schizophrenia. Arch Gen Psychiatry. 2005;62:379–386. doi: 10.1001/archpsyc.62.4.379. [DOI] [PubMed] [Google Scholar]
- 35.Mitelman SA, Torosjan Y, Newmark RE, Schneiderman JS, Chu K, Brickman AM, Haznedar MM, Hazlett EA, Tang CY, Shihabuddin L, Buchsbaum MS. Internal capsule, corpus callosum and long associative fibers in good and poor outcome schizophrenia: a diffusion tensor imaging survey. Schizophr Res. 2007;92:211–224. doi: 10.1016/j.schres.2006.12.029. [DOI] [PubMed] [Google Scholar]
- 36.Narayan S, Kass KE, Thomas EA. Chronic haloperidol treatment results in a decrease in the expression of myelin/oligodendrocyte-related genes in the mouse brain. J Neurosci Res. 2007;85:757–765. doi: 10.1002/jnr.21161. [DOI] [PubMed] [Google Scholar]
- 37.Perl DP, Good PF, Bussiere T, Morrison JH, Erwin JM, Hof PR. Practical approaches to stereology in the setting of aging- and disease-related brain banks. J Chem Neuroanat. 2000;20:7–19. doi: 10.1016/s0891-0618(00)00077-6. [DOI] [PubMed] [Google Scholar]
- 38.Peters A. The effects of normal aging on myelin and nerve fibers: A review. J Neurocytol. 2003;31:581–593. doi: 10.1023/a:1025731309829. [DOI] [PubMed] [Google Scholar]
- 39.Peters A, Sethares C. Oligodendrocytes, their progenitors and other neuroglial cells in the aging primate cerebral cortex. Cereb Cortex. 2004;14:995–1007. doi: 10.1093/cercor/bhh060. [DOI] [PubMed] [Google Scholar]
- 40.Purohit DP, Perl DP, Haroutunian V, Powchik P, Davidson M, Davis KL. Alzheimer disease and related neurodegenerative diseases in elderly patients with schizophrenia. Arch Gen Psychiatry. 1998;55:205–211. doi: 10.1001/archpsyc.55.3.205. [DOI] [PubMed] [Google Scholar]
- 41.Roy K, Murtie JC, El-Khodor BF, Edgar N, Sardi SP, Hooks BM, Benoit-Marand M, Chen C, Moore H, O’Donnell P, Brunner D, Corfas G. Loss of erbB signaling in oligodendrocytes alters myelin and dopaminergic function, a potential mechanism for psychiatric disorders. Proc Natl Acad Sci USA. 2007;104:8131–8136. doi: 10.1073/pnas.0702157104. [DOI] [PMC free article] [PubMed] [Google Scholar]
- 42.Schmitt A, Wilczek K, Blennow K, Maras A, Jatzko A, Petroianu G, Braus DF, Gattaz WF. Altered thalamic membrane phospholipids in schizophrenia: A postmortem study. Biol Psychiatry. 2004;56:41–45. doi: 10.1016/j.biopsych.2004.03.019. [DOI] [PubMed] [Google Scholar]
- 43.Schmitz C, Hof PR. Recommendations for straightforward and rigorous methods of counting neurons based on a computer simulation approach. J Chem Neuroanat. 2000;20:93–114. doi: 10.1016/s0891-0618(00)00066-1. [DOI] [PubMed] [Google Scholar]
- 44.Schmitz C, Grolms N, Hof PR, Boehringer R, Glaser J, Korr H. Altered spatial arrangement of layer V pyramidal cells in the mouse brain following prenatal low-dose x-irradiation. A stereologic study using a novel three-dimensional tool to estimate the nearest neighbor distance distribution function of cells in thick sections. Cereb Cortex. 2002;12:954–960. doi: 10.1093/cercor/12.9.954. [DOI] [PubMed] [Google Scholar]
- 45.Schmitz C, Hof PR. Design-based stereology in neuroscience. Neuroscience. 2005;130:813–831. doi: 10.1016/j.neuroscience.2004.08.050. [DOI] [PubMed] [Google Scholar]
- 46.Segal D, Koschnik JR, Slegers LHA, Hof PR. Oligodendrocyte pathophysiology: a new view of schizophrenia. Int J Neuropsychopharmacol. 2007;10:503–511. doi: 10.1017/S146114570600722X. [DOI] [PubMed] [Google Scholar]
- 47.Selemon LD, Goldman-Rakic PS. The reduced neuropil hypothesis: a circuit based model of schizophrenia. Biol Psychiatry. 1999;45:17–25. doi: 10.1016/s0006-3223(98)00281-9. [DOI] [PubMed] [Google Scholar]
- 48.Stark AK, Uylings HBM, Sanz-Arigita E, Pakkenberg B. Glial cell loss in the anterior cingulate cortex, a subregion of the prefrontal cortex, in subjects with schizophrenia. Am J Psychiatry. 2004;161:882–888. doi: 10.1176/appi.ajp.161.5.882. [DOI] [PubMed] [Google Scholar]
- 49.Stewart DG, Davis KL. Possible contributions of myelin and oligodendrocyte dysfunction to schizophrenia. Int Rev Neurobiol. 2004;59:381–424. doi: 10.1016/S0074-7742(04)59015-3. [DOI] [PubMed] [Google Scholar]
- 50.Sun Z, Wang F, Cui L, Breeze J, Du X, Wang X, Cong Z, Zhang H, Li B, Hong N, Zhang D. Abnormal anterior cingulum in patients with schizophrenia: a diffusion tensor imaging study. NeuroReport. 2003;14:1833–1836. doi: 10.1097/00001756-200310060-00015. [DOI] [PubMed] [Google Scholar]
- 51.Tkachev D, Mimmack ML, Ryan MM, Wayland M, Freeman T, Jones PB, Starkey M, Webster MJ, Yolken RH, Bahn S. Oligodendrocyte dysfunction in schizophrenia and bipolar disorder. Lancet. 2003;362:798–805. doi: 10.1016/S0140-6736(03)14289-4. [DOI] [PubMed] [Google Scholar]
- 52.Uranova N, Orlovskaya D, Vikhreva O, Zimina I, Kolomeets N, Vostrikov V, Rachmanova V. Electron microscopy of oligodendroglia in severe mental illness. Brain Res Bull. 2001;55:597–610. doi: 10.1016/s0361-9230(01)00528-7. [DOI] [PubMed] [Google Scholar]
- 53.Uranova NA, Vostrikov VM, Orlovskaya DD, Rachmanova VI. Oligodendroglial density in the prefrontal cortex in schizophrenia and mood disorders: a study from the Stanley Neuropathology Consortium. Schizophr Res. 2004;67:269–275. doi: 10.1016/S0920-9964(03)00181-6. [DOI] [PubMed] [Google Scholar]
- 54.Vostrikov VM, Uranova NA, Orlovskaya DD. Deficit of perineuronal oligodendrocytes in the prefrontal cortex in schizophrenia and mood disorders. Schizophr Res. 2007;94:273–280. doi: 10.1016/j.schres.2007.04.014. [DOI] [PubMed] [Google Scholar]
- 55.Wang F, Sun Z, Cui L, Du X, Wang X, Zhang H, Cong Z, Hong N, Zhang D. Anterior cingulum abnormalities in male patients with schizophrenia determined through diffusion tensor imaging. Am J Psychiatry. 2004;161:573–575. doi: 10.1176/appi.ajp.161.3.573. [DOI] [PubMed] [Google Scholar]
- 56.Wang L, Hosakere M, Trein JCL, Miller A, Ratnanather JT, Barch DM, Thompson PA, Qiu A, Gado MH, Miller MI, Csernansky JG. Abnormalities of cingulate gyrus neuroanatomy in schizophrenia. Schizophr Res. 2007;93:66–78. doi: 10.1016/j.schres.2007.02.021. [DOI] [PMC free article] [PubMed] [Google Scholar]
- 57.Whitford TJ, Grieve SM, Farrow TFD, Gomes L, Brennan J, Harris AWF, Gordon E, Williams M. Volumetric white matter abnormalities in first-episode schizophrenia: a longitudinal, tensor-based morphometry study. Am J Psychiatry. 2007;164:1082–1089. doi: 10.1176/ajp.2007.164.7.1082. [DOI] [PubMed] [Google Scholar]
- 58.Wood SJ, Yuçel M, Wellard RM, Harrison BJ, Clarke K, Fornito A, Velakoulis D, Pantelis C. Evidence for neuronal dysfunction in the anterior cingulate of patients with schizophrenia: a proton magnetic resonance spectroscopy study at 3 T. Schizophr Res. 2007;94:328–331. doi: 10.1016/j.schres.2007.05.008. [DOI] [PubMed] [Google Scholar]