Abstract
We report on the completion of an autosomal genetic linkage (GL) map of the domestic cat (Felis silvestris catus). Unlike two previous linkage maps of the cat constructed with a hybrid pedigree between the domestic cat and the Asian leopard cat, this map was generated entirely with domestic cats, using a large multi-generational pedigree (n=256) maintained by the Nestlé Purina PetCare Company. Four hundred eighty-three simple tandem repeat (STR) loci have been assigned to linkage groups on the cat’s 18 autosomes. A single linkage group spans each autosome. The length of the cat map, estimated at 4370 cM, is long relative to most reported mammalian maps. A high degree of concordance in marker order was observed between the third-generation map and the 1.5 Mb-resolution radiation hybrid (RH) map of the cat. Using the cat 1.9X whole-genome sequence, we identified map coordinates for 85#x00025; of the loci in the cat assembly, with high concordance observed in marker order between the linkage map and the cat sequence assembly. The present version represents a marked improvement over previous cat linkage maps as it (i) nearly doubles the number of markers that were present in the second-generation linkage map in the cat, (ii) provides a linkage map generated in a domestic cat pedigree which will more accurately reflect recombination distances than previous maps generated in a hybrid pedigree, and (iii) provides single linkage groups spanning each autosome. Marker order was largely consistent between this and the previous maps, though the use of a hybrid pedigree in the earlier versions appears to have contributed to some suppression of recombination. The improved linkage map will provide an added resource for the mapping of phenotypic variation in the domestic cat and the use of this species as a model system for biological research.
Keywords: Domestic cat, Genetic linkage map, STRs, microsatellites
Introduction
The domestic cat numbers as the most popular pet in the United States, with an estimated 88 million individuals maintained in households across the country [1]. The cat and the dog have experienced a high level of medical surveillance, second only to humans. Reports have been made of approximately 250 identified hereditary diseases [2], most occurring within a specific recognized breed. The population dynamics of breeds, implying relatively small effective population sizes, and common breeding practices such as the use of popular sires has led to the accumulation of spontaneously generated mutations in specific breeding pools.
The development of genetic maps of the cat genome has created the possibility of identifying causative mutations for many of these hereditary diseases. We have previously reported on two genetic linkage maps generated in a hybrid pedigree between the domestic cat and the Asian leopard cat, Prionailaurus bengalensis [3; 4], an early strategy used to generate genetic linkage maps. The increased polymorphism induced by inter-species hybridization in the parental generation of a pedigree allowed evolutionarily conserved coding loci (Type I markers) to be incorporated in genetic linkage maps [5; 6].
The development of radiation hybrid (RH) maps has made for a much more rapid means of mapping coding loci. Radiation hybrid (RH) mapping is a faster and less expensive technology for building a genetic map because a) RH mapping, unlike genetic linkage mapping, uses cell lines and hence does not require the care and maintenance of a pedigree and b) the marker scoring for RH mapping depends solely on presence/absence of DNA fragments in each member of a radiation hybrid mapping panel. As a consequence, the last of a sequence of domestic cat RH maps contains 2662 markers [4; 7–10]. In spite of the faster and less expensive approach provided by RH mapping, it is still useful to combine such a resource with the information provided by a linkage map, as the latter allows the estimation of expected recombination rates across the genome, a relevant parameter for mapping phenotypic traits.
We report here the construction of the first autosomal genetic linkage (GL) map of the cat generated entirely in a domestic cat pedigree. A complementary linkage map of STRs on the X-chromosome will be reported in coordination with the mapping of the X-linked orange locus [11]. This genetic linkage map, used in conjunction with the recently completed fifth generation RH map of the cat [10] and the 1.9 X sequencing of the cat genome [12], offers a valuable resource for the future mapping of loci underlying phenotypic variation in this species, a critical requirement for the identification of implicated molecular variants, and the characterization of their biochemical and physiological impacts.
Results
The final genetic map includes 483 markers (Figure 1). When we reached the goal of a single large linkage group spanning each chromosome, 525 STR markers had been genotyped. We excluded 42 markers for the following counts and reasons:
one marker due to problems it had previously caused in the making of linkage groups [3];
one marker due to a spurious high LOD score with a marker located on another chromosome;
two markers due to suspect genotypes (e.g., a null allele);
16 markers which were either singletons or in a small group at the stage of producing linkage groups;
eight markers found to be a duplicate of another marker on the map;
10 markers that caused memory problems in the program CRI-MAP even after the ambiguous heterozygote genotypes had been excluded from the analysis;
four markers whose inclusion hampered the CRI-MAP flips computations arrival at a stable marker order.
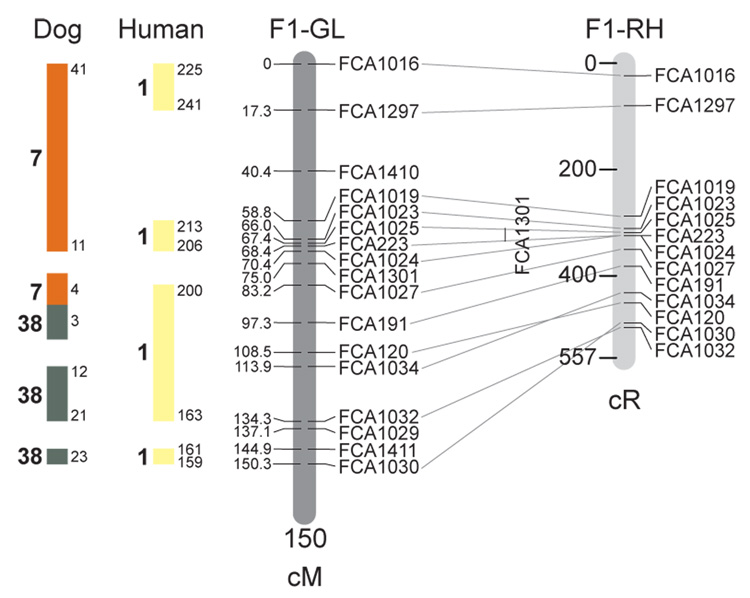
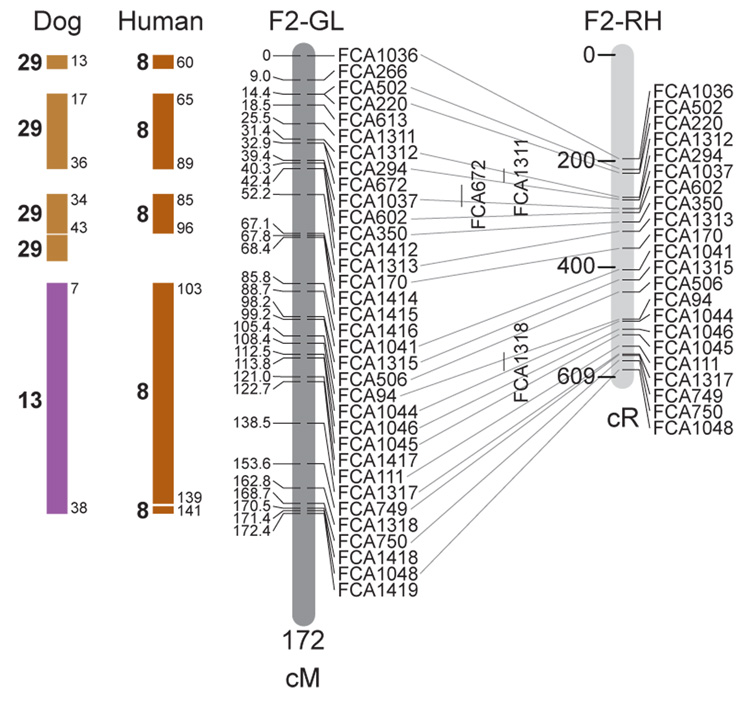
Fig. 1.
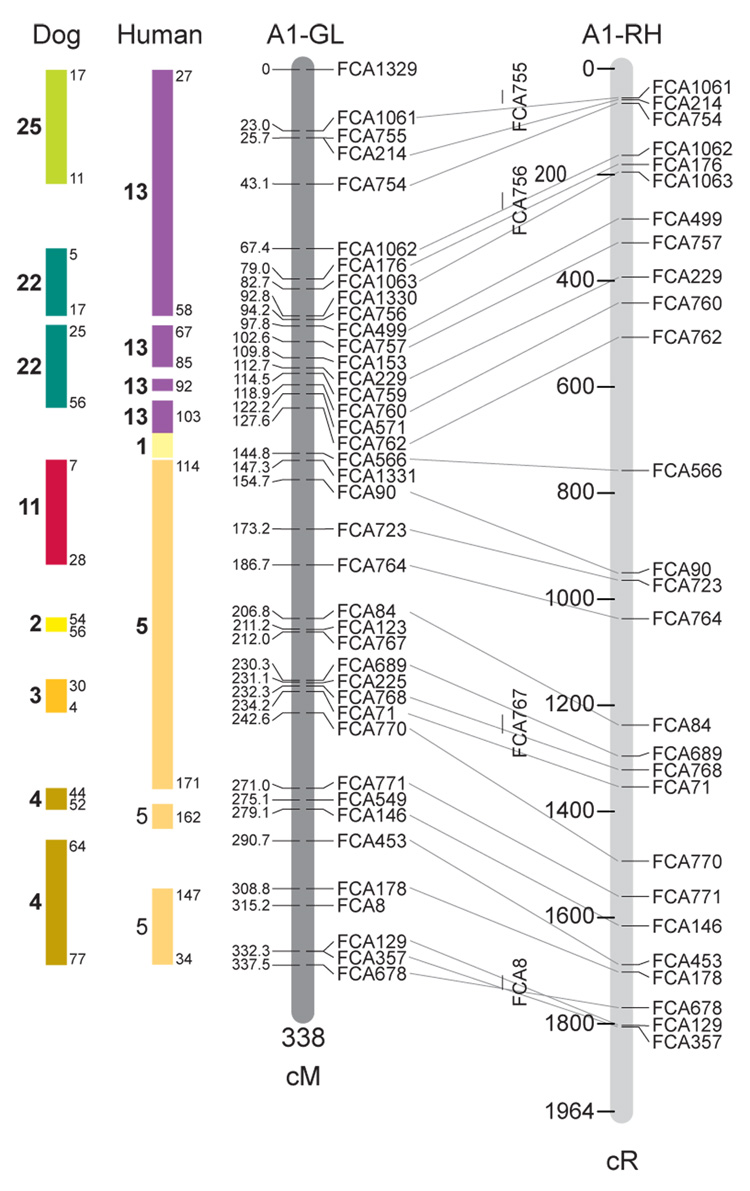
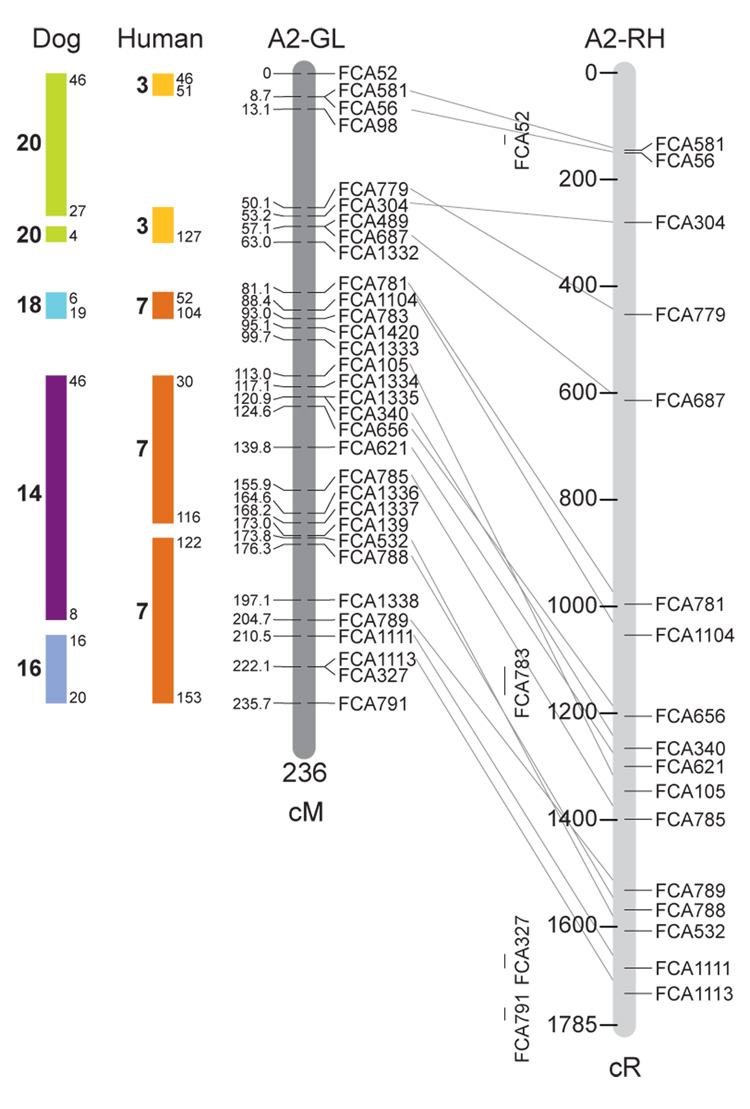
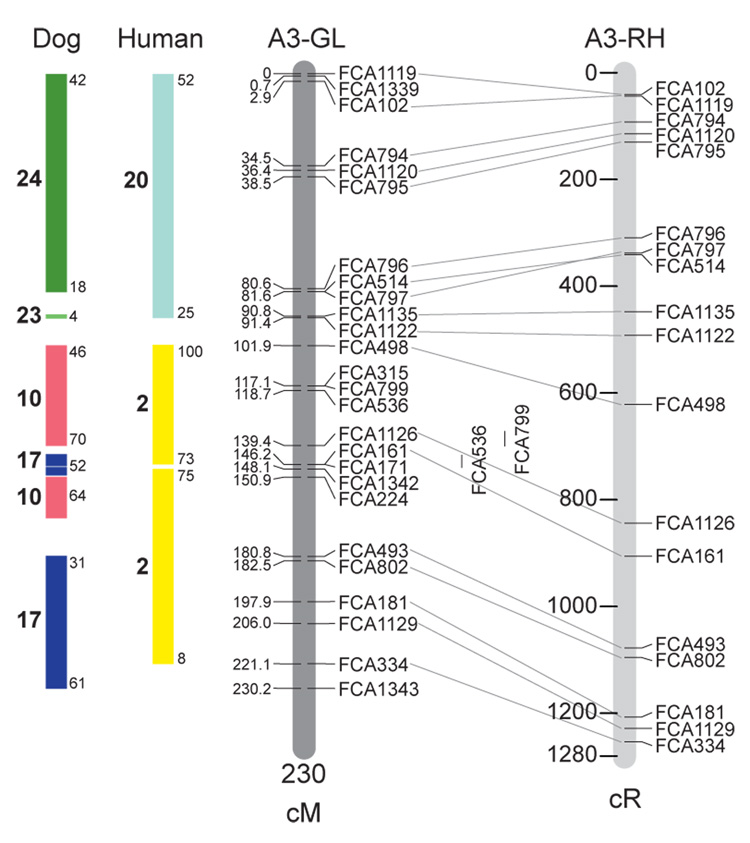
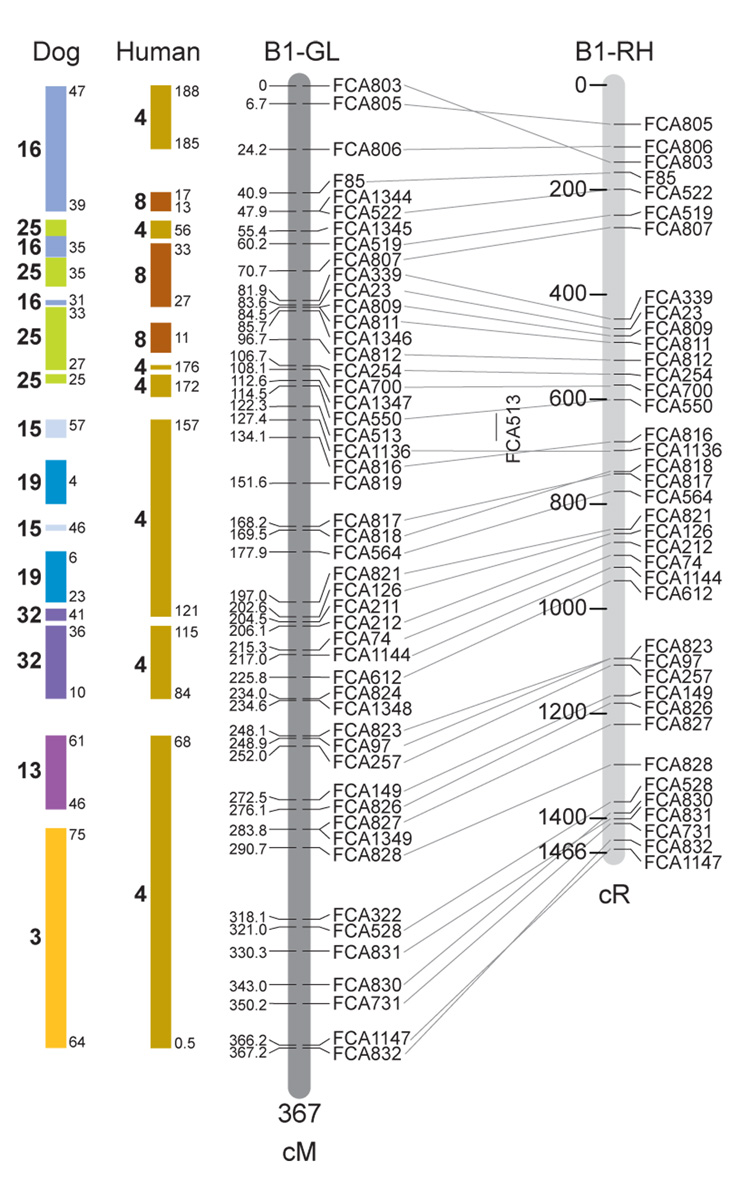
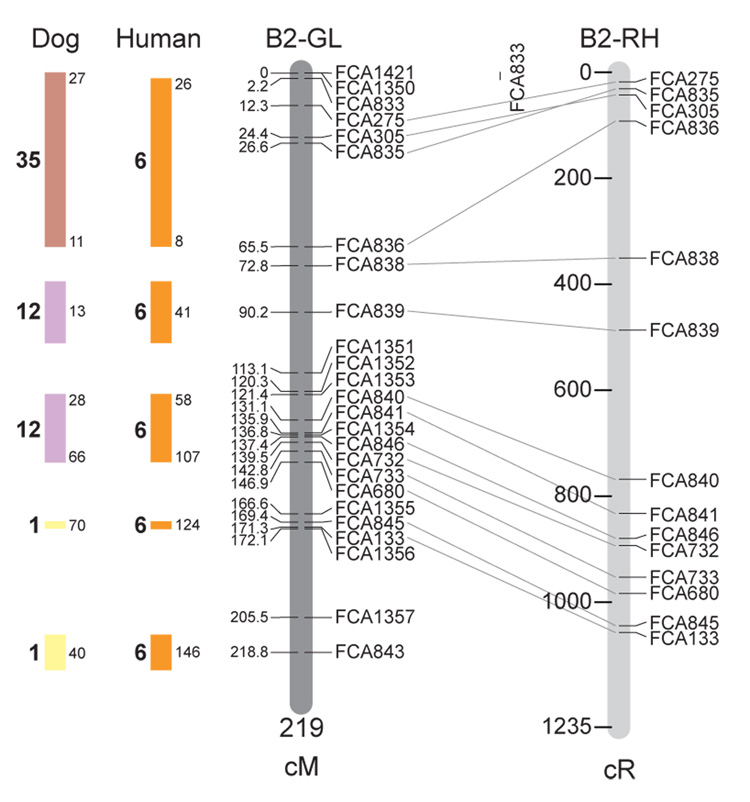
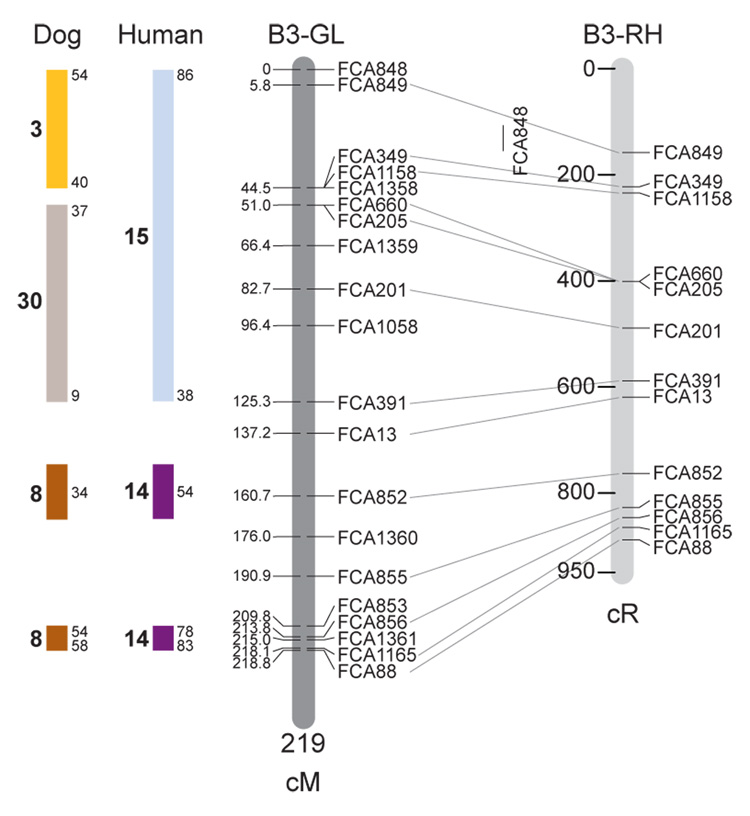
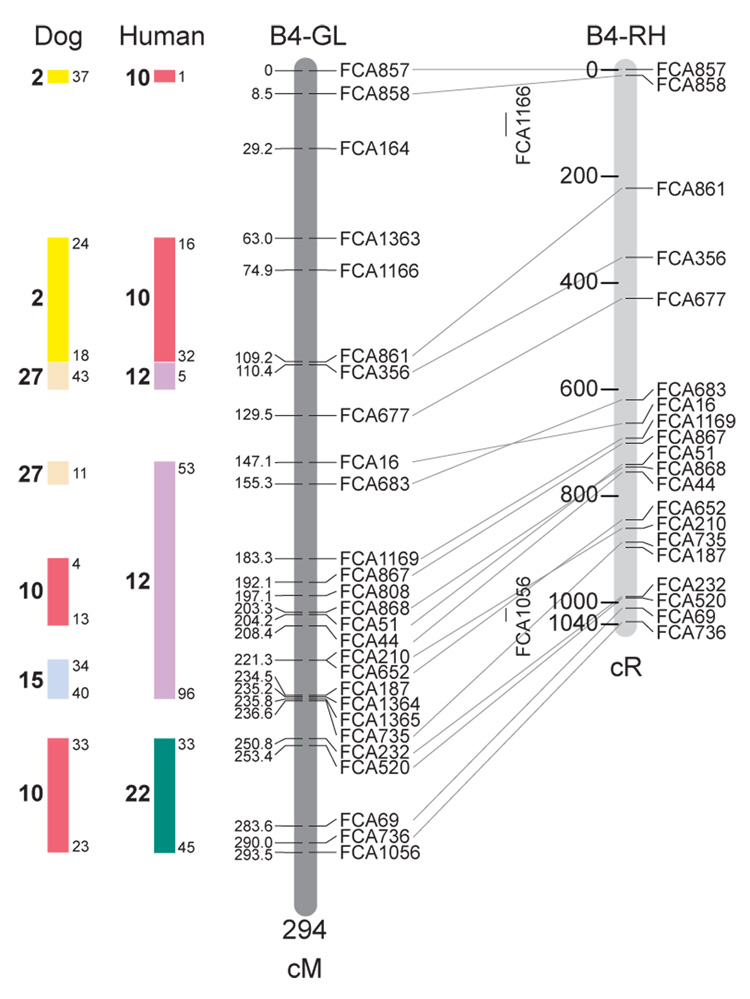
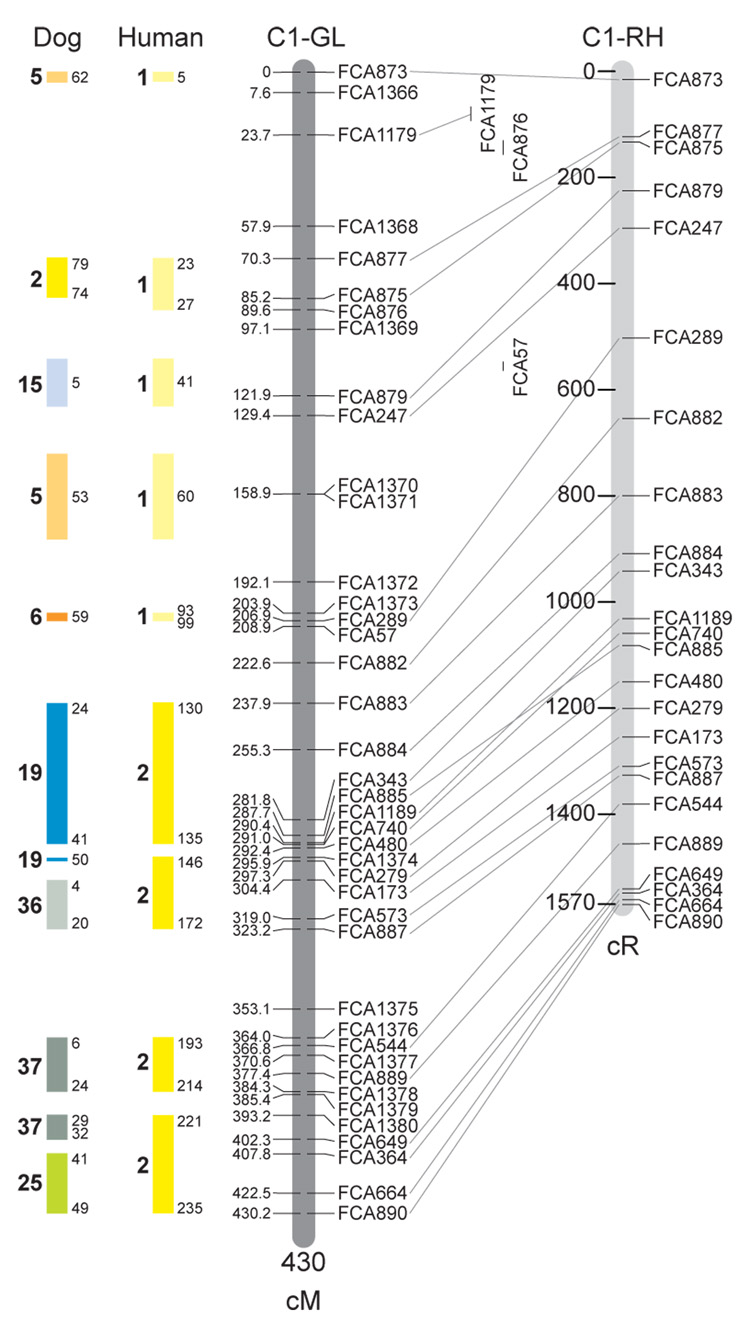
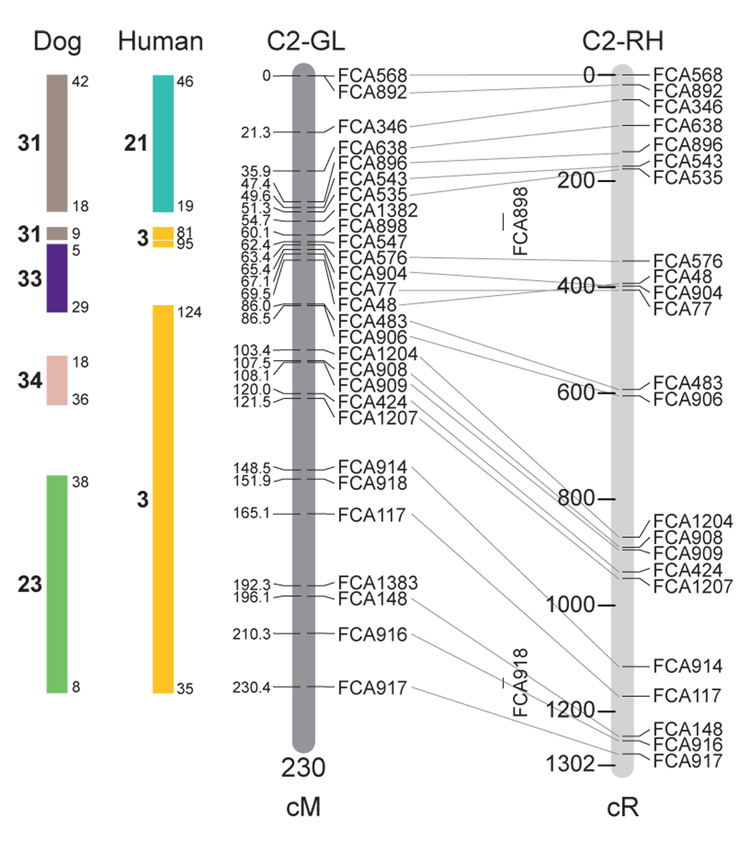
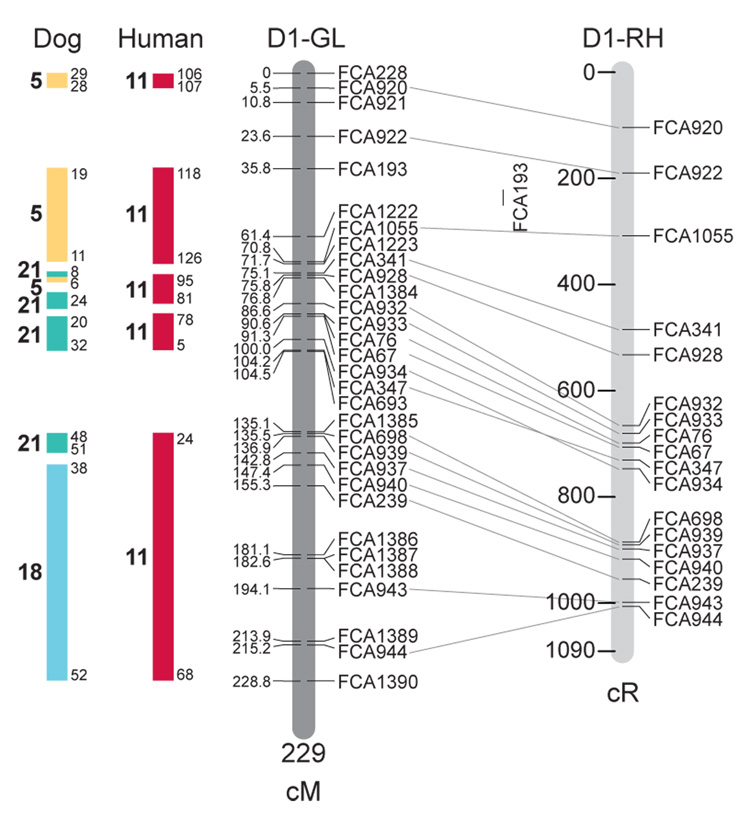
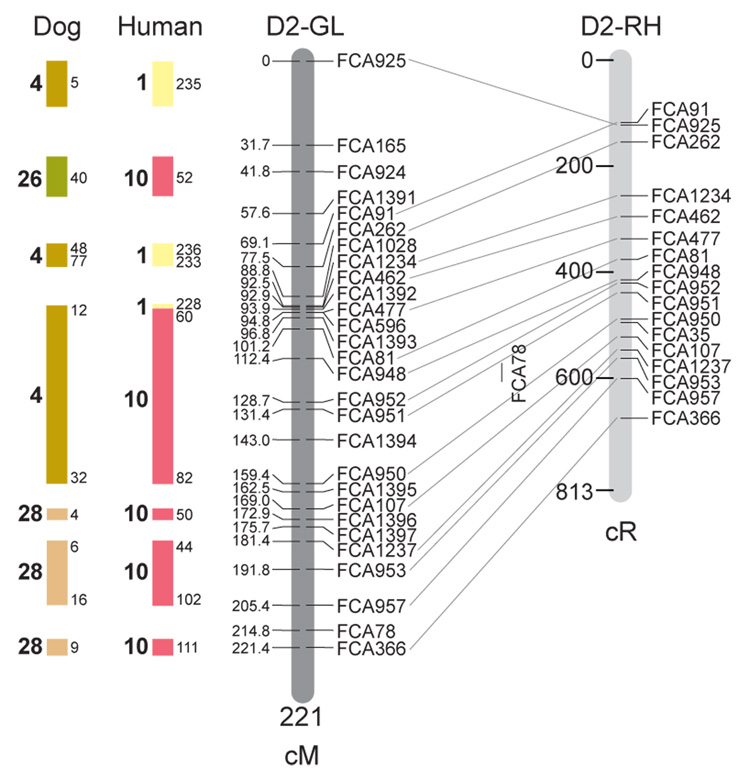
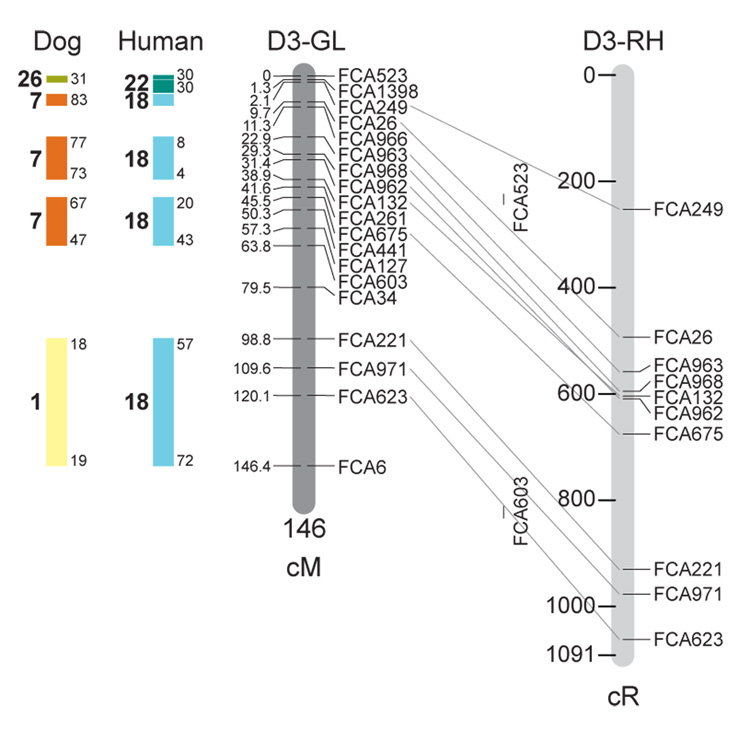
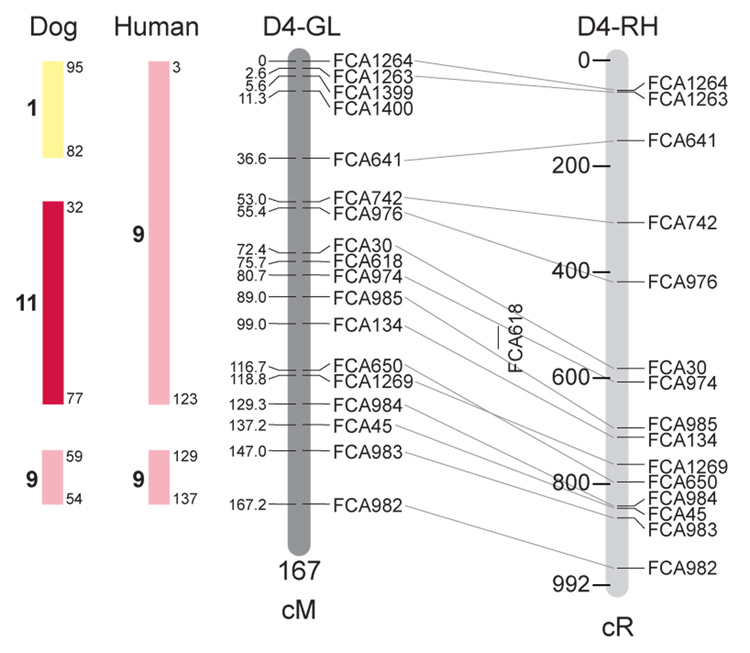
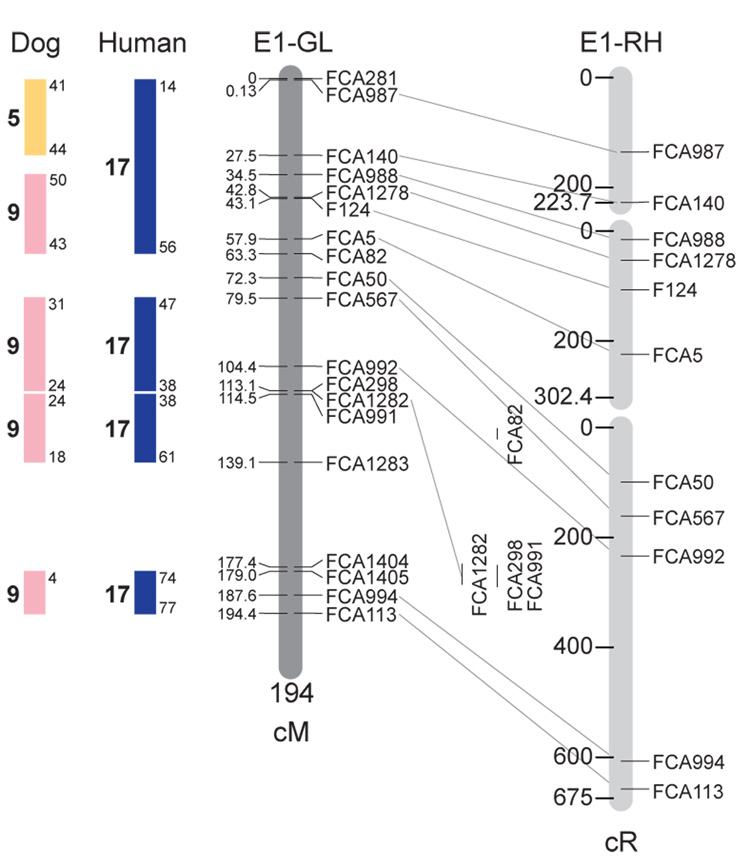
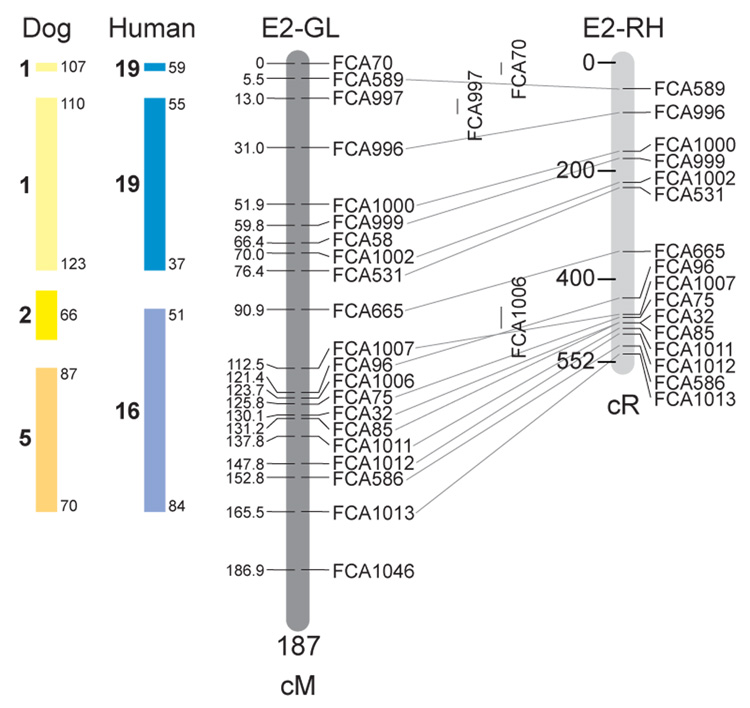
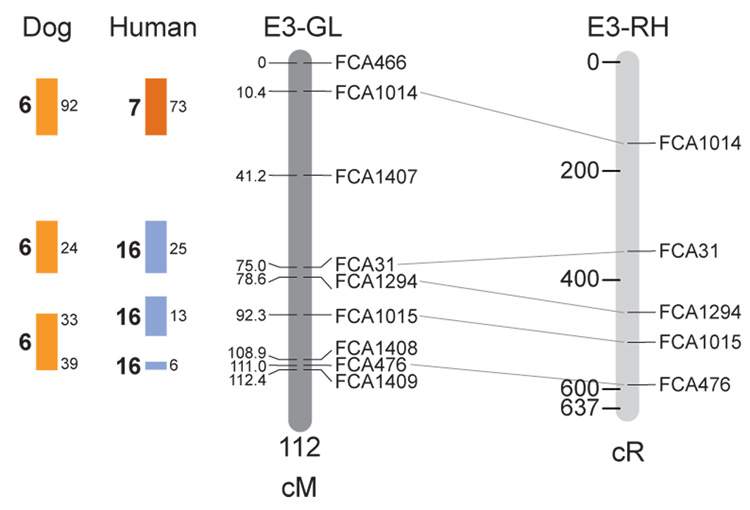
Feline genetic linkage and radiation hybrid maps with human and canine-based comparative maps. Feline chromosome names (A1, A2, etc.) are listed above each genetic linkage (GL) and radiation hybrid (RH) map. Only loci mapped in common with the GL map are displayed on the RH map, which is comprised of 2662 loci [10]. GL framework distances (sex-averaged) are given in centiMorgans, and summed for each chromosome below. The GL marker locations are represented in centimorgans (cM) opposite each marker. RH map centiRay distance scale is represented by each bar corresponding to 200 cR5000. Binned loci 32in the RH map are denoted by vertical bars spanning the most likely framework map interval. Blocks of conserved order in the human and dog genome, inferred from the cat GL map order, are shown to the left of each GL map and are bounded by their chromosomal physical coordinates in the human genome sequence assembly, NCBI build36 ((http://www.ncbi.nlm.nih.gov/projects/mapview/stats/BuildStats.cgi?taxid=9606&build=36&ver=3) or canine assembly ((http://www.ncbi.nlm.nih.gov/projects/mapview/stats/BuildStats.cgi?taxid=9615&build=2&ver=1).
Several features of the new map may be pointed out. Each autosome is spanned by a single linkage group. The current length of the sex-averaged autosomal map is 4370 cM. Resolution given this length is approximately 9 cM. Supplementary Table 1 details the positions of markers in both the current cat genetic linkage and RH map [10], positions of the loci in the current 1.9X cat genome assembly [2] Garfield browser 12.2 (http://lgd.abcc.ncifcrf.gov/cgi-bin/gbrowse/cat) [12], and conserved syntenic positions (when identified) in the human (build 36) (http://www.ncbi.nlm.nih.gov/projects/mapview/stats/BuildStats.cgi?taxid=9606&build=36&ver=3) and dog ( version 2.0) (http://www.ncbi.nlm.nih.gov/projects/mapview/stats/BuildStats.cgi?taxid=9615&build=2&ver=1) genomes. Supplementary Table 2 summarizes the number of loci per chromosome, length of genetic and radiation hybrid map [10] for each autosome and cR/cM ratio.
Three hundred and forty-nine (72%) of the STRs on the genetic map have also been mapped in the fifth generation radiation hybrid map of the cat [10]. A high degree of concordance is observed in the order of these markers in the radiation hybrid and genetic linkage map (Figure 1, Supplementary Table 1), with a single exception. Locus FCA1028 maps to chromosome D2 in the genetic linkage map, but to F1 in the current RH map [10]. We have no BLAST alignment for the flanking sequence of this STR to be able to resolve the conflict using conserved syntenic position of this region in human or dog. Other than this single STR, only minor discrepancies are observed in local ordering of adjacent markers.
Two rows of colored blocks in Figure 1 demonstrate conservation of synteny in the cat linkage map with respect to the human and dog genomes. As observed in previous maps of the cat that included comparative inferences [7; 9; 13], the cat displays remarkable conservation of synteny relative to the human genome. However, with increased resolution of the cat map, the blocks of synteny have become smaller than initially observed [13; 14]. In the current map, 78 blocks of conserved synteny are observed with the human genome and 117 blocks of conserved synteny with the dog (Figure 1). The smaller blocks of conserved synteny with human are a consequence of many intrachromosomal rearrangements in the cat relative to human, an observation also made in the fourth and fifth generation RH maps of the cat [7; 10]. As the RH map of the cat has several times as many markers as the genetic map, the former is better suited to define blocks of synteny between human and cat. The current published cat RH map, with a 900 Kb resolution, identifies 118 blocks of conserved synteny with human and 117 with the dog [7]. On the basis of the data gleaned from the fifth generation RH map of the cat [10], we estimate that 257 Mb of DNA, or roughly 9.5% of the cat genome, extend beyond the most telomeric markers in the current GL map, (see Figure 1, Supplementary Table 1).
Discussion
We report on the first genetic linkage map generated in a domestic cat pedigree. This new map includes selected loci previously mapped with linkage using a hybrid pedigree between the domestic cat and the Asian leopard cat and/or a radiation hybrid approach along with additional loci, which have not previously been mapped. A total of 964 STRs are now currently mapped in genetic autosomal and X-chromosome [11] linkage or radiation hybrid maps of the cat [4; 7; 8; 9]. The current map improves on earlier genetic maps in that it nearly doubles the density of markers previously placed, spans each autosome with a single linkage group, provides comparative inference to human and dog that was not provided by previous maps, and has been generated entirely in a domestic cat pedigree. An average heterozygosity of 0.72 for the 483 loci (Supplementary Table 3) (as compared to 0.74 reported in the first linkage map [3], is suggestive that the markers in the current map will be highly applicable for mapping purposes (in other than highly inbred pedigrees). A complementary genetic linkage map of the X-chromosome incorporating 46 STR loci spanning the entire length of the chromosome, including the pseudoautosomal region, is reported separately [11].
A previous limitation with STR or Type II markers, was that the loci had no or little comparative inference unless they were positioned within a coding gene. In the current map, eighty-two percent of the markers have a conserved syntenic position identified in both the human and dog genomes. Eighty-five percent of the markers have been positioned in the 1.9X genome sequence assembly of the cat [12] .STR markers mapped in both the GL and RH maps are identified in the cat sequence assembly browser, GARFIELD, (http://lgd.abcc.ncifcrf.gov/cgi-bin/gbrowse/cat). This allows for the precise positioning of a locus in the cat genome of a locus that shows significant linkage to an investigated phenotype, and with the additional benefit of comparative inference to the fully sequenced and annotated human, dog and other mammalian genomes. With the added resource of 1011 STRs mapped in the cat RH map [7; 10] and 208,177 STRs positioned on the 1.9X domestic cat genome sequence assembly [12], fine-mapping can be “tailored” for whatever genomic region becomes targeted in whole genome scans.
A high concordance of marker order is observed between this linkage map and the current RH map of the cat [10](Figure 1). The few discrepancies in marker order between the two maps could be due to a number of factors, including discordances between replicate assays of the RH panel, missing genotypes in the multi-generational pedigree, presence of null alleles in the pedigree which are unrecognized or markers that are poorly informative in the genetic linkage map.
The map demonstrates the high level of conserved synteny between cat and human, previously observed in radiation hybrid maps and an early physical map of the cat genome [7; 10; 13]. This data has been used to support the argument that the human and cat are representatives of the genomic structure present in their shared mammalian ancestor, and have not undergone major chromosomal shuffling [15]. While demonstrating a relatively low level of interchromosomal rearrangements relative to this imputed ancestral mammalian genome, as opposed to the mouse, dog and bear that possess a high level of such changes, the cat genome demonstrates a high incidence of intrachromosomal rearrangements [7; 10; 16].
The sex-averaged map of the cat at 4370 cM is long relative to reported lengths of many other mammalian genetic maps, including mouse (1630 cM) [17], pig (2286 cM)[18], horse (2772 cM), [19], cow (3160 cM) [20], sheep (3500 cM) [21], and human (3790 cM) [22]. A pronounced variation was observed in the rate of recombination between sexes in the cat map with a female map at 5710 cM, 1.8X the length of the male map of 3113 cM (Supplementary Table 4), a pattern reported in many mammalian genetic recombination maps, with female maps reported longer in dogs and humans and the male map longer than the female map in sheep [21–23]. The domestic cat map is also considerably longer than the length of sex-averaged maps estimated in the first (2900 cM) [3] and second (3300 cM) [4] genetic linkage maps that we previously generated in a hybrid pedigree between the domestic cat and Asian leopard cat, whose evolutionary divergence has been dated at approximately 7.2 million years ago [24].
Genetic linkage maps generated in other interspecies hybrid pedigrees including, deer [25], mouse [26] and early maps of the cow [27] have also led to shorter overall lengths. We have examined whether the shorter linkage maps generated in the domestic cat hybrid pedigree could be a reflection of some level of suppression of recombination due to lack of sequence homology, micro inversions or other factors. We report genetic distance between pairs of markers that are in the same linkage group in both the 2003 genetic map [4] and the current map (Supplementary Table 5), which suggests some increased recombination on chromosome D2 and possibly on chromosome E3. However, these previous maps generated in the hybrid pedigree had multiple linkage groups per chromosome and it was difficult to estimate the gap distance between groups. Qualitatively, what we tend to see is that some of the large distances in the present map correspond to these places where we could not put linkage groups together in the hybrid maps. This is presumably because marker sets for the earlier maps were too sparse, not because recombination was suppressed in the hybrid pedigree. We think that the present map is a more accurate reflection of the recombination distance in the domestic cat genome.
During its construction, the new cat genetic linkage map already proved to be a valuable resource in the mapping of genes underlying phenotypic variation in the domestic cat. With knowledge of recombination distances across the cat genome, markers can be selected at even recombination intervals across the genome. We have utilized the genetic linkage map and these additional mapping resources in recent years to demonstrate that 1) a novel gene, LIX1, is disrupted in feline spinal muscular atrophy in the cat [28], 2) the gene CEP290 is mutated in retinal degeneration in Abyssinian cats (rdAc) [29], which is a model of human retinal degeneration, 3) FGF5 is mutated in long-haired cats [30], 4) MLPH is mutated in dilute cats [31], (5) ASIP is mutated in black cats and MC1R is implicated in melanism in the jaguar and jagaroundi [32], (6) TYRP1 is mutated in brown and cinnamon cats [33]. Mutations in TYR have also been reported as causative of Siamese and Burmese phenotypes [34; 33].
We eagerly anticipate a higher coverage sequencing of the cat genome and the development of fine mapping resources, including the sequencing of multiple tissue-specific cDNA libraries and a single nucleotide polymorphism (SNP) chip, which will be made possible by the cat genome project. The development of these genomic resources adds to the promise of the cat as an important animal model and the mapping and characterization of the many reported spontaneously generated mutations. The integrated application of these resources should improve our understanding of many biological processes and aid in the development of health sciences for the benefit of both humans and cats.
Materials and Methods
Pedigree
The linkage map was generated in a multi-generational outbred (meaning they are not a recognized breed) domestic cat pedigree consisting of 287 individuals, (256 of which were genotyped), maintained by the Nestlé Purina PetCare Company, St. Louis, MO, 63164 [32] for nutritional studies with a maximum of 483 informative meioses.
Markers and Genotyping
A total of 525 STR markers were genotyped in the Nestlé Purina pedigree. Forty-two markers were dropped for reasons listed in Results. The remaining 483 loci consisted of 386 markers which were previously reported in either linkage or radiation hybrid maps of the cat, 92 markers which were developed during prior STR library constructions but had not been mapped [3; 4; 7; 8] and 6 markers, (FCA1350, FCA1386, FCA1387, FCA1388, FCA1405, FCA1420), mined from the cat genomic sequence as previously described [31] in targeted regions of poor marker density. PCR primers for all microsatellite markers mapped in the current genetic linkage of the cat are provided in Supplementary Table 3, including locus heterozygosities calculated from 11 unrelated founders in the Nestlé Purina pedigree. PCR amplification was performed with a touchdown PCR protocol as described previously [35]. Fluorescent dyes (FAM, NED, VIC, or PET) were incorporated into the PCR products [36] and multiple products were pooled post-PCR based upon size range and fluorescent label. Samples were electrophoresed and genotyped as previously described [31]. STR alleles were binned with Allelogram (http://code.google.com/p/allelogram/) and Mendelian inheritance patterns were confirmed with PedCheck [37].
Map construction and linkage analysis
Two-point LOD scores between all marker pairs were computed with Superlink [38; 39] for values of the recombination fraction (θ) between 0 and 0.4 in steps of 0.01. Two markers were considered linked if their peak LOD exceeded 5.0 because the number of pairs is of the magnitude 105, so we expected a small number of pairs of markers on different chromosomes to show spurious high LOD scores of approximately 5. This expectation was borne out as one pair of markers on different chromosomes showed a score of 5.03, and one of these markers was dropped; the next highest spurious score was 4.63.
Single-linkage clustering was applied using the two-point LOD scores to compute linkage groups. Until we could obtain one large linkage group per chromosome, more markers were added, using the preliminary genome assembly of the cat [2] to select STRs in physical locations that seemed promising to unify two linkage groups on the same chromosome.
For each chromosome, we used the following procedure to order all or most of the markers in the large linkage group. Using the estimated Kosambi distance [40] between markers as a distance, we reduced the marker ordering problem to the traveling salesman problem (TSP) and used CONCORDE [41] to solve TSP instances. The reduction to TSP is imperfect for linkage data of this type because of missing and uninformative genotypes, but in most cases the CONCORDE-suggested order is close to the final order. The order of linked markers was then iteratively tested and modified with the CRI-MAP version 2.4 [42] flips option, with a window size of six, until the order stabilized. To make the CRI-MAP flips computations feasible it was necessary to zero out heterozygous genotypes A B in offspring both of whose parents have the same heterozygous A B genotype, as was done in computing the cow genetic map [20]. For flips that CRI-MAP scored at lower than 1000:1 odds (LOD score under 3.0), Superlink was used to determine the likelihood of all alternative orders. In such cases, we report the odds derived from the lower of the CRI-MAP and Superlink LOD scores comparing the best order to the second best order.
Supplementary Material
Acknowledgements
We thank Richa Agarwala (National Center for Biotechnology Information, National Institutes of Health, Bethesda, MD) for her assistance in setting up the map construction computations. We also thank William J. Murphy (College of Veterinary Medicine and Biomedical Sciences, Texas A & M University) for providing the latest RH maps in the cat and for exchange which has facilitated coordination of the GL and RH maps. We additionally thank Guo Kui Pei, (Laboratory of Genomic Diversity, SAIC-Frederick, Inc.), for technical assistance in generating genotypes and Tammy Schroyer (Scientific Publication, Graphics and Media; Advanced Technology Program, SAIC-Frederick, Inc.) for generation of excellent technical drawings of the cat maps. This research was supported in part by the Intramural Research Program of the National Institutes of Health, NCI, NLM, CIT. This project has been funded in whole or in part with federal funds from the National Cancer Institute, National Institutes of Health, under contract N01-CO-12400. The content of this publication does not necessarily reflect the views or policies of the Department of Health and Human Services, nor does mention of trade names, commercial products, or organizations imply endorsement by the U.S. Government.
References
- 1.2007/2008 APPMA National Pet Owners Survey. Greenwich, CT: American Pet Products Manufacturers Association, Inc; 2007. [Google Scholar]
- 2.Pontius JU, Mullikin JC, Smith DR, Agencourt Sequencing Team. Lindblad-Toh K, Gnerre S, Clamp M, Chang J, Stephens R, Neelam B, Volfovsky N, Schäffer AA, Agarwala R, Narfström K, Murphy W, Giger U, Roca AL, Antunes A, Menotti-Raymond M, Yuhki N, Pecon-Slattery J, Johnson WE, Bourque G, Tesler G, O'Brien SJ. Initial sequence and comparative analysis of the cat genome. Genome Res. 2007;17:1675–1689. doi: 10.1101/gr.6380007. [DOI] [PMC free article] [PubMed] [Google Scholar]
- 3.Menotti-Raymond M, David VA, Lyons LA, Schäffer AA, Tomlin JF, Hutton MK, O'Brien SJ. A genetic linkage map of microsatellites in the domestic cat (Felis catus) Genomics. 1999;57:9–23. doi: 10.1006/geno.1999.5743. [DOI] [PubMed] [Google Scholar]
- 4.Menotti-Raymond M, David VA, Roelke ME, Chen ZQ, Menotti KA, Sun S, Schäffer AA, Tomlin JF, Agarwala R, O'Brien SJ, Murphy WJ. Second-generation integrated genetic linkage/radiation hybrid maps of the domestic cat (Felis catus) J. Hered. 2003;94:95–106. doi: 10.1093/jhered/esg008. [DOI] [PubMed] [Google Scholar]
- 5.Copeland NG, Jenkins NA, Gilbert DJ, Eppig JT, Maltais LJ, Miller JC, Dietrich WF, Weaver A, Lincoln SE, Steen RG, Stein LD, Nadeau JH, Lander ES. A genetic linkage map of the mouse: current applications and future prospects. Science. 1993;262:57–66. doi: 10.1126/science.8211130. [DOI] [PubMed] [Google Scholar]
- 6.Buchberg AM, Brownell E, Nagata S, Jenkins NA, Copeland NG. A comprehensive genetic map of murine chromosome 11 reveals extensive linkage conservation between mouse and human. Genetics. 1989;122:153–161. doi: 10.1093/genetics/122.1.153. [DOI] [PMC free article] [PubMed] [Google Scholar]
- 7.Murphy WJ, Davis B, David VA, Agarwala R, Schäffer AA, PearksWilkerson AJ, Neelam B, O’Brien SJ, Menotti-Raymond M. A 1.5-Mb-resolution radiation hybrid map of the cat genome and comparative analysis with the canine and human genomes. Genomics. 2007;89:189–196. doi: 10.1016/j.ygeno.2006.08.007. [DOI] [PMC free article] [PubMed] [Google Scholar]
- 8.Menotti-Raymond M, David VA, Agarwala R, Schäffer AA, Stephens R, O'Brien SJ, Murphy WJ. Radiation hybrid mapping of 304 novel microsatellites in the domestic cat genome. Cytogenet. Genome Res. 2004;102:272–276. doi: 10.1159/000075762. [DOI] [PubMed] [Google Scholar]
- 9.Murphy WJ, Sun S, Chen Z, Yuhki N, Hirschmann D, Menotti-Raymond M, O'Brien SJ. A radiation hybrid map of the cat genome: implications for comparative mapping. Genome Res. 2000;10:691–702. doi: 10.1101/gr.10.5.691. [DOI] [PMC free article] [PubMed] [Google Scholar]
- 10.Davis BW, Raudsepp T, Pearks Wilkerson AJ, Agarwala R, Schäffer AA, Houck M, Ryder OA, Chowdhary BP, Murphy WJ. A high-resolution cat radiation hybrid and integrated FISH mapping resource for phylogenomic mapping across Felidae. Genomics. doi: 10.1016/j.ygeno.2008.09.010. (In Press) [DOI] [PMC free article] [PubMed] [Google Scholar]
- 11.Schmidt-Küntzel A, Nelson G, David VA, Schäffer AA, Eizirik E, Roelke ME, Kehler JS, Hannah SS, O'Brien SJ, Menotti-Raymond M. A domestic cat X chromosome linkage map and the sex-linked orange locus-mapping of orange, multiple origins, and epistasis over non-agouti. Genetics. doi: 10.1534/genetics.108.095240. (In Press) [DOI] [PMC free article] [PubMed] [Google Scholar]
- 12.Pontius JU, O'Brien SJ. Genome annotation resource fields-- GARFIELD: A genome browser for Felis catus. J. Hered. 2007;98:386–389. doi: 10.1093/jhered/esm055. [DOI] [PubMed] [Google Scholar]
- 13.O'Brien SJ, Nash WG. Genetic mapping in mammals: chromosome map of the domestic cat. Science. 1982;216:257–265. doi: 10.1126/science.7063884. [DOI] [PubMed] [Google Scholar]
- 14.O'Brien SJ, Wienberg J, Lyons LA. Comparative genomics: lessons from cats. Trends Genet. 1997;13:393–399. doi: 10.1016/s0168-9525(97)01297-3. [DOI] [PubMed] [Google Scholar]
- 15.Murphy WJ, Stanyon R, O'Brien SJ. Evolution of mammalian genome organization inferred from comparative gene mapping. Genome Biol. 2001;2:0005.1–0005.8. doi: 10.1186/gb-2001-2-6-reviews0005. [DOI] [PMC free article] [PubMed] [Google Scholar]
- 16.O'Brien SJ, Johnson W, Driscoll C, Pontius J, Pecon-Slattery J, Menotti-Raymond M. State of cat genomics. Trends Genet. 2008;24:268–279. doi: 10.1016/j.tig.2008.03.004. [DOI] [PMC free article] [PubMed] [Google Scholar]
- 17.Shifman S, Bell JT, Copley RR, Taylor MS, Williams RW, Mott R, Flint J. A high-resolution single nucleotide polymorphism genetic map of the mouse genome. PLoS Biol. 2006;4:e395. doi: 10.1371/journal.pbio.0040395. [DOI] [PMC free article] [PubMed] [Google Scholar]
- 18.Rohrer GA, Alexander LJ, Hu Z, Smith TP, Keele JW, Beattie CW. A comprehensive map of the porcine genome. Genome Res. 1996;6:371–391. doi: 10.1101/gr.6.5.371. [DOI] [PubMed] [Google Scholar]
- 19.Swinburne JE, Boursnell M, Hill G, Pettitt L, Allen T, Chowdhary B, Hasegawa T, Kurosawa M, Leeb T, Mashima S, Mickelson JR, Raudsepp T, Tozaki T, Binns M. Single linkage group per chromosome genetic linkage map for the horse, based on two three-generation, full-sibling, crossbred horse reference families. Genomics. 2006;87:1–29. doi: 10.1016/j.ygeno.2005.09.001. [DOI] [PubMed] [Google Scholar]
- 20.Ihara N, Takasuga A, Mizoshita K, Takeda H, Sugimoto M, Mizoguchi Y, Hirano T, Itoh T, Watanabe T, Reed KM, Snelling WM, Kappes SM, Beattie CW, Bennett GL, Sugimoto Y. A comprehensive genetic map of the cattle genome based on 3802 microsatellites. Genome Res. 2004;14:1987–1998. doi: 10.1101/gr.2741704. [DOI] [PMC free article] [PubMed] [Google Scholar]
- 21.Maddox JF, Davies KP, Crawford AM, Hulme DJ, Vaiman D, Cribiu EP, Freking BA, Beh KJ, Cockett NE, Kang N, Riffkin CD, Drinkwater R, Moore SS, Dodds KG, Lumsden JM, van Stijn TC, Phua SH, Adelson DL, Burkin HR, Broom JE, Buitkamp J, Cambridge L, Cushwa WT, Gerard E, Galloway SM, Harrison B, Hawken RJ, Hiendleder S, Henry HM, Medrano JF, Paterson KA, Schibler L, Stone RT, van Hest B. An enhanced linkage map of the sheep genome comprising more than 1000 loci. Genome Res. 2001;11:1275–1289. doi: 10.1101/gr.135001. [DOI] [PMC free article] [PubMed] [Google Scholar]
- 22.Matise TC, Chen F, Chen W, De La Vega FM, Hansen M, He C, Hyland FC, Kennedy GC, Kong X, Murray SS, Ziegle JS, Stewart WC, Buyske S. A second-generation combined linkage physical map of the human genome. Genome Res. 2007;17:1783–1786. doi: 10.1101/gr.7156307. [DOI] [PMC free article] [PubMed] [Google Scholar]
- 23.Neff MW, Broman KW, Mellersh CS, Ray K, Acland GM, Aguirre GD, Ziegle JS, Ostrander EA, Rine J. A second-generation genetic linkage map of the domestic dog, Canis familiaris. Genetics. 1999;151:803–820. doi: 10.1093/genetics/151.2.803. [DOI] [PMC free article] [PubMed] [Google Scholar]
- 24.Johnson WE, Eizirik E, Pecon-Slattery J, Murphy WJ, Antunes A, Teeling E, O'Brien SJ. The late miocene radiation of modern felidae: a genetic assessment. Science. 2006;311:73–77. doi: 10.1126/science.1122277. [DOI] [PubMed] [Google Scholar]
- 25.Slate J, Van Stijn TC, Anderson RM, McEwan KM, Maqbool NJ, Mathias HC, Bixley MJ, Stevens DR, Molenaar AJ, Beever JE, Galloway SM, Tate ML. A deer (subfamily Cervinae) genetic linkage map and the evolution of ruminant genomes. Genetics. 2002;160:1587–1597. doi: 10.1093/genetics/160.4.1587. [DOI] [PMC free article] [PubMed] [Google Scholar]
- 26.Hammer MF, Schimenti J, Silver LM. Evolution of mouse chromosome 17 and the origin of inversions associated with T haplotypes. Proc. Natl. Acad. Sci. USA. 1989;86:3261–3265. doi: 10.1073/pnas.86.9.3261. [DOI] [PMC free article] [PubMed] [Google Scholar]
- 27.Yang YP, Rexroad CE, 3rd, Schlapfer J, Womack JE. An integrated radiation hybrid map of bovine chromosome 19 and ordered comparative mapping with human chromosome 17. Genomics. 1998;48:93–99. doi: 10.1006/geno.1997.5143. [DOI] [PubMed] [Google Scholar]
- 28.Fyfe JC, Menotti-Raymond M, David VA, Brichta L, Schäffer AA, Agarwala R, Murphy WJ, Wedemeyer WJ, Gregory BL, Buzzell BG, Drummond MC, Wirth B, O'Brien SJ. An ~140-kb deletion associated with feline spinal uscular atrophy implies an essential LIX1 function for motor neuron survival. Genome Res. 2006;16:1084–1090. doi: 10.1101/gr.5268806. [DOI] [PMC free article] [PubMed] [Google Scholar]
- 29.Menotti-Raymond M, David VA, Schäffer AA, Stephens R, Wells D, Kumar-Singh R, O'Brien SJ, Narfström K. Mutation in CEP290 discovered for cat model of human retinal degeneration. J. Hered. 2007;98:211–220. doi: 10.1093/jhered/esm019. [DOI] [PubMed] [Google Scholar]
- 30.Kehler JS, David VA, Schäffer AA, Eizirik E, Ryugo DK, Hannah SS, O'Brien SJ, Menotti-Raymond M. Four separate mutations in the feline fibroblast growth factor 5 gene determine the long-haired phenotype in domestic cats. J. Hered. 2007;98:555–566. doi: 10.1093/jhered/esm072. [DOI] [PMC free article] [PubMed] [Google Scholar]
- 31.Ishida Y, David VA, Eizirik E, Schäffer AA, Neelam BA, Roelke ME, Hannah SS, O'Brien J, Menotti-Raymond SM. A homozygous single-base deletion in MLPH causes the dilute coat color phenotype in the domestic cat. Genomics. 2006;88:698–705. doi: 10.1016/j.ygeno.2006.06.006. [DOI] [PubMed] [Google Scholar]
- 32.Eizirik E, Yuhki N, Johnson WE, Menotti-Raymond M, Hannah S, O'Brien SJ. Molecular genetics and evolution of melanism in the cat family. Curr. Bio. 2003;13:1–20. doi: 10.1016/s0960-9822(03)00128-3. [DOI] [PubMed] [Google Scholar]
- 33.Schmidt-Kuntzel A, Eizirik E, O'Brien SJ, Menotti-Raymond M. Tyrosinase and tyrosinase related protein 1 alleles specify domestic cat coat color phenotypes of the albino and brown loci. J. Hered. 2005;96:289–301. doi: 10.1093/jhered/esi066. [DOI] [PubMed] [Google Scholar]
- 34.Lyons LA, Imes DL, Rah HC, Grahn RA. Tyrosinase mutations associated with Siamese and Burmese patterns in the domestic cat (Felis catus) Anim. Genet. 2005;36:119–126. doi: 10.1111/j.1365-2052.2005.01253.x. [DOI] [PubMed] [Google Scholar]
- 35.Menotti-Raymond MA, David VA, Wachter LL, Butler JM, O'rien SJ. An STR forensic typing system for genetic individualization of domestic cat (Felis catus) samples. J. Foren. Sci. 2005;50:1061–1070. [PubMed] [Google Scholar]
- 36.Boutin-Ganache I, Raposo M, Raymond M, Deschepper CF. M13-tailed primers improve the readability and usability of microsatellite analyses performed with two different allele-sizing methods. Biotechniques. 2001;31:24–26. 28. [PubMed] [Google Scholar]
- 37.O'onnell JR, Weeks DE. PedCheck: a program for identification of genotype incompatibilities in linkage analysis. Am. J. Hum. Genet. 1998;68:259–266. doi: 10.1086/301904. [DOI] [PMC free article] [PubMed] [Google Scholar]
- 38.Fishelson M, Geiger D. Exact genetic linkage computations for general pedigrees. Bioinformatics. 2002;18 Suppl 1:S189–S198. doi: 10.1093/bioinformatics/18.suppl_1.s189. [DOI] [PubMed] [Google Scholar]
- 39.Fishelson M, Geiger D. Optimizing exact genetic linkage computations. J. Comput. Biol. 2004;11:263–275. doi: 10.1089/1066527041410409. [DOI] [PubMed] [Google Scholar]
- 40.Ott J. Analysis of Human Genetic Linkage. Baltimore, MD: Johns Hopkins University Press; 1991. Revised edition. [Google Scholar]
- 41.Applegate D, Bixby R, Chvátal V, Cook W. The Traveling Salesman Problem: A Computational Study. Princeton, NJ: Princeton University Press; 2006. [Google Scholar]
- 42.Lander ES, Green P. Construction of multilocus genetic linkage maps in humans. Proc. Natl. Acad. Sci. USA. 1987;84:2363–2367. doi: 10.1073/pnas.84.8.2363. [DOI] [PMC free article] [PubMed] [Google Scholar]
Associated Data
This section collects any data citations, data availability statements, or supplementary materials included in this article.


