

Abstract
It is well documented that the tumor promoter 12-O-tetradecanoylphorbol-13-acetate (TPA) can activate manganese superoxide dismutase (MnSOD) expression. However, it is unclear how repeated exposure to TPA following a single application of tumor initiator 7,12-dimethylbenz-(a)-anthracene causes tumor development. We generated transgenic mice expressing human MnSOD promoter-and enhancer-driven luciferase reporter gene and used a noninvasive imaging system to investigate the effects of TPA on MnSOD expression in vivo. Our data indicate that TPA initially activates MnSOD expression, but this positive effect declines after repeated applications. Changes in MnSOD expression in vivo were verified by measuring MnSOD mRNA and protein levels. Using chromatin immunoprecipitation coupled to Western analysis of the transcription factors known to be essential for the constitutive and TPA-induced transcription of MnSOD, we found that TPA treatment leads to both activation and inactivation of MnSOD gene transcription. During the activation phase, the levels of p50, p65, specificity protein 1 (Sp1) and nucleophosmin (NPM) increase after TPA treatments. Sustained treatments with TPA lead to further increase of p50 but not p65, Sp1 or NPM, suggesting that excess p50 may have inhibitory effects leading to the suppression of MnSOD. Alteration of p50 levels by expressing p50 cDNA or p50 small interfering RNA in mouse epithelial (JB6) cells confirms that p50 is inhibitory to MnSOD transcription. These findings identify p50 as having a negative effect on MnSOD induction upon repeated applications of TPA and provide an insight into a cause for the reduction of MnSOD expression during early stages of skin carcinogenesis.
Introduction
Manganese superoxide dismutase (MnSOD) is a mitochondrial antioxidant enzyme coded by the sod2 gene located on human chromosome 6q25.3 (1,2). The human MnSOD gene (sod2) is a single-copy gene consisting of five exons interrupted by four introns with typical splice junctions (3). Sod2 genes from human, bovine, rat and mouse share >90% homology in the coding sequence, but the 5′-flanking regions are less homologous between human and other species (4).
Although expression of MnSOD is essential for the survival of all aerobic organisms (5), it is known that expression of MnSOD is reduced in many transformed cells and cancer cells (reviewed in ref. 6). Numerous studies show that increased cellular levels of MnSOD are cytoprotective against oxidative stress (7,8), inflammatory responses and tumor promoters such as 12-O-tetradecanoylphorbol-13-acetate (TPA) (9,10), ionizing radiation (11–13) and neurotoxins (14,15). The critical role of MnSOD as a cytoprotective enzyme is illustrated in both MnSOD knockout and transgenic animal models. For instance, MnSOD knockout mice developed cardiomyopathy and died within a few days after birth (16). MnSOD knockout mice treated with a superoxide dismutase mimetic were protected from systemic toxicity and from neonatal lethality (17). Conversely, transgenic mice over-expressing human MnSOD experienced less injury resulting from inflammation (18), acute adriamycin-induced cardiac injury (19) and beta-amyloid-induced brain injury (20). Additionally, several studies suggest that MnSOD may act as a tumor suppressor (21–24) by modulating redox-sensitive transcription factors (25).
We have previously demonstrated that increased expression of MnSOD protects against TPA-induced skin tumors using a well-established skin carcinogenesis model (26). In this model, tumors developed after single application of a subthreshold dose of the mutagenic chemical initiator 7,12-dimethylbenz-(a)-anthracene, followed by repeated treatments of TPA. However, how multiple TPA treatments modulate the expression of the MnSOD gene is unknown. It has been demonstrated that a single application of TPA induces both MnSOD mRNA and protein level in isolated mouse skin epithelial cells (26). TPA is known to mediate signal transduction through activation of kinases and inactivation of phosphatases, respectively (27,28). Treatment with TPA also produces reactive oxygen species, which can cause oxidative damage to macromolecules, leading to alteration of cellular redox status (29,30). We have shown previously that TPA-induced MnSOD expression is associated with an increase in the levels of transcription factors known to be necessary for the basal and induced expression of MnSOD, including specificity protein 1 (Sp1) and nuclear factor-kappa B (NF-κB) members. Sp1 and NF-κB play important roles in the basal and induced expressions of the human sod2 gene, respectively (31,32). The basal promoter of the sod2 gene has multiple transcription factor-binding motifs for Sp1 and activating protein 2 (AP2). Functional studies with differing levels of Sp1 and AP2 protein suggest that cellular levels of these proteins differentially regulate the expression of the MnSOD gene. Sp1 is essential, whereas AP2 is unnecessary and antagonistic, to constitutive expression of the gene (31,33).
The role of Sp1 on NF-κB-mediated induction of the MnSOD gene is unclear. It has been shown that Sp1 interferes with the DNA-binding sites of NF-κB (34); it has also been demonstrated that Sp1 bound to distal enhancer regions can interact with Sp1 bound to sites that are proximal to the promoter and synergistically activate transcription (35). Functional analysis of the enhancer element of the MnSOD gene demonstrates that the intronic enhancer element has NF-κB-binding motifs that are responsible for TPA and cytokines (36). NF-κB forms various homo- and heterodimer units among the mammalian subunits of p50, p52, p65 (Rel A), c-Rel and Rel B. These dimers in turn bind to a group of NF-κB DNA-binding sites with different affinities within the target genes, with the p50–p65 heterodimer being a potential transcription activator of NF-κB target genes (37,38). Because of the lack of transactivation domains, p50 is considered to be mainly responsible for DNA binding. p50–p50 homodimers in the nucleus can function as a transcription repressor by inhibiting p50–p65 heterodimers binding to DNA (39). However, how this affects the expression of MnSOD during cancer development is unknown.
In this study, we developed a line of transgenic mice expressing the human MnSOD promoter- and enhancer-driven luciferase gene in the skin, which permits continuous non-invasive imaging of MnSOD expression during the carcinogenesis process. We report here that reduced MnSOD expression occurs very early in the process of skin carcinogenesis, due, in part, to differential increase in the levels of NF-κB members.
Materials and methods
Reagents
Unless otherwise stated, all antibodies were purchased from Santa Cruz Biotechnology (Santa Cruz, CA). Anti-β-actin antibody was purchased from Sigma (St.Louis, MD). MnSOD, Glyceraldehyde 3-phosphate dehydrogenase (GAPDH) antibodies and chromatin immunoprecipitation (ChIP) assay kits were purchased from Upstate Biotechnologies (Lake Placid, NY). All chemicals were purchased from Sigma, unless otherwise indicated.
Treatment of animals
All procedures using animals were performed according to the protocols approved for breeding, care and use of animals by the University of Kentucky. Female mice (6–8 weeks) bearing human MnSOD reporter gene were used throughout the study. Only animals in the resting phase of the hair cycle were used. TPA (4 µg/mouse/day) or dimethyl sulfoxide was applied to the shaved area (18–20 cm2) of the mouse skin.
Anesthesia
For non-invasive imaging, mice were anesthetized by injecting 40 µl of keta-min and xylazine (4:1) intra-peritoneally. Following non-invasive imaging analysis, animals were kept warm and allowed to recover from anesthesia before being returned to their normal environment.
Substrate and delivery to skin
Since the animals used for non-invasive imaging stably expressed the MnSODluciferase reporter gene, d-luciferin was used as the substrate for reporter gene detection and quantification. Seventy microliters of substrate d-luciferin (12.5 mM) pre-dissolved in 100% dimethyl sulfoxide was applied for transdermal delivery to monitor luciferase expression in the skin.
In vivo bioluminescence
We used an IVIS® imaging system 100 (Xenogen, Hopkinton, MA) with living image acquisition and analysis software (version 2.20, Xenogen) to detect the bioluminescent signals in mice skin. During imaging, anesthetized animals were placed in a light-tight chamber with a constant heating device, and then a gray-scale body surface reference image was collected. The imaging system first took a photographic image in the chamber under dim illumination; this was followed by luminescent image acquisition. The overlay of pseudocolor image represents the distribution of photon counts produced by active luciferase. An integration time of 1 min was used for luminescent image acquisition for all the animals used for non-invasive bioluminescent imaging. The bioluminescent signals appearing on the skin were gated with an equal dimension (1.54 cm2 on the back of the shaved area just above the mouse tail) and photons were counted by image analysis software.
ChIP assay
ChIP assays were carried out as described previously (40). Briefly, histone to DNA was cross-linked by adding formaldehyde to skin cells to a concentration of 1% and then incubated for 30 min at 37°C. Cells were then suspended in sodium dodecyl sulfate (SDS) lysis buffer with protease inhibitor. Chromatin was sheared by sonication to obtain DNA lengths between 200 and 1000 bp and immunoprecipitated with appropriate antibodies. Antibody–chromatin complexes were analyzed by either western blotting or polymerase chain reaction (PCR). For PCR, DNA proteins were eluted with elution buffer (1% SDS and 0.1 M NaHCO3). Reversal of cross-linking was performed. Proteins were digested and DNA was then recovered by phenol:chloroform extraction and ethanol precipitation. Immunoprecipitated DNA was analyzed by PCR amplification.
Construction of plasmid
A BamH1 fragment (B7) containing a 3.4 kb 5′-flanking region was used to generate the −555 to +24 basal MnSOD promoters by PCR. To create this construct, PCR primers with recognition sequences of Kpn1 (upstream) and BglII (downstream) restriction sites were added for subcloning at the upstream of the luciferase reporter gene. To generate intronic fragment constructs (I2E) (1742–2083) and ExI2E (+1 to +2179), BamH1 digested 39b λ-phase DNA, containing the human MnSOD gene (8074 bp), was used as the template for PCR amplification. The PCR product was then ligated to the BglII site of the promoter containing PGL3 basic vector, which yielded the natural orientation of the gene. The primer sequences are as follows: forward primer, (−555) 5′ -CGGGGTACCCGCTGGCTCTACCCTCAGCTCATA-3′; reverse primer, (+24) 5′ -GGAAGATCTGCCGAAGCCACCACAGCCACGAGT-3′; forward primer, (+1742) 5′ -GGAAGATCTCGGGGTTATGAAATTTGTTGAGTA-3′; reverse primer, (+2083) 5′ -GGAAGATCTCCACAAGTAAAGGACTG AAATTAA-3′; forward primer, (+55) 5′ -GGAAGATCTGTAGCACCAGC ACTAGCAGCAT-3′ and reverse primer, (+2179) 5′ -GGAAGATCTAG CTCTGCAGGTACTCCAATCAC-3′.
After PCR amplified I2E or ExI2E fragments were separately subcloned into the pGL3 vector containing human MnSOD basal promoter. PCR constructs were verified by DNA sequencing. ExI2E was further modified by removing the redundant nucleotides. The ExI2E containing luciferase plasmid DNA was used for generating transgenic animals.
pcDNA3.1/Sp1 and pcDNA3.1/p50, the cDNA clone for Sp1 and p50, respectively, were subcloned into the pcDNA3.1 expression vector.
Generation of transgenic mice
The human MnSOD promoter–enhancer-driven reporter gene construct (−555 to +24/ExI2E/pGL3) was restriction digested with Kpn1 and Sal1 to remove the bacterial sequences in the vector. Purified DNA was introduced by microinjection into the pronuclei of mouse fertilized eggs, as described previously (41). Transgenic mice were produced by using F1 progeny of the C57BL/6 × C3H hybrid (B6C3). Three founders with stably integrated human MnSOD promoter–enhancer were identified by Southern blotting. Transgenic mice derived from a founder that expresses a low level of luciferase activity were used. All animals were propagated as heterozygous transgenic mice, and littermates negative for the luciferase gene were used as wild-type controls.
Southern blotting
To identify transgenic mice carrying the human MnSOD gene construct, genomic DNAwas isolated from mouse tail, as described previously (42). Tail DNA was digested with the restriction enzyme Kpn1 and B glII, separated on 1% formaldehyde agarose gel and transferred to nylon membrane. The membrane was pre-hybridized and then hybridized with 32p-labeled intronic fragment (1742–2083) of the MnSOD gene as probe, as described previously (43). The membrane was then exposed to Kodak XAR film at −80°C.
Transient transfection and luciferase assay
JB6 cells were transfected with plasmids following a Lipofectamin® transfection, according to the manufacturer’s protocol. Cells were co-transfected with 2 µM plasmid DNA constructs containing the enhancer or promoter fragments of the human MnSOD gene in pGL3 vector. pRL-TK/renilla-cDNA was used as an internal control at a concentration of 0.2 µM. Sp1 expression vector (pcDNA3.1/Sp1) and p50 expression vector (pcDNA3.1/p50) were co-transfected with MnSOD promoter containing pGL3 reporter vector in cells for 24 h. In another experiment, Sp1 expression vector and p50 small interfering RNA (siRNA) or control siRNA were co-transfected with MnSOD promoter and enhancer containing pGL3 vector. The cells were treated with TPA for 12 h and then analyzed using the luciferase reporter assay system, by TD-20/20 luminometer (Turner Design Promega, Madison, WI), following the manufacturer’s instructions.
MnSOD activity assay
Mouse skin tissues were harvested and homogenized. MnSOD activity was measured by nitroblue tetrazolium reduction using xanthine and xanthine oxidase for superoxide generation, as described by Spitz et al. (44).
Nuclear extract preparation
Nuclei were isolated from one million isolated skin cells. Briefly, cells were re-suspended in buffer A containing 10 mM N-2-hydroxyethylpiperazine-N′- 2-ethanesulfonic acid (pH 7.9), 1.5 mM MgCl2, 10 mM KCl, 0.5 mM dithio-threitol and protease inhibitor. The cell suspension was incubated on ice for 15 min; 12.5 µl of 10% Nonidet P-40 was added, and the mixture was vortexed for 15 s. The cytoplasmic and nuclear fractions were separated by centrifugation at 17 000g at 4°C for 30 s. The nuclear pellets were re-suspended in buffer B containing 20 mM N-2-hydroxyethylpiperazine-N′-2-ethanesulfonic acid (pH 7.9), 1.5 mM MgCl2, 420 mM NaCl, 0.2 mM ethylenediaminetetraacetic acid, 35% glycerol, 0.5 mM dithiothreitol and protease inhibitors. Nuclear proteins in the supernatant fraction were collected by centrifugation at 14 000g at 4°C for 2 min.
Electrophoretic mobility shift assay
The consensus double-stranded oligonucleotides of NF-κB sequence 5′-AGTTGAGGGGACTTTCCCAGGC-3′ and Sp1 sequence 5′-ATTCGATC GGGGCGGGGCGAGC-3′ (Promega, Madison, WI) were radioactively labeled with [γ-32P] ATP and T4 polynucleotide kinases. The probes were purified on 20% native polyacrylamide gel and eluted in Tris-EDTA buffer (pH 7.4). The activity of radiolabeled probes was counted and stored at −80°C. In each reaction, 5 µg of nuclear protein and 6 µl of 5 × binding buffer containing 20% (v/v) glycerol, 5 mM MgCl2, 2.5 mM ethylenediaminetetraacetic acid, 5 mM dithiothreitol, 50 mM Tris–HCl (pH 7.5), 0.25 mg/ml poly (dIdC) and 50 000 c.p.m. radiolabeled probe with a final volume of 30 µl were used. Samples were incubated for 20 min at room temperature. Super-shift experiments were performed by adding 1 µg of the anti-p50 antibody and extending the incubation to 1 h. DNA–protein complexes were separated from unbound probes on 6% polyacrylamide native gel.
Western analysis
Samples were subjected to SDS–polyacrylamide gel electrophoresis and transferred to a nitrocellulose membrane. The membranes were incubated in the primary antibody for 2 h at room temperature or overnight at 4°C. The membranes were incubated with the secondary antibody after being washed twice with Tris-Buffered Saline Tween-20. Proteins were detected using the enhanced chemiluminescence detection system (ECL®, Amersham Biosciences Piscataway, NJ). The Quantity One® Image Analyzer software program (Bio-Rad Hercules, CA) was used for quantitative analysis.
RNA isolation, cDNA synthesis and reverse transcription–PCR
Total RNA was isolated by using TRIzol reagent (Invitrogen Carlsbad, CA), according to the manufacturer’s protocol. Briefly, the cells were suspended in 1 ml of TRIzol reagent and incubated at room temperature for 15 min. Chloroform (0.2 ml) was added to the sample, vortexed and then incubated at room temperature for 10 min. The RNA containing aqueous phase was extracted after centrifugation at 12 000g for 15 min at 4°C. RNA was precipitated with isopropyl alcohol; the pellet was washed with 70% ethanol and then air dried. RNA samples having an A260:A280 ratio of 18.0 ± 0.5 were used for reverse transcription (RT)–PCR.
For RT, cDNA was generated using 0.4 µg of total RNA, oligo(dT) primer and Moloney murine leukemia virus reverse transcriptase, according to the manufacturer’s instructions (RT-for-PCR kit, Clontech Laboratories Mountain View, CA), in a total volume of 20 µl. Two microliters of cDNAwas amplified using the primer sets for mouse MnSOD and β-actin (primer sequence is available upon request). PCR products were separated on agarose gel and visualized by ethidium bromide.
Statistical analysis
Data were analyzed using one-way analysis of variance. Bonferroni’s post-test multiple comparison procedure was used to determine statistical significance. Each data point is represented as mean ± SD.
Results
Characterization of transgenic mice
A 2.7 kb DNA containing MnSOD basal promoter (−555 to +1) and enhancer (ExI2E, +1 to +2179) (Figure 1A) was used to drive the expression of the luciferase reporter gene. Stable integration of the human MnSOD promoter and intronic fragment in transgenic mice was demonstrated by Southern blot analysis of mouse genomic DNA using cDNA from intronic fragments of the gene as a probe. DNA isolated from transgenic mice bearing the human MnSOD promoter and enhancer elements shows an expected band at a molecular mass of 2.7 kb. Endogenous mouse MnSOD gene was detected using a probe made from intronic enhancer element (Figure 1B). The expression of luciferase gene was verified by measuring luciferase activity from the mouse skin. Transgenic mice did not show any difference in their MnSOD protein or activity levels compared with non-transgenic littermates [Figure 1B (c and d)].
Fig. 1. Characterization of transgene and determination of MnSOD transcription in vivo.
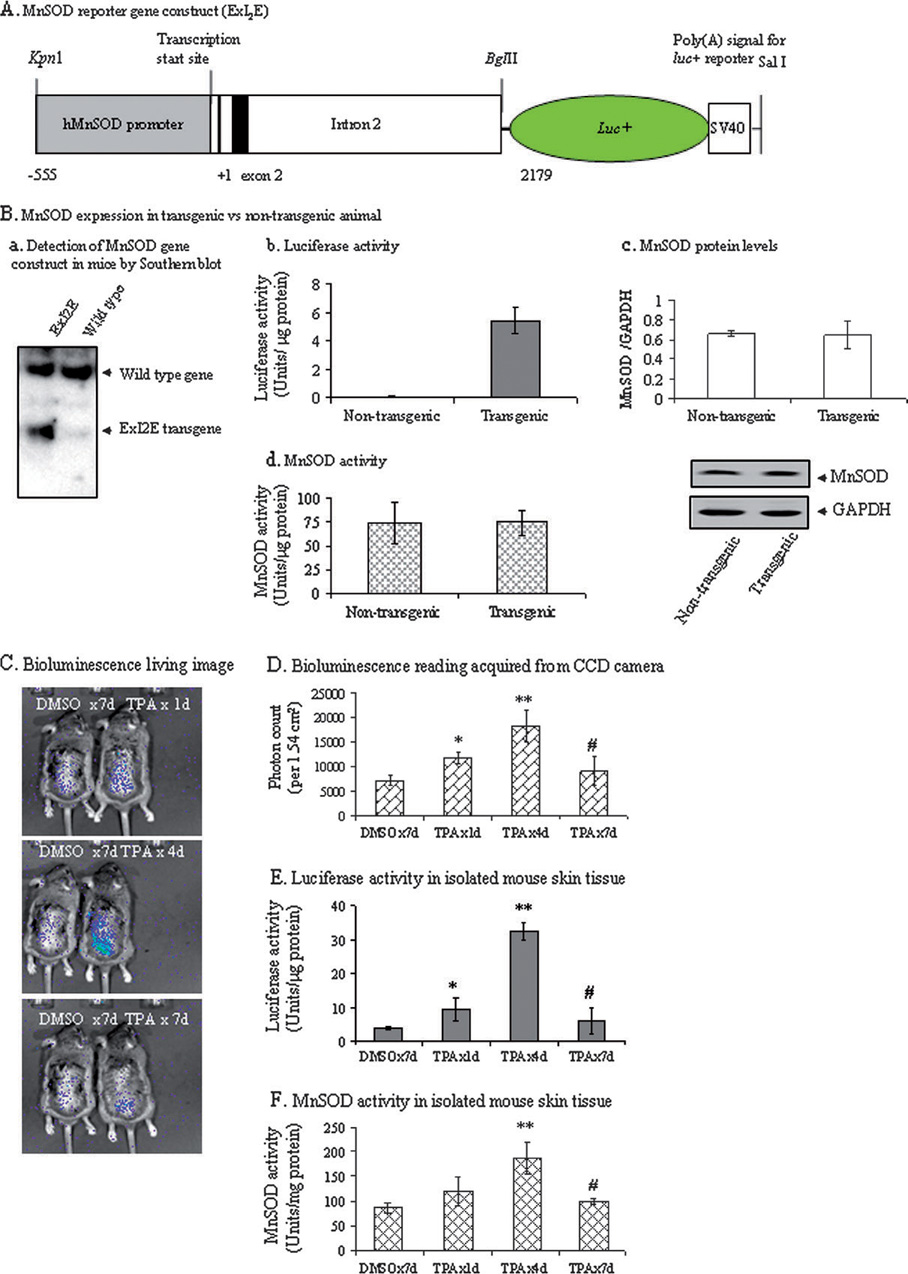
(A) MnSOD promoter–enhancer-driven luciferase expression construct for the generation of transgenic mice. The 2.7 kb human MnSOD basal promoter- and enhancer-driven luciferase gene construct was used for microinjection to generate transgenic mice. (B) a, Detection of human MnSOD gene in transgenic mice. Kpn1 and BglII restriction-digested genomic DNAs from mouse tails were electrophoresed in 1% agarose gel, transferred onto nylon membrane and then hybridized with MnSOD intronic element. Transgenic mice showed ExI2E band at ~2.7 kb. Endogenous genes were detected in both transgenic and non-transgenic animals; b, the luciferase activity was determined from the skin tissue extracts in transgenic mice and their non-transgenic littermates using luciferase assay kit (Promega); c, MnSOD protein and d, activity levels in transgenic mice and their nontransgenic littermates. (C) Bioluminescence images of mice treated with TPA (4 µg/mouse/day) were acquired by CCD camera. (D) Bioluminescent signals were quantified in terms of photon count which in turn represents the reporter gene activity in living mice. Bioluminescent images were gated to an area (1.54 cm2) where signals are generated after the application of substrate d-luciferin. Photon counts were estimated within that defined gated area. (E) The same animals were humanely euthanized and skin tissues were harvested. The luciferase activity was determined from the skin tissue extracts using luciferase assay kit (Promega). (F) MnSOD activity (U/mg protein) in controls and TPA-treated skin tissues. All data are representative of three independent sets of experiments. Significantly different from control; *P < 0.05 and **P < 0.01; significantly different from 4-day repeated treatment groups; #P < 0.01.
Non-invasive in vivo monitoring of transgene expression
Transgenic mice expressing the luciferase gene under the control of MnSOD promoter and enhancer were used to monitor MnSOD expression after daily treatment with TPA (4 µg/mice/day). Prior to each measurement, d-luciferin was painted on the back of each mouse. Mice were placed under the CCD camera. Enzyme substrate reaction was allowed to stabilize for 20 min, and bioluminescence was monitored in terms of photon signal. TPA induces MnSOD reporter gene activity as early as 1 day after treatment and continues to increase up to four repeated treatments. The maximum induction of MnSOD gene is observed at day 4 and declines afterward to a near control level by 7 days after TPA applications (Figure 1C and D). This result was verified by measuring the luciferase activity in isolated skin tissues (Figure 1E). MnSOD activity was also measured to verify the functional relevance of the above finding. The changes in MnSOD activity as a function of number of TPA applications were consistent with the results obtained from reporter gene activity (Figure 1F).
TPA induces endogenous MnSOD expression
To confirm the effect of TPA on MnSOD induction in vivo, we determined the endogenous mouse MnSOD mRNA and protein levels. MnSOD mRNA increases ~1.5-fold after a single application of TPA on mouse skin. The mRNA level is further increased with the repeated application of TPA up to four applications. By seven applications, the mRNA levels return to the control level (Figure 2A). Consistent with the mRNA level, endogenous MnSOD protein levels increase at 1 day and reach the maximum after four repeated applications. Seven days after repeated applications of TPA, MnSOD induction is lost and returns to a level almost identical to the level in the vehicle alone (Figure 2B).
Fig. 2. MnSOD mRNA and protein levels in vivo and alteration of transcription factor.
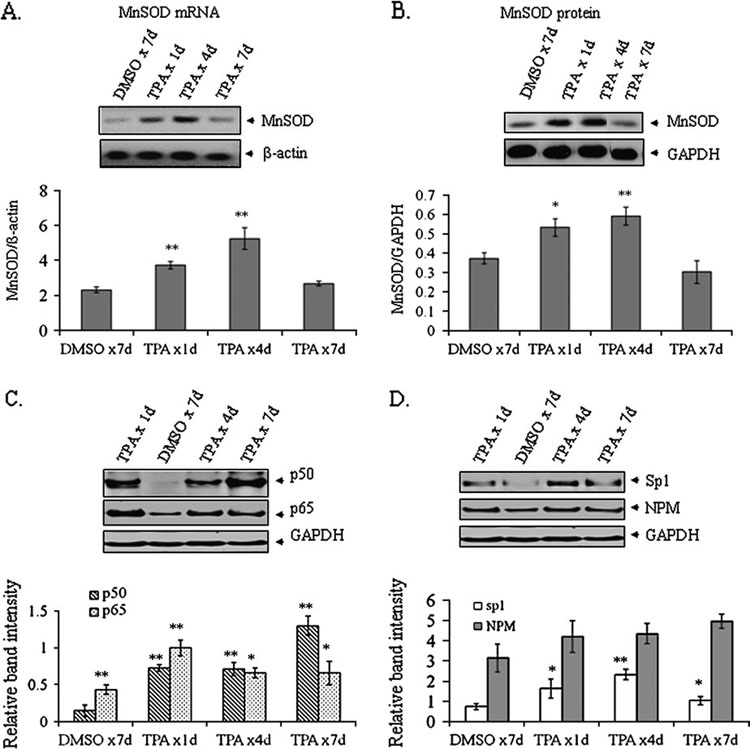
(A) Mice were repeatedly treated with TPA (4 µg/mouse/day) at indicated times and skin tissues were collected for RNA isolation. RNAs were isolated and purified by TRIzol method according to the manufacturer’s instructions. cDNAs were prepared and RT–PCR was carried out using mouse-specific MnSOD primer as described under Materials and methods. For quantification of mRNA, PCR bands were densitometrically scanned and normalized with β-actin. (B) Western blotting was used to determine the MnSOD protein level in skin epithelial tissue homogenate by using rabbit polyclonal MnSOD antibody. (C) Equal amounts of nuclear protein were subjected to 10% SDS–polyacrylamide gel electrophoresis and western blotting was performed using antibodies specific to p50 and p65. (D) The same membrane was reprobed with Sp1 or NPM antibody. Protein bands were densitometrically scanned and normalized with GAPDH as loading control. All data sets consist of three representative experiments. Significantly different from control; *P < 0.05 and **P < 0.01.
Identification of transcription factors
To identify transcription factors participating in the changes of MnSOD transcription following TPA treatments, we isolated nuclear extracts from the corresponding mouse skin epithelium and used western blotting to measure the levels of transcription factors known to be essential for the induction of MnSOD. The results demonstrate that both p50 and p65 increase after single or repeated applications of TPA. The maximum level of p65 occurs 1 day after single application and gradually decreases thereafter. In contrast, p50 level continues to increase with subsequent applications and reaches a very high level after seven repeated applications (Figure 2C). The level of Sp1, an essential MnSOD promoter-binding transcription factor, increases after a single application of TPA. The highest level of Sp1 is observed at 4 days after repeated applications of TPA and declines to near control level by 7 days after repeated applications (Figure 2D). Nucleophosmin (NPM), another transcription co-activator, increases after a single application of TPA, and its level is sustained throughout repeated applications (Figure 2D).
To verify the presence of these transcription factors within the MnSOD promoter and enhancer in vivo, we cross-linked the proteins with DNA in vivo by formaldehyde. The cross-linked DNA–protein complexes were subjected to ChIP by using an antibody specific to p50, Sp1 or NPM. The product of immunoprecipitation was analyzed by western blotting and PCR amplification. To obtain the enhancer and promoter regions of the MnSOD gene, we decross-linked the DNA–protein complex and purified DNA for PCR amplification. Using the purified DNA as a template, both the promoter and intronic enhancer (I2E) fragments were amplified (Figure 3A). The intronic enhancer fragment was obtained in immunoprecipitates of p50 and NPM antibodies but not the Sp1 antibody. The Sp1 antibody only immunoprecipitates DNA sequence in the promoter region, whereas p50 and NPM antibodies immunoprecipitate DNA in both promoter and enhancer fragments (Figure 3A). To confirm the presence of these proteins in the promoter–enhancer complex, chromatin immunocomplexes were subjected to 10% SDS–polyacrylamide gel, transferred onto nitrocellulose membrane and probed with antibodies specific to p65, Sp1 and NPM. As shown in Figure 3B, antibody to p50 immunoprecipitates Sp1, p65 and NPM; antibody to Sp1 immunoprecipitates p65 and NPM and NPM antibody immunoprecipitates p65 and Sp1, suggesting an interaction among these proteins. The interaction between Sp1 with p65, Sp1 with NPM and NPM with p65 is increased 24 h after TPA application.
Fig. 3. Association of transcription factors to MnSOD promoter and enhancer element.
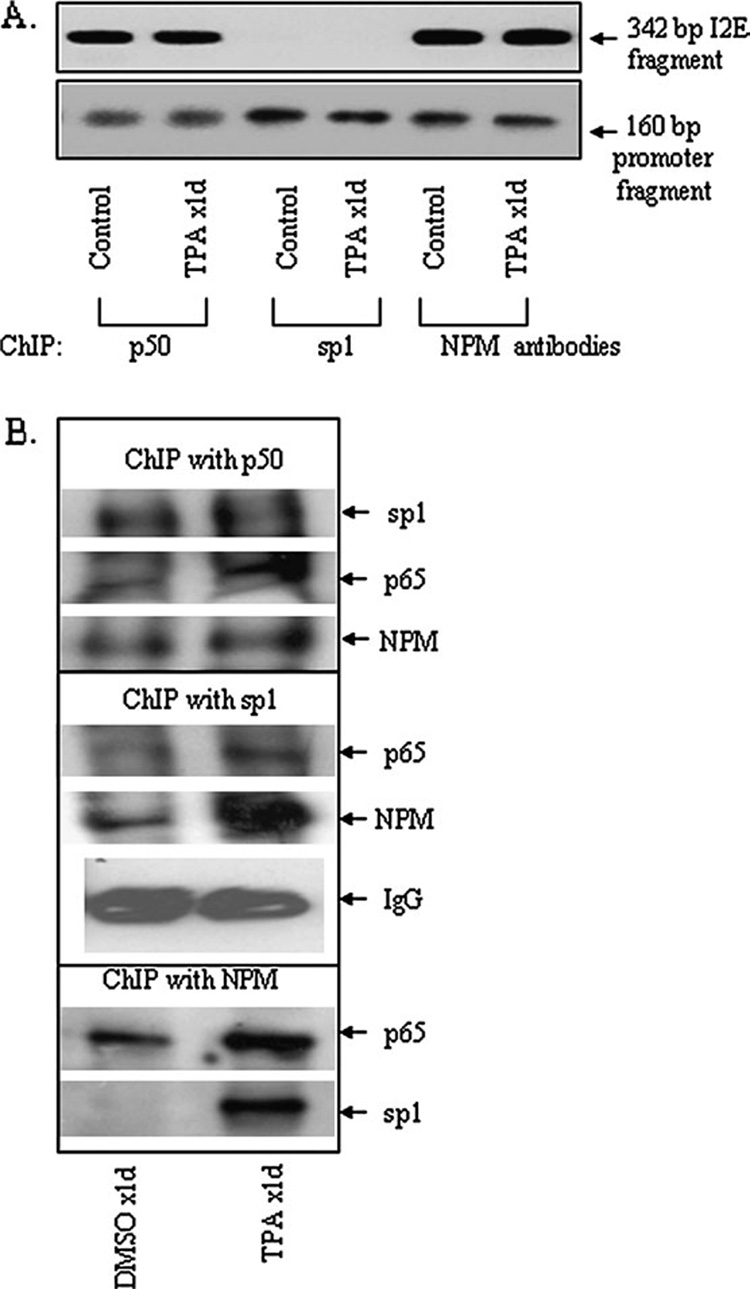
The binding of transcription factor to the promoter or enhancer region of MnSOD gene was evaluated by ChIP assay in isolated skin tissues as described in Materials and methods. (A) Chromatins were immunoprecipitated with p50, Sp1 or NPM antibodies. Immunoprecipitated DNA was amplified by PCR using primers targeted to the enhancer element (1742–2083) and the promoter element (−154 to +6) of the MnSOD gene. (B) The immunoprecipitated proteins were detected by western analysis.
Differential roles of Sp1 and NF-κB members in MnSOD transcription
To identify transcription factors that participate in the alteration of MnSOD expression after TPA treatment, we investigated the time course protein complexes with MnSOD promoter–enhancer using ChIP assay. For this purpose, we performed ChIP of mouse skin tissue after repeated applications of TPA using p50 antibody. As shown in Figure 4A, the increase in DNA binding to MnSOD promoter– enhancer of p65 precedes that of p50. The levels of p65 and Sp1 increase at day 1, reach a maximum at day 4 and decline by day 7 after TPA applications. The findings that complexes between p50 and p65 and p50 and Sp1 diminish after seven repeated treatments with TPA, but the levels of p50 are highest at day 7 (Figure 2C), suggest the presence of excess p50 that may bind DNA as p50–p50 homodimer. To test this possibility, we examined the NF-κB DNA-binding activity using electrophoretic mobility shift assay. As expected, nuclear extracts from TPA-treated mouse skin show enhanced NF-κB-binding activity. Interestingly, NF-κB DNA-binding activity is highest in the 7-day repeated treatment group (Figure 4B). Consistent with higher levels of p50–p50, the DNA-binding complex is largely super-shifted by p50 antibody. These results suggest that the loss of MnSOD induction after repeated treatments with TPA may be due, in part, to the presence of excess p50.
Fig. 4. Transcription factor binding with DNA.
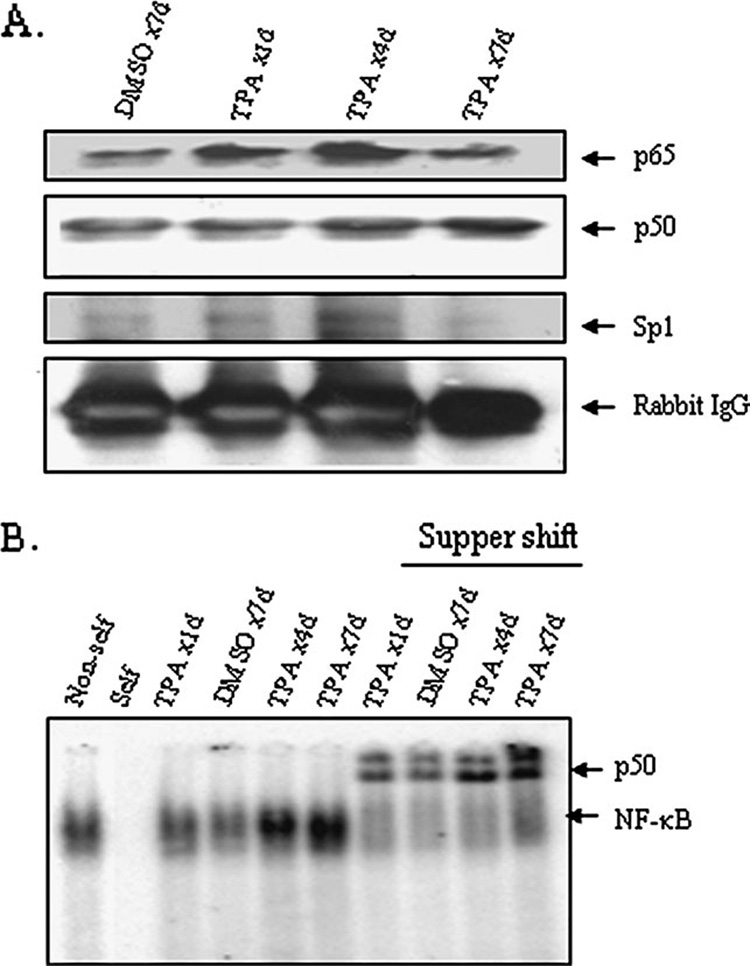
(A) Isolated skin cells were cross-linked with formaldehyde. The binding of proteins with chromatins was evaluated by ChIP assay. The product of the ChIP experiment using the p50 antibody was subjected to SDS–polyacrylamide gel electrophoresis for protein analysis. Proteins were detected by western blotting using antibodies specific to p65, p50, Sp1 or normal IgG. (B) Electrophoretic mobility shift assay was performed using purified nuclear extract from skin tissue as described in Materials and methods. For super-shift experiment, electrophoretic mobility shift assay reaction mixture was incubated with 1 µg of antibody specific to p50. The arrows point to the protein–DNA complex and super-shift protein–antibody complex. To verify the specificity for NF-κB binding, a 100-fold excess of non-radiolabeled NF-κB (cold) oligonucleotide was used to compete with the radiolabeled NF-κB probe in nuclear extracts (designated as self). The specificity of NF-κB bindings was also demonstrated by an addition of 100-fold mutant NF-κB (cold) DNA to nuclear extracts (non-self) along with the radiolabeled NF-κB probes.
p50 affects Sp1-mediated transcription
To determine how an enhanced level of p50 modulates MnSOD transcription, we used JB6 cells. Sp1 and p50 expression vectors along with MnSOD promoter- and enhancer-driven luciferase vectors were co-transfected. MnSOD promoter–enhancer-driven luciferase expression increases manyfold in cells transfected with the Sp1 expression vector compared with empty vector-transfected control cells. The basal level of MnSOD gene transcription is repressed in p50 over-expressed cells compared with empty vector-transfected cells. Furthermore, the positive effects of Sp1 on MnSOD transcription are drastically diminished when p50 is co-expressed with Sp1 expression vector (Figure 5A). Increased levels of p50 and Sp1 in the transfected cells were confirmed by western analysis of the cell extract used in the reporter gene activity assay (Figure 5B).
Fig. 5. Suppression of MnSOD gene transcription by p50.
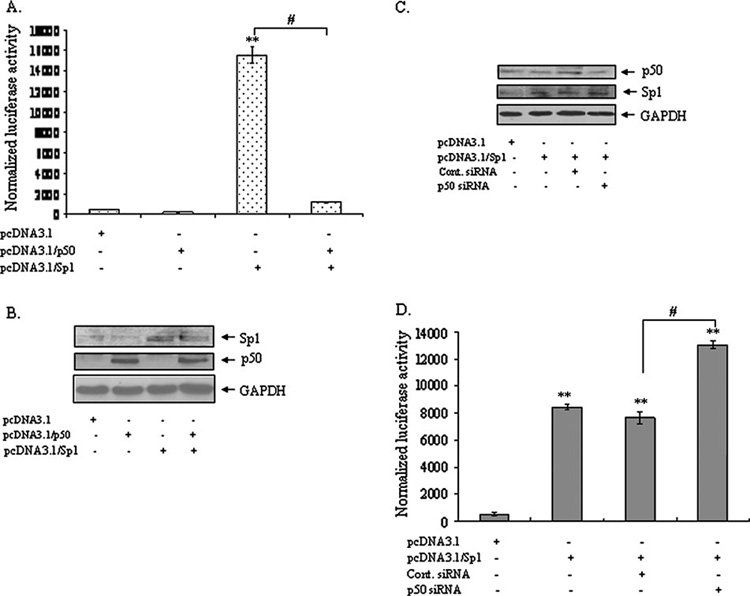
JB6 cells were co-transfected with p50 expression vector (pcDNA3.1/p50) along with MnSOD reporter vector (pGL3/I2E) or p50 (pcDNA3.1/p50) and Sp1 expression vector (pcDNA3.1/Sp1) with MnSOD reporter vector. Separately, p50 siRNA or control siRNAwas co-transfected with Sp1 expression vector in JB6 cells. (A) After transfection, cells were collected and luciferase activity was measured as a determinant of MnSOD gene transcription. (B) The over-expressed proteins were evaluated by western blotting using the same cellular extract. (C) The siRNA effect on p50 protein levels was detected by western blotting. (D) p50 siRNA increases MnSOD gene transcription mediated by Sp1 are shown. All data sets consist of three representative experiments. Statistically significant from control; *P < 0.05 and **P < 0.01; #P < 0.01.
To further verify the effect of p50 on Sp1-mediated MnSOD transcription, we used p50 siRNA and Sp1 expression vectors. Expression of Sp1 and suppression of p50 were verified by western analysis (Figure 5C). Over-expression of Sp1 leads to increased MnSOD gene transcription which further increases with the suppression of p50 by p50 siRNA (Figure 5D).
To confirm further, we over-expressed p50 and Sp1 independently and in combination and measured endogenous MnSOD mRNA levels by RT–PCR. Over-expression of p50 and Sp1 in JB6 cells was verified by western blotting (Figure 6A). As shown in Figure 6B, the basal level of MnSOD mRNA decreases after p50 over-expression, whereas MnSOD mRNA is increased after Sp1 over-expression. Co-expression of p50 and Sp1 leading to the loss of Sp1 mediates increases in MnSOD mRNA level. While TPA alone induces MnSOD mRNA, under Sp1 over-expression conditions, TPA do not further induce MnSOD mRNA level. Over-expression of p50 reduces Sp1-mediated MnSOD mRNA expression under both untreated and TPA-treated conditions.
Fig. 6. Suppression of MnSOD mRNA by p50.
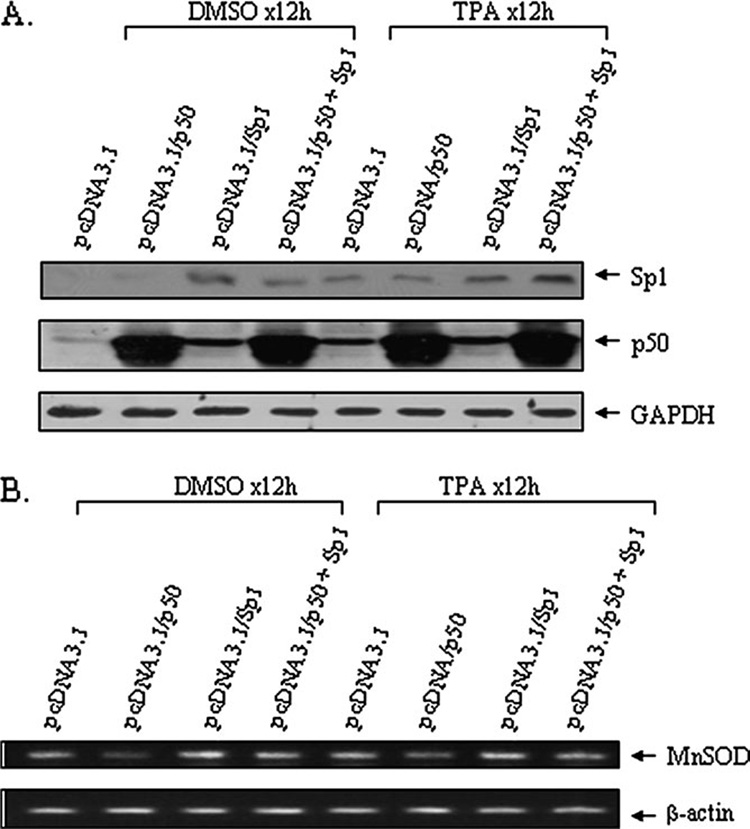
JB6 cells were co-transfected with either p50 expression vector (pcDNA3.1/p50) or empty vector (pcDNA3.1) individually or in combination with Sp1 expression vector (pcDNA3.1/Sp1) along with MnSOD reporter gene. Twenty-four hours after co-transfection, cells were treated with TPA (100 nM) for 12 h. Cells were then collected and RNA was isolated and purified. (A) Over-expressed p50 and Sp1 are shown by western blotting of cell homogenates. (B) RT–PCR of RNA isolated from control and TPA-treated cells was carried out using primers specific to mouse MnSOD gene and β-actin gene used as loading control. A representative of duplicate experiments with identical results is shown.
Discussion
Accumulating evidence suggests that MnSOD may function as a new type of tumor suppressor. Examples are over-expression of MnSOD reduces tumor incidence and metastatic ability in a large number of experimental tumors in vivo (21–24,26); MnSOD over-expression causes phenotypic reversion in SV-40-transformed human lung fibroblasts (45) and spontaneously transformed cells in culture have reduced MnSOD activity (46). Consistent with these findings, it has been documented that many types of cancer cells possess reduced levels of MnSOD activity when compared with normal counterparts (reviewed in ref. 6). However, it is not known when and how the expression of MnSOD is reduced during the carcinogenesis process. In the present investigation, we generated transgenic mice expressing MnSOD promoter–enhancer-driven reporter genes to address these important questions. We demonstrate that MnSOD gene transcription changes as a function of time after repeated administration of TPA and that MnSOD expression is increased by up to four initial applications. Sustained repeated applications do not increase MnSOD expression further, but instead the observed increased level of MnSOD expression after the initial application is lost (Figure 1 and Figure 2). The multistage skin carcinogenesis model used in previous study showed no development of tumor before 14 weeks of repeated TPA applications. Using this protocol in the B6C3 background, we never observed any tumors during the first week of TPA applications (10,26,47). Thus, the loss of MnSOD induction after only 1 week of TPA applications indicates that loss of MnSOD induction occurs very early during the skin carcinogenesis process.
Numerous studies including ours document that TPA can induce MnSOD gene transcription mediated by activation of the Sp1 and NF-κB family members (32,37,48,49). Consistent with earlier findings in vitro that NF-κB and Sp1 are essential for MnSOD induction; our results demonstrate that TPA-induced MnSOD does occur in vivo. We also demonstrate that TPA may suppress the positive effects of positive regulators after repeated applications by causing an imbalance in the transcriptionally active and transcriptionally inactive members of the NF-κB family. Although members of the NF-κB family, including p50, p52, p65 (rel A) and rel B, are known to play a positive role in MnSOD transcription (34,50), relative abundance and differential formation of homo- and heterodimers may determine their effect on transcription of the MnSOD gene. At the time (seven repeated applications) when MnSOD is no longer induced by TPA, the relative ratios of p50 before and after TPA application are significantly higher than the ratios of p65 under identical conditions. This result suggests that excess p50 plays a negative role in MnSOD transcription. The data that indicate that p50–p65 interaction is most prominent at 4 days after repeated TPA applications support the positive role of p65–p50 interaction on MnSOD induction. The findings that subsequent repeated treatment decreases p65 and increases p50 protein levels and their physical interaction (Figure 2 and Figure 4) are consistent with the negative role of p50–p50 complex. It has been reported that DNA binding of p50–p50 is an important mechanism for suppression of NF-κB target genes. For example, p50–p50 homodimer inhibits interleukin-2 gene expression in resting T-lymphocytes (51) and human 11β-hydroxysteroid dehydrogenase gene expression in SW620 cells (52). Our study in JB6 cells (Figure 5A) showing that the over-expression of p50 and suppression of p50 lead to the decrease and increase of MnSOD gene transcription, respectively, clearly indicates that excessive levels of p50 have a negative effect in MnSOD transcription. Thus, it is tempting to speculate that excessive levels of p50 may result in the formation of p50–p50 homodimer complex leading to the suppression of MnSOD transcription in vivo.
In addition to the possibility that excess p50 forms p50–p50 homodimer, excessive p50 can also interfere with Sp1 function. Sp1 is a transcription factor that positively regulates MnSOD gene transcription. A stimulus such as TPA is capable of inducing Sp1 protein leading to the induction of MnSOD promoter activity (49). Our results show that Sp1 expression is increased on day 1 after TPA application and continues to increase to its highest level after four repeated applications. The increase in Sp1 levels is consistent with an elevated binding to DNA as detected by ChIP assays (Figure 4).
Our data also demonstrate that the increase in Sp1 level does not occur after further TPA application. Thus, it could be argued that the lack of an increase in Sp1 alone is the cause for the observed decline in MnSOD induction after 7 days of repeated TPA treatments. However, this is unlikely because over-expression of p50 can suppress MnSOD induction even with the presence of high Sp1 levels (Figure 6B). Over-expression of p50 is inhibitory to MnSOD transcription both at constitutive and Sp1-mediated induced levels (Figure 5A). Co-immunoprecipitation experiments demonstrate that Sp1 physically interacts with p50 (Figure 3 and Figure 4). Furthermore, p50 can also modulate Sp1-mediated MnSOD transcription. Our finding that p50 siRNA promotes Sp1-mediated MnSOD expression suggests that p50 interferes with MnSOD gene transcription. These in vitro data are closely linked with our in vivo findings by ChIP assays showing NF-κB p50 physically interacts with p65, Sp1 and NPM. Thus, it is possible that excessive p50 accumulation decreases MnSOD gene transcription not only by forming a p50–p50 homodimer complex but also by interfering with the function of Sp1.
In conclusion, the present study demonstrates that loss of MnSOD induction occurs very early in the development of skin cancer. This is the first study to demonstrate that sustained exposure of tumor promoter TPA to skin tissues results in a loss of MnSOD induction in response to TPA and that the loss of MnSOD induction is due, in part, to sustained elevation of p50.
Acknowledgments
We thank Dr Jonathan M.Horowitz, North Carolina State University, for Sp1 and Dr Vivek M.Rangnekar, University of Kentucky, for p50 expression vector.
Funding
National Institutes of Health (CA 49797 and CA 73599) to D.K.St.C.
Abbreviations
- ChIP
chromatin immunoprecipitation
- MnSOD
manganese superoxide dismutase
- NF-κB
nuclear factor-kappa B
- NPM
nucleophosmin
- PCR
polymerase chain reaction
- RT
reverse transcription
- SDS
sodium dodecyl sulfate
- siRNA
small interfering RNA
- Sp1
specificity protein 1
- TPA
12-O-tetradecanoylphorbol-13-acetate
Footnotes
Conflict of Interest Statement: None declared.
References
- 1.Dougall WC, et al. Manganese superoxide dismutase: a hepatic acute phase protein regulated by interleukin-6 and glucocorticoids. Endocrinology. 1991;129:2376–2384. doi: 10.1210/endo-129-5-2376. [DOI] [PubMed] [Google Scholar]
- 2.Suzuki K, et al. Manganese superoxide dismutase in endothelial cells: localization and mechanism of induction. Am. J. Physiol. 1993;265:H1173–H1178. doi: 10.1152/ajpheart.1993.265.4.H1173. [DOI] [PubMed] [Google Scholar]
- 3.Wan XS, et al. Molecular structure and organization of the human manganese superoxide dismutase gene. DNA Cell Biol. 1994;13:1127–1136. doi: 10.1089/dna.1994.13.1127. [DOI] [PubMed] [Google Scholar]
- 4.Meyrick B, et al. Identification and functional characterization of the bovine manganous superoxide dismutase promoter. Am. J. Respir. Cell Mol. Biol. 1994;10:113–121. doi: 10.1165/ajrcmb.10.1.8292376. [DOI] [PubMed] [Google Scholar]
- 5.Carlioz A, et al. Isolation of superoxide dismutase mutants in Escherichia coli: is superoxide dismutase necessary for aerobic life? EMBO J. 1986;5:623–630. doi: 10.1002/j.1460-2075.1986.tb04256.x. [DOI] [PMC free article] [PubMed] [Google Scholar]
- 6.Oberley LW, et al. Role of superoxide dismutase in cancer: a review. Cancer Res. 1979;39:1141–1149. [PubMed] [Google Scholar]
- 7.Fridovich I. The biology of oxygen radicals. Science. 1978;201:875–880. doi: 10.1126/science.210504. [DOI] [PubMed] [Google Scholar]
- 8.Del MR, et al. Subcellular localization of superoxide dismutases, glutathione peroxidase and catalase in developing rat cerebral cortex. Mech. Aging Dev. 1989;48:15–31. doi: 10.1016/0047-6374(89)90022-5. [DOI] [PubMed] [Google Scholar]
- 9.Fuji J, et al. Phorbol ester induces manganese-superoxide dismutase in tumor necrosis factor-resistant cells. J. Biol. Chem. 1991;266:23142–23146. [PubMed] [Google Scholar]
- 10.Zhao Y, et al. A mechanism-based antioxidant approach for the reduction of skin carcinogenesis. Cancer Res. 2005;65:1401–1405. doi: 10.1158/0008-5472.CAN-04-3334. [DOI] [PubMed] [Google Scholar]
- 11.Eastgate J, et al. A role for manganese superoxide dismutase in radioprotection of hematopoietic stem cells by interleukin-1. Blood. 1993;81:639–646. [PubMed] [Google Scholar]
- 12.Akashi M, et al. Irradiation increases manganese superoxide dismutase mRNA levels in human fibroblasts. Possible mechanisms for its accumulation. J. Biol. Chem. 1995;270:15864–15869. doi: 10.1074/jbc.270.26.15864. [DOI] [PubMed] [Google Scholar]
- 13.Lee JH, et al. Protective role of superoxide dismutases against ionizing radiation in yeast. Biochim. Biophys. Acta. 2001;1526:191–198. doi: 10.1016/s0304-4165(01)00126-x. [DOI] [PubMed] [Google Scholar]
- 14.Mungarano R, et al. Redox perturbations in cysteamine-stressed astroglia: implications for inclusion formation and gliosis in the aging brain. Free Radic. Biol. Med. 1995;19:823–835. doi: 10.1016/0891-5849(95)02008-x. [DOI] [PubMed] [Google Scholar]
- 15.Baker K, et al. Synthetic combined superoxide dismutase/catalase mimetics are protective as a delayed treatment in a rat stroke model: a key role for reactive oxygen species in ischemic brain injury. J. Pharmacol. Exp. Ther. 1998;284:215–221. [PubMed] [Google Scholar]
- 16.Li Y, et al. Dilated cardiomyopathy and neonatal lethality in mutant mice lacking manganese superoxide dismutase. Nat. Genet. 1995;11:376–381. doi: 10.1038/ng1295-376. [DOI] [PubMed] [Google Scholar]
- 17.Melov S, et al. A novel neurological phenotype in mice lacking mitochondrial manganese superoxide dismutase. Nat. Genet. 1998;18:159–163. doi: 10.1038/ng0298-159. [DOI] [PubMed] [Google Scholar]
- 18.Wispe JR, et al. Human Mn-superoxide dismutase in pulmonary epithelial cells of transgenic mice confers protection from oxygen injury. J. Biol. Chem. 1992;267:23937–23941. [PubMed] [Google Scholar]
- 19.Yen HC, et al. The protective role of manganese superoxide dismutase against adriamycin-induced acute cardiac toxicity in transgenic mice. J. Clin. Invest. 1997;98:1253–1260. doi: 10.1172/JCI118909. [DOI] [PMC free article] [PubMed] [Google Scholar]
- 20.Keller JW, et al. Mitochondrial manganese superoxide dismutase prevents neural apoptosis and reduces ischemic brain injury: suppression of peroxynitrite production, lipid peroxidation, and mitochondrial dysfunction. J. Neurosci. 1998;18:687–697. doi: 10.1523/JNEUROSCI.18-02-00687.1998. [DOI] [PMC free article] [PubMed] [Google Scholar]
- 21.Church SL, et al. Increased manganese superoxide dismutase expression suppresses the malignant phenotype of human melanoma cells. Proc. Natl Acad. Sci. USA. 1993;90:3113–3117. doi: 10.1073/pnas.90.7.3113. [DOI] [PMC free article] [PubMed] [Google Scholar]
- 22.Safford SE, et al. Suppression of fibrosarcoma metastasis by elevated expression of manganese superoxide dismutase. Cancer Res. 1994;54:4261–4265. [PubMed] [Google Scholar]
- 23.Urano M, et al. Expression of manganese superoxide dismutase reduces tumor control radiation dose: gene-radiotherapy. Cancer Res. 1995;55:2490–2493. [PubMed] [Google Scholar]
- 24.Zhong W, et al. Suppression of the malignant phenotype of human glioma cells by overexpression of manganese superoxide dismutase. Oncogene. 1997;14:481–490. doi: 10.1038/sj.onc.1200852. [DOI] [PubMed] [Google Scholar]
- 25.Kiningham KK, et al. Overexpression of manganese superoxide dismutase selectively modulates the activity of Jun-associated transcription factors in fibrosarcoma cells. Cancer Res. 1997;57:5265–5271. [PubMed] [Google Scholar]
- 26.Zhao Y, et al. Overexpression of manganese superoxide dismutase suppresses tumor formation by modulation of activator protein-1 signaling in a multistage skin carcinogenesis model. Cancer Res. 2001;61:6082–6088. [PubMed] [Google Scholar]
- 27.Nishizuka Y. The role of protein kinase C in cell surface signal transduction and tumor promotion. Nature (Lond.) 1984;308:693–698. doi: 10.1038/308693a0. [DOI] [PubMed] [Google Scholar]
- 28.Mukhtar H, et al. Skin Cancer: Mechanisms and Human Relevance. Boca Raton, FL: CRC Press; 1995. [Google Scholar]
- 29.Troll W. Prevention of cancer by agents that suppress oxygen radical formation. Free Radic. Res. Commun. 1991;12–13(Pt 2):751–757. doi: 10.3109/10715769109145855. [DOI] [PubMed] [Google Scholar]
- 30.Slaga TJ. Inhibition of the induction of cancer by antioxidants. Adv. Exp. Med. Biol. 1995;369:1671–1674. doi: 10.1007/978-1-4615-1957-7_15. [DOI] [PubMed] [Google Scholar]
- 31.Xu Y, et al. Transcriptional regulation of the human manganese superoxide dismutase gene: the role of specificity protein 1 (Sp1) and activating protein-2 (AP-2) Biochem. J. 2002;362:401–412. doi: 10.1042/0264-6021:3620401. [DOI] [PMC free article] [PubMed] [Google Scholar]
- 32.Dhar SK, et al. Identification of nucleophosmin as an NF-kappaB co-activator for the induction of the human SOD2 gene. J. Biol. Chem. 2004;279:28209–28219. doi: 10.1074/jbc.M403553200. [DOI] [PMC free article] [PubMed] [Google Scholar]
- 33.Zhu C-H, et al. A family of AP-2 proteins down-regulate manganese superoxide dismutase expression. J. Biol. Chem. 2001;276:14407–14413. doi: 10.1074/jbc.M009708200. [DOI] [PubMed] [Google Scholar]
- 34.Hirano F, et al. Functional interference of Sp1 and NF-kappaB through the same DNA binding site. Mol. Cell. Biol. 1998;18:1266–1274. doi: 10.1128/mcb.18.3.1266. [DOI] [PMC free article] [PubMed] [Google Scholar]
- 35.Pascal E, et al. Different activation domains of Sp1 govern formation of multimers and mediate transcriptional synergism. Genes Dev. 1991;5:1646–1656. doi: 10.1101/gad.5.9.1646. [DOI] [PubMed] [Google Scholar]
- 36.Xu Y, et al. An intronic NF-kappaB element is essential for induction of the human manganese superoxide dismutase gene by tumor necrosis factor-alpha and interleukin-1beta. DNA Cell Biol. 1999;18:709–722. doi: 10.1089/104454999314999. [DOI] [PubMed] [Google Scholar]
- 37.Zabel U, et al. DNA binding of purified transcription factor NF-kappa B. Affinity, specificity, Zn2+ dependence, and differential half-site recognition. J. Biol. Chem. 1991;266:252–260. [PubMed] [Google Scholar]
- 38.Grilli M, et al. NF-kappa B and Rel: participants in a multiform transcriptional regulatory system. Int. Rev. Cytol. 1993;143:1–62. doi: 10.1016/s0074-7696(08)61873-2. [DOI] [PubMed] [Google Scholar]
- 39.Zhong H, et al. The phosphorylation status of nuclear NF-kappa B determines its association with CBP/p300 or HDAC-1. Mol. Cell. 2002;9:625–636. doi: 10.1016/s1097-2765(02)00477-x. [DOI] [PubMed] [Google Scholar]
- 40.Dhar SK, et al. Specificity protein 1-dependent p53-mediated suppression of human manganese superoxide dismutase gene expression. J. Biol. Chem. 2006;281:21698–21709. doi: 10.1074/jbc.M601083200. [DOI] [PMC free article] [PubMed] [Google Scholar]
- 41.Hogan B, et al. A Laboratory Manual. 2nd edn. Cold Spring Harbor, NY: Cold Spring Harbor Laboratory Press; 1994. [Google Scholar]
- 42.Lairad PW, et al. Simplified mammalian DNA isolation procedure. Nucleic acids Res. 1991;19:4293. doi: 10.1093/nar/19.15.4293. [DOI] [PMC free article] [PubMed] [Google Scholar]
- 43.St. Clair DK, et al. Complementary DNA encoding human colon cancer manganese superoxide dismutase and the expression of its gene in human cells. Cancer Res. 1991;51:939–943. [PubMed] [Google Scholar]
- 44.Spitz DR, et al. An assay for superoxide dismutase activity in mammalian tissue homogenates. Anal. Biochem. 1989;179:8–18. doi: 10.1016/0003-2697(89)90192-9. [DOI] [PubMed] [Google Scholar]
- 45.Yan T, et al. Manganese-containing superoxide dismutase overexpression causes phenotypic reversion in SV40-transformed human lung fibroblasts. Cancer Res. 1996;56:2864–2871. [PubMed] [Google Scholar]
- 46.Sun Y, et al. Lowered antioxidant enzymes in spontaneously transformed embryonic mouse liver cells in culture. Carcinogenesis. 1993;14:1457–1463. doi: 10.1093/carcin/14.7.1457. [DOI] [PubMed] [Google Scholar]
- 47.Zhao Y, et al. Detection of the content and activity of the transcription factor AP-1 in a multistage skin carcinogenesis model. Methods Mol. Biol. 2003;218:177–184. doi: 10.1385/1-59259-356-9:177. [DOI] [PubMed] [Google Scholar]
- 48.Jones PL, et al. Tumor necrosis factor alpha and interleukin-1beta regulate the murine manganese superoxide dismutase gene through a complex intronic enhancer involving C/EBP-beta and NF-kappaB. Mol. Cell. Biol. 1997;17:6970–6981. doi: 10.1128/mcb.17.12.6970. [DOI] [PMC free article] [PubMed] [Google Scholar]
- 49.Porntadavity S, et al. TPA-activated transcription of the human MnSOD gene: role of transcription factors Sp-1 and Egr-1. DNA Cell Biol. 2001;20:473–781. doi: 10.1089/104454901316976109. [DOI] [PubMed] [Google Scholar]
- 50.Josson S, et al. RelB regulates manganese superoxide dismutase gene and resistance to ionizing radiation of prostate cancer cells. Oncogene. 2006;25:1554–1559. doi: 10.1038/sj.onc.1209186. [DOI] [PMC free article] [PubMed] [Google Scholar]
- 51.Grundstrom S, et al. Bcl-3 and NFkappaB p50-p50 homodimers act as transcriptional repressors in tolerant CD4+ T cells. J. Biol. Chem. 2004;279:8460–8468. doi: 10.1074/jbc.M312398200. [DOI] [PubMed] [Google Scholar]
- 52.Kostadinova RM, et al. Tumor necrosis factor alpha and phorbol 12-myristate-13-acetate down-regulate human 11beta-hydroxysteroid dehydrogenase type 2 through p50/p50 NF-kappaB homodimers and Egr-1. FASEB J. 2005;19:650–662. doi: 10.1096/fj.04-2820fje. [DOI] [PubMed] [Google Scholar]