

Abstract
It is a major challenge to develop effective sequence database search algorithms to translate molecular weight and fragment mass information obtained from tandem mass spectrometry into high quality peptide and protein assignments. We investigated the peptide identification performance of Mascot and X!Tandem for mass tolerance settings common for low and high accuracy mass spectrometry. We demonstrated that sensitivity and specificity of peptide identification can vary substantially for different mass tolerance settings, but this effect was more significant for Mascot. We present an adjusted Mascot threshold, which allows the user to freely select the best trade-off between sensitivity and specificity. The adjusted Mascot threshold was compared with the default Mascot and X!Tandem scoring thresholds and shown to be more sensitive at the same false discovery rates for both low and high accuracy mass spectrometry data.
The use of MS in proteomics continues to increase. It has become the method of choice for protein identification and quantification offering high throughput analysis at a high sensitivity, specificity, and a good dynamic range (2-5).
In bottom-up LC-MS/MS proteomics (6, 7) proteins are typically digested with a specific enzyme, generating peptides that, after separation, are subjected to mass spectrometry analysis. Peptides are ionized and mass to charge ratios are determined. For peptide sequencing, tandem MS (MS/MS) is used where selected peptide ions are isolated and fragmented, and mass to charge ratios of the products are measured. The recent availability of hybrid-FT mass spectrometers (8, 9) enables high mass resolution (30,000–500,000) together with very high mass accuracy (in the range of a few ppm). On these instruments, throughput and sensitivity are maximized by collecting MS data at a high resolution and accuracy, and MS/MS data are recorded at high speed with low resolution and accuracy (10).
Sequence database search algorithms (11-14) are used to assign sequence information to MS/MS spectra. All peptide candidate sequences that match the experimental peptide mass within the allowed maximum mass deviation (MMD)1 are selected from an in silico digested protein sequence database. Each candidate is further investigated at the MS/MS level by correlating the experimental and the theoretical peptide fragmentation patterns (peptide-spectrum match) and scoring the correlation quality. Scoring schemes of database search algorithms are required to provide a sound means of assessing the significance of peptide assignments to minimize incorrect identification and maximize correct identification. Many different techniques have been applied in the past from manual heuristic rules to machine learning algorithms that discriminate between correct and incorrect identifications (15-17). The most popular database search engines to date, including Mascot(14) and X!Tandem (11), provide theoretically or empirically derived statistical thresholds to help assess the significance of peptide identifications.
Mascot reports a probability-based Mascot identity threshold (MIT) for each individual spectrum query. A Mascot score above MIT is considered to be a significant peptide assignment. The MIT is defined as −10·log10(20·p/n) where p is the probability of a random peptide match and n corresponds to the actual number of peptide candidates. For example, if a 1 in 20 chance of obtaining a false positive is acceptable (p = 0.05) and there are 10,000, 1000, 100, and 10 peptide candidates for a given mass window in the sequence database, the MIT would be 40, 30, 20, and 10, respectively. For a peptide match with a score that equals the MIT (p = 0.05), the expectation value (E-value) of this hit is also 0.05, but if the score exceeds the MIT by e.g. 10, the E-value drops to 0.005. The E-value in Mascot is defined as p·10(MIT − score)/10 and corresponds to the number of times one would expect this score by chance alone (Matrix Science, London, UK). Therefore the MIT only reflects changes in search space, defined by the number of peptide candidates, and would be affected by various factors such as MMD settings, the number of allowed missed cleavages, enzyme specificity, and variable modifications.
Mascot also reports an empirical Mascot homology threshold (MHT) at which a Mascot score can be considered a significant outlier from the distribution of all candidate peptide-spectrum match scores, but an exact definition of the MHT was not published. Similarly X!Tandem uses score distributions but extrapolates empirical E-values to assess the significance of a peptide match (11, 18), which is limited by a user-defined significance level. With high accuracy MMD settings the search space can decrease significantly leading to insufficient data points of the score distributions to reliably extrapolate E-values. To compensate for this, X!Tandem uses cyclic permutations of all peptide candidates that are scored and used to pad the score distribution (optional). In general, empirical scoring schemes that utilize the peptide candidate score distributions for thresholding or E-value extrapolation are more robust to changing MS/MS data quality such as signal to noise, mass accuracy, or fragmentation quality. In supplemental Information 1 we illustrate the similarities and differences between the X!Tandem, MHT, and MIT scoring schemes.
It is anticipated that reducing the search space should improve the performance of algorithms for peptide identification (19). For example, with high mass accuracy data in the range of a few ppm, the search space can be reduced by orders of magnitude in comparison with low accuracy data acquired typically on ion trap instruments (20).
Established database search algorithms, and in particular their scoring schemes, were not specifically developed for high mass accuracy data. Rudnick et al. (1) evaluated the effects of MMD settings on Mascot performance and proposed an empirical mass accuracy-based threshold (MATH) that provided improved sensitivity at a user-defined false discovery rate (FDR). They applied a range of global cutoff thresholds and determined the associated FDRs. A linear regression over the logarithms of these FDRs and the cutoff values enabled an empirical threshold extrapolation at a predefined FDR. However, the Mascot evaluation was exclusively limited to the MIT. Savitski et al. (21) have developed a database size-independent scoring scheme for high accuracy data. This work is based on complementary fragmentation techniques and cannot be applied solely on standard collision-induced dissociation data (22, 23). Gygi and co-workers (24, 25) proposed to exploit high accuracy MS data by searching at relaxed mass tolerance settings followed by mass accuracy filtering. Combined with a moderate threshold on peptide-spectrum correlation scores, they found this strategy to serve as a good discriminator between correct and incorrect peptide assignments (supplemental Information 2). Overall these studies indicate that a more detailed evaluation and optimization of established search algorithms for high accuracy mass spectrometry are still required.
Target/decoy database searching enables comparative evaluation of database search algorithms based on estimating FDRs for high throughput MS data. The target database represents the normal sequence database, and the decoy database is a randomized or reversed version (20, 26, 27). Any spectrum matching a decoy peptide and passing the defined score threshold criteria are considered as false positives (FPs), thereby enabling the estimation of the FDR. Two alternative approaches for target/decoy searches are commonly used. Either separate searches against the target and decoy databases are performed using the same search parameters, or alternatively one search against a compound target/decoy database is used. Recently Elias and Gygi (20) presented a comprehensive overview and evaluation of various target/decoy strategies.
In this study we investigated the performance of Mascot and X!Tandem for varying MMD settings common for low and high accuracy MS. We show that the MIT was highly dependent on the search space and affected false discovery and identification rates. We also show that the empirical scoring scheme in X!Tandem was more robust across different mass tolerance settings. The Mascot equivalent empirical MHT outperformed X!Tandem for ion trap data but was not comprehensively applicable for very stringent MMD settings. We demonstrate that searching high accuracy data at relaxed MMD windows followed by peptide mass accuracy filtering serves as a good discriminator between correct and incorrect assignments. We propose an alternative empirical adjusted Mascot threshold (AMT), applicable to low accuracy data and, in combination with peptide mass accuracy filtering, also to high accuracy data. In addition, the AMT enables the user to freely select the best trade-off between sensitivity and specificity by defining the actual FDR.
EXPERIMENTAL PROCEDURES
Sample Preparation
Sample 1
A nuclear protein extract of murine embryonic stem cells (2 mg/ml) was reduced with 2 mm dithiothreitol (Sigma) at 70 °C for 10 min followed by alkylation with 20 mm iodoacetamide (Sigma) at room temperature for 30 min. 10 μg of total protein was separated on a NuPAGE Novex 4–12% Bis-Tris polyacrylamide gel (Invitrogen). The gel was stained with colloidal Coomassie Blue (Sigma). The entire gel lane was excised into 48 bands, destained with 50% acetonitrile, and subsequently digested with sequencing grade trypsin (Roche Applied Science) overnight. Peptides were extracted with 5% formic acid, 50% acetonitrile twice and vacuum-dried in a SpeedVac (Thermo Fisher Scientific). Peptides were redissolved in 0.5% formic acid and subjected to LC-MS/MS.
Sample 2
A standard protein set of 48 human proteins (Sigma, Universal Proteomics Standard Set UPS1) was reduced with Tris(2-carboxyethyl)phosphine hydrochloride (TCEP), alkylated with iodoacetamide as above, followed by digestion in solution with sequencing grade trypsin (Roche Applied Science) overnight. 10 fmol were subjected directly to the LC-MS/MS.
LC-MS/MS Analysis
Peptides were analyzed with on-line nano-LC-MS/MS on an LTQ FT (Thermo Fisher Scientific), a hybrid linear ion trap and a 7-tesla Fourier transform ion cyclotron resonance mass spectrometer, coupled with an Ultimate 3000Nano/Capillary LC System (Dionex).
Samples were first loaded and desalted on a trap (0.3-mm inner diameter × 5 mm) at 20 μl/min with 0.1% formic acid for 5 min and then separated on an analytical column (75-μm inner diameter × 15 cm) (both PepMap C18, LC Packings) over a 30-min linear gradient of 4–40% CH3CN, 0.1% formic acid for sample 1. For sample 2, the separation gradient was a 120-min gradient, 4–32% CH3CN/0.1% formic acid. The flow rate through the column was 300 nl/min. The LTQ FT mass spectrometer was operated in standard data-dependent mode controlled by Xcalibur 1.4 software. The survey scans (m/z range 400–2000) were acquired on the FT-ICR instrument at a resolution of 100,000 at m/z 400, and one microscan was acquired per spectrum. The top three (top five for sample 2) most abundant multiply charged ions with a minimal intensity at 1000 counts were subjected to MS/MS in the linear ion trap at an isolation width of 3 Thomson (1 Thomson for sample 2).
Precursor activation was performed with an activation time of 30 ms, and the activation Q was set at 0.25. The normalized collision energy was set at 35%. The dynamic exclusion width was set at ±5 ppm with two repeats and a duration of 30 s. To achieve high mass accuracy, the automatic gain control target value was regulated at 4e5 (sample 1) or le6 (sample 2) for FT and 1e4 for the ion trap with a maximum injection time of 1000 ms for FT and 100 ms (sample 1) or 250 ms (sample 2) for the ion trap. The instrument was externally calibrated using the standard calibration mixture of caffeine (peptide sequence MRFA), and Ultramark 1600.
Raw Data Processing
LTQ FT MS raw data files were processed to peak lists with BioWorks 3.2 (Thermo Fisher Scientific). Parameters were as follows: precursor masses were set to 800–4500 Da, grouping was enabled allowing 50 intermediate scans, and a precursor mass tolerance setting of 10 ppm in BioWorks was applied. The number of minimum scans per group was set to 1. For sample 2 grouping was disabled.
Database Search Parameters
Sample 1
Mascot 2.1 (Matrix Science) and X!Tandem 2007.07.01 (The Global Proteome Machine Organization) were used for analyzing the data. Parameters used in Mascot and X!Tandem searches were: enzyme, trypsin; variable modifications, carbamidomethylation of cysteine and oxidation of methionine; maximum missed cleavages, 1; peptide mass tolerance settings/windows were as indicated in the individual experiments (between 2 Da and 5 ppm); product mass tolerance, 0.5 Da. Probability p of random matches for MIT calculations in Mascot was set to the default value of 0.05. Specific X!Tandem parameters were: spectrum dynamic range was set to 1000, refinement was disabled, maximum valid E-value for reported peptides was set to 100 (E-values were limited in the data analysis steps), and cyclic permutations to compensate for small search spaces was enabled with remaining parameters at default.
The protein sequence database used by Mascot and X!Tandem was built from a non-identical superset of Ensembl peptides, UniProt KB, and RefSeq sequences for Mus musculus, including common external contaminants from cRAP (a maintained list of contaminants, laboratory proteins, and protein standards provided through the Global Proteome Machine Organization), containing 94,524 sequences and 42,765,694 residues. For false positive discovery assessment, a separate decoy database was generated from the target database using the Perl decoy.pl script provided by Matrix Science. This script randomizes each entry but retains the average amino acid composition and length of the entries. 0.1% of sequences were common in both target and decoy databases, including Lys/Gln and Leu/Ile isoforms that are indistinguishable above 0.04 Da MMD.
Sample 2
For sample 2 search and database parameters see supplemental Information 5a.
Data Analysis
Mascot results (p < 1.0) were exported to pepXML using the Mascot export tool, and X!Tandem results (E-value <100) were stored as X!Tandem XML. An in-house Java tool was used for the data analysis. Results from Mascot and X!Tandem were imported, and filters on score thresholds and mass tolerances were applied. Only doubly and triply charged ions and the first hit rank per spectrum were considered for analysis.
For FDR estimation we chose to search the target and decoy databases separately to avoid affecting the MIT scoring by changing database size. The decoy database used was a randomized version of the target database, which was found to be the best approximation based on evaluations of sample 2 (supplemental Information 5a). All estimated FDRs in this work were calculated using the same target/decoy approach, enabling consistent comparison of results.
Estimated FDRs were calculated by counting all peptide assignments obtained from the decoy database (FP) divided by the number of peptide assignments that were obtained from the target database (TP + FP) given the same parameter and threshold settings. The estimated number of true positive (TP) hits was calculated by counting the number of all peptide hits against the target database minus all hits against the decoy database search.
FDR assessment was limited to the peptide level only because we were interested in the quality of matching individual spectra to peptide sequences. Furthermore it avoids comparison of different protein inference strategies (28) that is a separate issue. FDRs were determined using all peptide assignments and therefore represent the FDRs of the actual data set.
Correction of Systematic Mass Error
Data from sample 1 were searched in a first pass with Mascot at 100-ppm MMD to determine the mass accuracy for the experiment. Only peptide hits with a Mascot score greater than 30 were used for the mass accuracy assessment (10,634 queries) to exclude mass deviations of incorrect matches. 99% of hits had mass deviations within a 3 ± 20-ppm mass window (systematic mass error ± peptide mass error), whereas 90% of mass deviations fell within 3 ± 5 ppm. To allow the best possible mass tolerance settings of 0 ± 5 ppm in Mascot and X!Tandem, the precursor masses were corrected by 3 ppm (supplemental Information 3). A similar mass error correction method was described by Zubarev and Mann (19). The mass outliers between −5 and −20 ppm seem to be an experimental artifact for this particular sample. For this study we deliberately accepted a loss of identifications for 5-ppm MMD settings to study the effects of stringent mass settings on Mascot and X!Tandem.
RESULTS AND DISCUSSION
All results in this section are based on sample 1, which is a large complex data set and representative of typical proteomics experiments. Sample 2, a standard mixture of 48 proteins, was used to verify our findings and is presented in supplemental Information 5b. Selected Mascot results along with peak lists and raw data are described and available in supplemental Information 6.
Performance of the Mascot Identity Threshold
Mass error-corrected spectra were submitted to Mascot and searched at 2-Da, 1-Da, 100-ppm, 50-ppm, 20-ppm, and 5-ppm MMD settings, whereas all other parameters were fixed.
Spectra that were assigned across all searches (23,080 of 38,058 queries) were used to draw the MIT distribution for each MMD setting (Fig. 1a). From this analysis the median MIT values for relaxed MMD settings were 42 at 2-Da MMD and 39 at 1-Da MMD with an interquartile range of 1. Under more stringent settings (5 ppm) the MIT median decreased to 24, whereas the interquartile range increased to 2. These results suggest that the MIT adapts with changing search space and performs more like a global cutoff based on the narrow variation in thresholds.
Fig. 1.
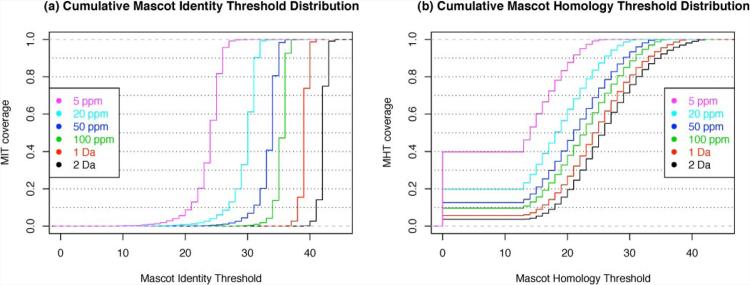
a, cumulative MIT distributions for different peptide mass tolerance settings. Only MITs from queries with a peptide assignment across all searches were used to enable comparison. With more stringent MMD settings, the MIT tends to decrease, accommodating for the smaller search space. Vice versa it increases for more relaxed MMD windows. b, cumulative MHT distributions over the range of MMD settings. The MHT is not reported for every query. All MHTs exceeding the MIT are omitted by Mascot and reported as 0 in the HTML and XML result files (J. Cottrell, personal communication). The minimum MHT reported by Mascot is 13, and the maximum MHT is limited by the corresponding MIT.
To evaluate the effects of MIT adaptions on the peptide identification performance at different MMD settings, the rates of incorrect and correct peptide-spectrum matches were determined by target/decoy FDR estimations under identical search and threshold parameters for all spectra (Fig. 2, Mascot). Using the MIT as a score cutoff, 6661 and 10,909 estimated TP peptide identifications were made at 2-Da and 5-ppm MMD settings, respectively. Relative to the 5-ppm search, this suggests 4248 (39%) false negative peptide assignments for the 2-Da search. For the same MMD settings, the FDR increased from 0.9 to 4.6%, respectively, failing to maintain the specified (5%) rate of random (incorrect) assignments.
Fig. 2. Comparative evaluation of Mascot and X!Tandem performance.
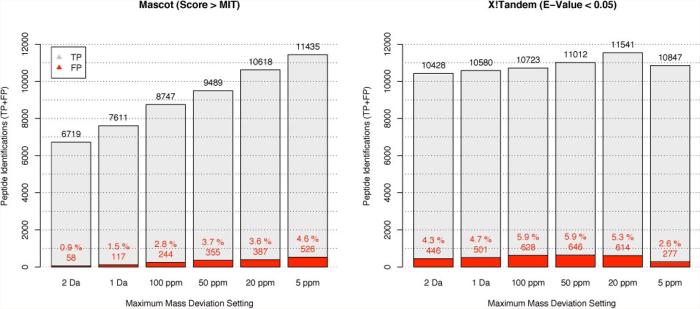
Mascot and X!Tandem searches were performed against a target database and a decoy database at different MMD settings. The total number of identifications is reported; the estimated number of true identifications is indicated in gray, and the estimated number of incorrect assignments is highlighted in red.
The MIT is based on a probabilistic model that attempts to maintain a constant rate of random (false) identifications and hence is dependent on search space. However, we found a correlation between FDRs and MMD settings, indicating that the MIT does not adhere to the predefined FDR. This trend is also mirrored in the number of correct identifications. At relaxed mass tolerances (large search space) used for ion trap data, the MIT tends to become very conservative resulting in excellent specificity but hindering sensitivity. With more stringent mass tolerances (smaller search space) sensitivity increases at the cost of specificity. The results reported here represent a snapshot of many possible combinations of search parameters that directly affect the search space: for example, sequence database size, allowed variable modifications, allowed missed cleavages, and enzyme specificity. This highlights the necessity to individually assess the FDR via a target/decoy database search.
Performance of the X!Tandem Scoring Scheme
Spectra were searched in X!Tandem using MMD settings as described in the previous section. FDRs were calculated on the basis of target and decoy database searches using identical search parameters.
Using an E-value cutoff value of 0.05, which is in line with that used for the MIT evaluation discussed above, only moderate changes (9%) in sensitivity over all MMD settings were detected, varying between 9982 TPs at 2 Da and up to 10,927 TPs at 20 ppm (Fig. 2, X!Tandem). A constant FDR for varying MMD settings was not delivered by X!Tandem. The FDRs increased from 4.3 to 5.9% between the 2-Da and 100-ppm MMD, and an inverse trend was observed below 100 ppm with a minimum of 2.6% FDR at 5-ppm MMD. FDRs show no clear correlation with mass tolerance settings, suggesting no direct dependence. The E-value distributions of these searches were very similar over the whole range, further supporting the robustness of the X!Tandem scoring (supplemental Information 4).
Overall X!Tandem appears to maintain sensitive peptide identification at varying MMD settings. The FDRs were close to the defined E-values but were not constant over changing mass tolerance settings. However, there appears to be no direct correlation between the FDRs and search space. These results indicate that the empirical X!Tandem scoring, based on peptide-spectra match score distributions, is more robust over the search space-dependent probabilistic scoring model of the MIT.
Performance of the Mascot Homology Threshold
Similarly to X!Tandem, the empirical MHT also utilizes peptide-spectra match score distributions. Using the results from the above Mascot searches, we plotted MHT distributions at different MMD settings (Fig. 1b). Only spectra that were assigned across all searches (23,080 of 38,058 queries) were used for comparison.
As stated earlier, the MHT is not always reported. An MHT value was reported for about 95% of the considered queries at relaxed MMD settings of 1 or 2 Da. For stringent MMD settings (5 ppm), MHTs were only reported for less than 60% of queries, limiting its applicability. The MHT median for a 1-Da MMD setting was 24 compared with an MIT median of 39 for the same setting, whereas the interquartile ranges were 9 and 1, respectively. The wide MHT variation observed would be reflective of a query-specific thresholding.
Using the MHT as a cutoff score for a 1-Da MMD search, 11,315 TPs were identified at the given FDR of 3.1%. This corresponds to 51% more TP identifications than using the MIT at the given 1.5% FDR and 12% more TP identifications than X!Tandem at the given FDR of 4.7%.
Overall we observed the MHT to be significantly more sensitive than the MIT and X!Tandem at the given FDRs. However, the FDR is preimposed and does not allow the user to select a fixed rate. Furthermore Mascot omits any MHT that exceeds the MIT to prevent conservative thresholds that arise for example from score distributions with insufficient data points. This effect is further compounded because the MIT values decrease for a smaller search space. Sufficient search space is required for the MHT to be comprehensively applicable; for example a larger or smaller database would need a more or less restrictive MMD setting to compensate for this effect.
Peptide Mass Accuracy Filtering
An alternative approach for using high mass accuracy for peptide identification is to search under relaxed mass tolerance settings and subsequently apply mass accuracy filters. To evaluate this approach, data were searched with Mascot at a 1-Da MMD setting against the target and decoy databases where ~95% of queries obtained an MHT.
As shown in supplemental Information 2, peptide-spectrum matches with high scores mostly lie within the experimental mass errors discussed previously, whereas low scoring matches were distributed evenly across the whole mass window. Mass accuracy filtering of the 1-Da search using 50-, 20-, and 5-ppm cut-offs, without imposing any other constraints such as MIT or MHT, limited the FDRs to 65, 35, and 12%, respectively. This clearly indicates that mass accuracy-based filtering alone can reduce incorrect sequence assignments. However, the effectiveness of this discriminator is confined by experimentally derived mass error deviations. Significantly 13,273 TPs were identified with a 5-ppm mass filter, more than obtained by any method tested here, showing this to be a very sensitive approach for peptide identification with high accuracy data.
The 12% FDR observed at 5-ppm mass accuracy filtering suggests that even higher mass accuracy would be required for lower FDRs. An extrapolation from a regression over 10 data points ranging from 5 to 50 ppm (r2 = 0.99) suggests a 5% FDR for 1.5 ppm; however, this prediction would need to be verified experimentally. It should be noted that the use of ultrahigh mass accuracies cannot further improve FDR once mass accuracies resolve elemental compositions.
If mass accuracies cannot be achieved at this stringent level, an alternative would be to introduce a moderate thresholding on the peptide-spectrum match scores. We therefore tested mass accuracy filtering in combination with the MHT score cutoff. For this, data were searched at 1-Da MMD, then filtered at 5 ppm to exclude all peptide assignments with a larger mass deviation, and subsequently constrained by the MHT. In instances where the MHT was not reported, the MIT was used. This two-step filtering identified 10,338 TP peptide assignments and reduced the FDR to only 0.2%, which is a 60-fold improvement over the mass accuracy filtering alone, although the TPs were reduced significantly (22%). In comparison with the Mascot search using a 5-ppm MMD setting with the MIT score cutoff where an FDR of 4.8% and 10,909 TPs were reported previously, the two-step filtering improved the FDR by 23-fold, whereas the TPs were reduced by only 6%.
These results suggest that mass accuracy filtering on its own might be a valuable and very sensitive approach; however, sub-ppm mass errors would be needed for highly specific identification. Alternatively a combination with a threshold such as the MHT serves as a very strong discriminator between correct and incorrect peptide assignments. In comparison with a direct high accuracy Mascot search, the two-step filtering strategy leads to highly specific identifications without significantly compromising sensitivity. A less restrictive and adjustable thresholding would increase sensitivity for peptide identification from high accuracy data.
The AMT
Applying either the MIT, MHT, or the two-step filtering provides preimposed FDRs that are not directly adjustable by the user. However, it is often desirable to be able to select and fix the FDR.
To achieve this we implemented the AMT. This is a strategy similar to the MATH threshold introduced by Rudnick et al. (1) that uses a global threshold that defines a cutoff value for all queries. However, we favor the use of individual query-specific thresholds based on the MHT because we found it to be very sensitive in our evaluations (see above). The AMT is defined as the sum of the query-specific MHT and a global offset value. FDRs are determined for a range of offset values that are used to calculate a linear regression to approximate an offset value for a user-defined FDR (Fig. 3).
Fig. 3. Regression for extrapolating the AMT thresholds.
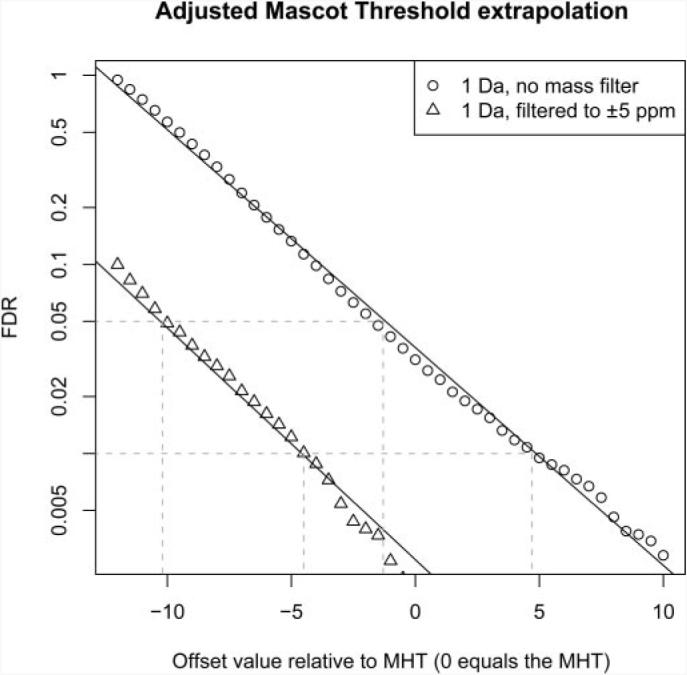
Data were searched at a 1-Da MMD setting against the target and decoy databases. A range of offset values was applied that were added to the MHT and used as cutoff thresholds. For each new threshold the associated FDR was determined. A linear regression between the logarithm of the FDR and the offset values was calculated (r2 = 0.99). The method was also applied to the mass accuracy-filtered data set (5 ppm). A new adjusted Mascot threshold can be extrapolated based on a user-defined FDR for each data set. The AMT adapts for the preceding mass accuracy filtering. Moreover the regression can be used to rescore peptide-spectra matches with empirical E-values, e.g. a match that scored 4.7 above the MHT for the unfiltered data set would obtain an E-value of 10−2.
For the 1-Da search, described in the previous section, the regression was calculated for an offset range of −12 to +10, indicating a strong linear correlation between the logarithm of FDRs and the offset values with a correlation coefficient of r2 = 0.99. For the 5-ppm mass-filtered data set, a second regression was calculated (r2 = 0.99). Offset values of 4.7 and −1.3 were reported for a target FDR of 1 and 5% using the 1 Da search data and for the 5-ppm mass accuracy-filtered data set these values were −4.5 and −10.2, respectively. The slope of both regressions was found to be very similar, but the difference between the offsets was approximately −9, which compensates for the inherent specificity of the mass accuracy-filtered data set by moderating these offset values.
Our proposed AMT is an adjustable and query-specific cutoff value. It is calculated based on the MHT and a global offset value; the latter is derived from FDR estimates through target/decoy database searching and thus is no longer dependent on search parameters affecting search space. AMT can be extrapolated for either low or high accuracy (using mass-filtered data) and combines the benefits of a highly sensitive MHT with a user-defined FDR.
Comparison of the AMT with MIT, MHT, X!Tandem, and MATH
We then tested the performance of the AMT. Search results obtained by application of AMT were compared with those from MIT, MHT, X!Tandem, and MATH using a receiver-operator characteristic representing the number of true identifications at various FDRs. Receiver-operator characteristic curves (Fig. 4) were calculated using varying thresholds of MATH (global cutoff value), X!Tandem (E-values), and AMT (offset values relative to MHT). Because the MIT and MHT are not variable, they define a single point in the diagram.
Fig. 4. MIT, MHT, MATH, X!Tandem, and AMT comparison for low and high accuracy mass tolerance settings.

A 1-Da search (left), a 5-ppm search (right, circles), and a 1-Da search with subsequent peptide mass accuracy filtering at 5 ppm (right, triangles) were performed. The TPs and false discovery rates were determined and represented in the receiver-operator curve, enabling the user to choose the best trade-off between sensitivity (TPs) and specificity (false discovery rate).
For low accuracy MMD settings (Fig. 4a) applying the MIT identified 7494 TPs with an inherent 1.5% FDR. MIT variation for these mass tolerance settings effectively acts as a global cutoff; hence MATH also identified a similar number at the same FDR. MATH, however, allows the user to freely select the target FDR, and at a 5% FDR it identified about 20% more TP peptides than at 1.5% FDR. X!Tandem empirical scoring outperformed both MIT (13% more TPs at the same FDR of 1.5%) and MATH (between 10–15% more TPs over the whole range of FDRs). The most striking observation was the MHT performance, identifying 11,315 TPs at the inherent FDR of 3.1%, improving correct identifications by 18 and 35% over X!Tandem and MATH at the same FDR. The AMT extends application of the MHT over the whole range of FDRs, improving the TP assignments by 18, 39, and 42% over X!Tandem, MIT, and MATH at 1.5% FDR and by 16 and 30% over X!Tandem and MATH at 5% FDR.
For the analysis of high accuracy data we evaluated two strategies: strategy I, searching high accuracy data at stringent mass tolerance settings (5 ppm) followed by peptide score thresholding (Fig. 4b, circles), and strategy 2, searching high accuracy data at a relaxed mass window (1 Da) with subsequent peptide mass accuracy filtering (5 ppm) followed by peptide score thresholding (Fig. 4b, triangles). For strategy I, using direct high mass accuracy searching at a 5-ppm MMD setting, the number of expected true peptide identifications was similar, ~11,000, for MIT, X!Tandem, and MATH at around 4.5% FDR. However, X!Tandem performed better for lower FDRs, e.g. at 1% X!Tandem identified about 1000 more TPs than MATH. MHT was not assessed at these mass tolerance settings because it was absent for 40% of queries.
For strategy II, the alternative mass filtering approach returned very conservative FDRs below 0.2% and identified 6798 and 10,338 TP hits for the MIT and MHT, respectively. Mass-filtered X!Tandem results identified ~25% more peptides than the MIT and 18% fewer TP hits than with the MHT at the corresponding FDRs. By relaxing the E-values of X!Tandem, 10,611 TPs at 1% FDR and 12,100 TPs at 5% FDR were identified. Using MATH, 6821 TP assignments were made at the 0.2% FDR, which is again similar to MIT and significantly worse than X!Tandem or MHT. At a 1% FDR about 18% fewer identifications were made using MATH as compared with X!Tandem, whereas they performed similarly at 5% FDR. Significantly the AMT identified 11,893 TP assignments at 1%, outperforming both MATH and X!Tandem by 35 and 12% at the same FDR.
Compared with the direct 5-ppm search strategy in strategy I, the mass accuracy filter approach in strategy II was generally more sensitive, e.g. MATH and X!Tandem with mass filtering identified about 8–9% more TPs at 5% FDR than without mass filtering. The improvement of performance with X!Tandem can be seen throughout the whole range of FDRs, whereas for MATH sensitivity is only gained above a 1% FDR. By far the most sensitive approach at any given FDR was provided by mass accuracy filtering combined with the AMT. Against a direct 5-ppm search using MIT, MATH, and X!Tandem, about 18–20% more TPs at an FDR of 4.6% were made, corresponding to ~1500 more unique peptide identifications.
In summary, application of MIT or MHT always results in a fixed preimposed FDR, whereas X!Tandem together with a target/decoy database search enables FDR adjustment using an appropriate E-value cutoff. MATH and AMT implement this target/decoy FDR estimation and directly deliver the defined FDRs. For low accuracy MS, MHT performed best at a fixed FDR, whereas this performance was extended to the whole FDR range by AMT. X!Tandem was significantly less sensitive than AMT, and MATH together with the MIT were the least sensitive thresholds. For direct high mass accuracy searching, MIT, MATH, and X!Tandem performance was very similar, and overall sensitivity improved over the low accuracy search. Exploiting high mass accuracy via mass filtering was the most sensitive search strategy at the corresponding FDRs. For this approach, AMT significantly outperformed X!Tandem followed by MATH and MIT.
Conclusion
In this study we investigated how MMD settings affect peptide identification using Mascot and X!Tandem and presented an alternative search strategy and an AMT to enable sensitive identification of high accuracy data with Mascot.
We demonstrated the correlation between the MIT and search space, which is for example affected by MMD settings. We showed that the MIT can be very conservative for MMD settings commonly used for ion trap data, leading to very specific identifications at the expense of sensitivity, whereas it tends to become more optimistic for stringent MMD settings used for high accuracy data. The MHT was found to be significantly more sensitive for ion trap data but is not comprehensively applicable to very stringent MMD settings commonly used for high accuracy data. However, the actual FDRs for both MIT and MHT are preimposed and deviate from the theoretically defined rate. Furthermore our results indicate that X!Tandem is more robust than the MIT and MHT when faced with MMD changes and is equally applicable to both low and high accuracy MS data with a sensitivity that was better than using the MIT but worse than using the MHT.
We also investigated the use of mass accuracy filtering as the sole discriminator between correct and incorrect peptide assignments. Mass accuracy filtering served as a highly sensitive discriminator with limited specificity, and sub-ppm mass errors would be needed for more specific identifications. Alternatively a two-step filtering strategy can be used. We first searched the data at relaxed MMD settings followed by applying mass accuracy filtering. The results demonstrate that combining peptide mass accuracy filtering with the MHT serves as a very strong discriminator, efficiently eliminating incorrect peptide assignments, although sensitivity was limited. To regain sensitivity we propose an AMT that allows the user to freely select the best trade-off between sensitivity and specificity by having full control over the actual FDR. The AMT can easily be applied on top of any Mascot search where target/decoy searching is amenable. It is independent of search parameters affecting the search space and is expected to adjust with MS/MS data quality. AMT outperformed MIT and MHT as well as MATH and X!Tandem for both low and high accuracy MS data.
Supplementary Material
Acknowledgments
We thank John Cottrell for helping with Mascot-related questions and David Fenyo for supporting information regarding X!Tandem. We also thank all members of teams 17 and 71 from the Wellcome Trust Sanger Institute for help and support. In particular we thank Lu Yu for providing the MS data and Mercedes Pardo and Jenny Mattison for critically reading the manuscript.
Footnotes
This work was supported by the Wellcome Trust. The costs of publication of this article were defrayed in part by the payment of page charges. This article must therefore be hereby marked "advertisement" in accordance with 18 U.S.C. Section 1734 solely to indicate this fact.
The on-line version of this article (available at http://www.mcponline.org) contains supplemental material.
The abbreviations used are: MMD, maximum mass deviation; MIT, Mascot identity threshold; MHT, Mascot homology threshold; MATH, mass accuracy-based threshold; AMT, adjusted Mascot threshold; FP, false positive; TP, true positive; FDR, false discovery rate; E-value, expectation value; Bis-Tris, 2-[bis(2-hydroxyethyl)-amino]-2-(hydroxymethyl)propane-1,3-diol.
REFERENCES
- 1.Rudnick P, Wang Y, Evans E, Lee C, Balgley B. Large scale analysis of MASCOT results using a Mass Accuracy-based THreshold (MATH) effectively improves data interpretation. J. Proteome Res. 2005;4:1353–1360. doi: 10.1021/pr0500509. [DOI] [PubMed] [Google Scholar]
- 2.Aebersold R, Mann M. Mass spectrometry-based proteomics. Nature. 2003;422:198–207. doi: 10.1038/nature01511. [DOI] [PubMed] [Google Scholar]
- 3.de Godoy L, Olsen J, de Souza G, Li G, Mortensen P, Mann M. Status of complete proteome analysis by mass spectrometry: SILAC labeled yeast as a model system. Genome Biol. 2006;7:R50. doi: 10.1186/gb-2006-7-6-r50. [DOI] [PMC free article] [PubMed] [Google Scholar]
- 4.Foster L, de Hoog C, Zhang Y, Zhang Y, Xie X, Mootha V, Mann M. A mammalian organelle map by protein correlation profiling. Cell. 2006;125:187–199. doi: 10.1016/j.cell.2006.03.022. [DOI] [PubMed] [Google Scholar]
- 5.Washburn M, Wolters D, Yates JR. Large-scale analysis of the yeast proteome by multidimensional protein identification technology. Nat. Biotechnol. 2001;19:242–247. doi: 10.1038/85686. [DOI] [PubMed] [Google Scholar]
- 6.Hunt D, Henderson R, Shabanowitz J, Sakaguchi K, Michel H, Sevilir N, Cox A, Appella E, Engelhard V. Characterization of peptides bound to the class I MHC molecule HLA-A2.1 by mass spectrometry. Science. 1992;255:1261–1263. doi: 10.1126/science.1546328. [DOI] [PubMed] [Google Scholar]
- 7.McCormack A, Schieltz D, Goode B, Yang S, Barnes G, Drubin D, Yates JR. Direct analysis and identification of proteins in mixtures by LC/MS/MS and database searching at the low-femtomole level. Anal. Chem. 1997;69:767–776. doi: 10.1021/ac960799q. [DOI] [PubMed] [Google Scholar]
- 8.Hu Q, Noll R, Li H, Makarov A, Hardman M, Graham Cooks R. The Orbitrap: a new mass spectrometer. J. Mass Spectrom. 2005;40:430–443. doi: 10.1002/jms.856. [DOI] [PubMed] [Google Scholar]
- 9.Syka J, Marto J, Bai D, Horning S, Senko M, Schwartz J, Ueberheide B, Garcia B, Busby S, Muratore T, Shabanowitz J, Hunt D. Novel linear quadrupole ion trap/FT mass spectrometer: performance characterization and use in the comparative analysis of histone H3 post-translational modifications. J. Proteome Res. 2004;3:621–626. doi: 10.1021/pr0499794. [DOI] [PubMed] [Google Scholar]
- 10.Haas W, Faherty B, Gerber S, Elias J, Beausoleil S, Bakalarski C, Li X, Villen J, Gygi S. Optimization and use of peptide mass measurement accuracy in shotgun proteomics. Mol. Cell. Proteomics. 2006;5:1326–1337. doi: 10.1074/mcp.M500339-MCP200. [DOI] [PubMed] [Google Scholar]
- 11.Craig R, Beavis R. TANDEM: matching proteins with tandem mass spectra. Bioinformatics. 2004;20:1466–1467. doi: 10.1093/bioinformatics/bth092. [DOI] [PubMed] [Google Scholar]
- 12.Eng J, McCormack A, Yates J. An approach to correlate tandem mass spectral data of peptides with amino acid sequences in a protein database. J. Am. Soc. Mass Spectrom. 1994;5:976–989. doi: 10.1016/1044-0305(94)80016-2. [DOI] [PubMed] [Google Scholar]
- 13.Geer L, Markey S, Kowalak J, Wagner L, Xu M, Maynard D, Yang X, Shi W, Bryant S. Open mass spectrometry search algorithm. J. Proteome Res. 2004;3:958–964. doi: 10.1021/pr0499491. [DOI] [PubMed] [Google Scholar]
- 14.Perkins D, Pappin D, Creasy D, Cottrell J. Probability-based protein identification by searching sequence databases using mass spectrometry data. Electrophoresis. 1999;20:3551–3567. doi: 10.1002/(SICI)1522-2683(19991201)20:18<3551::AID-ELPS3551>3.0.CO;2-2. [DOI] [PubMed] [Google Scholar]
- 15.Anderson D, Li W, Payan D, Noble W. A new algorithm for the evaluation of shotgun peptide sequencing in proteomics: support vector machine classification of peptide MS/MS spectra and SEQUEST scores. J. Proteome Res. 2003;2:137–146. doi: 10.1021/pr0255654. [DOI] [PubMed] [Google Scholar]
- 16.Resing K, Meyer-Arendt K, Mendoza A, Aveline-Wolf L, Jonscher K, Pierce K, Old W, Cheung H, Russell S, Wattawa J, Goehle G, Knight R, Ahn N. Improving reproducibility and sensitivity in identifying human proteins by shotgun proteomics. Anal. Chem. 2004;76:3556–3568. doi: 10.1021/ac035229m. [DOI] [PubMed] [Google Scholar]
- 17.Ulintz P, Zhu J, Qin Z, Andrews P. Improved classification of mass spectrometry database search results using newer machine learning approaches. Mol. Cell. Proteomics. 2006;5:497–509. doi: 10.1074/mcp.M500233-MCP200. [DOI] [PubMed] [Google Scholar]
- 18.Fenyo D, Beavis R. A method for assessing the statistical significance of mass spectrometry-based protein identifications using general scoring schemes. Anal. Chem. 2003;75:768–774. doi: 10.1021/ac0258709. [DOI] [PubMed] [Google Scholar]
- 19.Zubarev R, Mann M. On the proper use of mass accuracy in proteomics. Mol. Cell. Proteomics. 2007;6:377–381. doi: 10.1074/mcp.M600380-MCP200. [DOI] [PubMed] [Google Scholar]
- 20.Elias J, Gygi S. Target-decoy search strategy for increased confidence in large-scale protein identifications by mass spectrometry. Nat. Methods. 2007;4:207–214. doi: 10.1038/nmeth1019. [DOI] [PubMed] [Google Scholar]
- 21.Savitski M, Nielsen M, Zubarev R. New data base-independent, sequence tag-based scoring of peptide MS/MS data validates Mowse scores, recovers below threshold data, singles out modified peptides, and assesses the quality of MS/MS techniques. Mol. Cell. Proteomics. 2005;4:1180–1188. doi: 10.1074/mcp.T500009-MCP200. [DOI] [PubMed] [Google Scholar]
- 22.Biemann K. Contributions of mass spectrometry to peptide and protein structure. Biomed. Environ. Mass Spectrom. 1988;16:99–111. doi: 10.1002/bms.1200160119. [DOI] [PubMed] [Google Scholar]
- 23.Roepstorff P, Fohlman J. Proposal for a common nomenclature for sequence ions in mass spectra of peptides. Biomed. Mass Spectrom. 1984;11:601. doi: 10.1002/bms.1200111109. [DOI] [PubMed] [Google Scholar]
- 24.Beausoleil S, Villen J, Gerber S, Rush J, Gygi S. A probability-based approach for high-throughput protein phosphorylation analysis and site localization. Nat. Biotechnol. 2006;24:1285–1292. doi: 10.1038/nbt1240. [DOI] [PubMed] [Google Scholar]
- 25.Everley P, Bakalarski C, Elias J, Waghorne C, Beausoleil S, Gerber S, Faherty B, Zetter B, Gygi S. Enhanced analysis of metastatic prostate cancer using stable isotopes and high mass accuracy instrumentation. J. Proteome Res. 2006;5:1224–1231. doi: 10.1021/pr0504891. [DOI] [PubMed] [Google Scholar]
- 26.Cargile B, Bundy J, Stephenson JJ. Potential for false positive identifications from large databases through tandem mass spectrometry. J. Proteome Res. 2004;3:1082–1085. doi: 10.1021/pr049946o. [DOI] [PubMed] [Google Scholar]
- 27.Peng J, Elias J, Thoreen C, Licklider L, Gygi S. Evaluation of multidimensional chromatography coupled with tandem mass spectrometry (LC/LC-MS/MS) for large-scale protein analysis: the yeast proteome. J. Proteome Res. 2003;2:43–50. doi: 10.1021/pr025556v. [DOI] [PubMed] [Google Scholar]
- 28.Nesvizhskii A, Aebersold R. Analysis, statistical validation and dissemination of large-scale proteomics data sets generated by tandem MS. Drug Discov. Today. 2004;9:173–181. doi: 10.1016/S1359-6446(03)02978-7. [DOI] [PubMed] [Google Scholar]
Associated Data
This section collects any data citations, data availability statements, or supplementary materials included in this article.